MODELING THE RELATION BETWEEN CCN AND THE VERTICAL EVOLUTION OF CLOUD
DROP SIZE DISTRIBUTION IN CONVECTIVE CLOUDS WITH PARCEL MODEL
GÉRSON PAIVA ALMEIDA
1, 2& RÔMULO RODRIGUES DOS SANTOS
1 1Universidade Estadual do Ceará (UECE)
Curso de Física, Fortaleza – CE, Brazil
2E-mail: [email protected]
Received February 2006 - Accepted July 2006
ABSTRACT
In this work we use values of effective radius of cloud drop size distribution and modal radius of liquid water content generated with a parcel model with detailed treatment of liquid phase microphysical process to evaluate the warm rain formation suppression over the Amazon due to the presence of aerosols generated by forest burning. Four cases based on observations are simulated: a clean marine environment as the one observed close to Fortaleza; a clean environment as the ones observed over the apparently unpolluted Amazon forest; a environment observed during the intense burning season in the polluted part of the Amazon; and the same polluted environment observed during the transition season from dry to wet. It is shown that the model reproduces quantitatively some of the observed features of clouds in different environments. The model indicated that in very polluted environment the warm rain formation process can be completely suppressed. Nevertheless, in certain situations the formation of warm rain can still be achieved and signifi cant amount of rainwater can be formed. Keywords: numerical modeling, parcel model, CCN and cloud drop size distribution.
RESUMO: MODELAGEM DA RELAÇÃO ENTRE CCN E A EVOLUÇÃO VERTICAL DA
DISTRIBUIÇÃO DE TAMANHOS DE GOTAS DE NUVENS CONVECTIVAS COM MODELO DE PARCELA.
Neste trabalho usamos valores de raio efetivo de distribuição de tamanho de gotas e raio modal de conteúdo de água liquida gerados com um modelo de parcela com tratamento detalhado dos processos de microfísica de fase líquida para avaliar a supressão da formação de chuva quente sobre a Amazônia devido à presença de aerossóis gerados pela queima da fl oresta. Quatro casos baseados em observações são simulados: um ambiente marinho limpo como aqueles encontrados próximos a Fortaleza; um ambiente limpo como aqueles encontrados sobre a parte preservada da fl oresta amazônica; um ambiente observado durante a estação de intensa queima da fl oresta; e o mesmo ambiente observado durante a transição de seco para úmido. É mostrado que o modelo de parcela é capaz de reproduzir quantitativamente algumas das características observadas das nuvens em diferentes ambientes. O modelo indica que em ambientes poluídos o processo de formação de chuva quente pode ser completamente inibido. Entretanto, em certas situações a formação de chuva quente ainda pode acontecer e uma quantidade signifi cativa de água de chuva pode ser formada.
1. INTRODUCTION
It is well known that warm rain initiation is a complex, non-linear process (Beard and Ochs, 1992). In the early stage of cloud development, droplets are activated at the cloud base and grow via vapor diffusion during their ascent. When some of them reach a certain autoconversion threshold, close to the cloud top, the fi rst precipitation embryos are formed. Those embryos start to fall through the cloud layer, forming the precipitation through collection of smallest droplets. This second stage does not depend on the concentration of activated droplets at the cloud base, but the formation of the precipitation embryos does.
According to satellite and local observations (Rosenfeld and Gutman, 1994; Gerber, 1996) the appearance of precipitation is correlated to a required effective radius (defined as
reffe= r f r dr
( )
r f r dr( )
∞ ∞
∫
3∫
0
2
0
, where f(r) is the drop size distribution function) threshold for the drop spectrum, after which the warm rain process takes place. We will call this value reffe the warm rain threshold (rwr=14 μm) and the altitude in which such a threshold is reached inside a parcel in a convective cloud core, “warm rain height”.
As suggested in previous works in which satellite and radar data are analyzed (e.g., Rosenfeld, 1999), pollution acts severely in cloud microstructure, increasing the number of droplets per unit volume and reducing their mass, as the available water vapor condenses in a larger concentration of cloud condensation nuclei. The consequence, as suggested by many authors, is the inhibition of warm rain formation through collision-coalescence processes.
It is a common procedure to farmers at Amazon to burn forest while preparing the land for plantation of pasture during the dry season. The fi res produce a large amount of small aerosols (mainly via gas-to-particle conversion) and some giant and ultragiant aerosols, mostly composed of soot particles and leached ashes. As a result of large amount of CCN, clouds with large droplet concentrations are produced. Due to its small size, those droplets are not collected by the potential precipitation embryos, which would enable the production of warm rain. As a consequence of this and the fact that large scale environment usually has reduced relative humidity, which leads to elevated condensation levels, rain is produced essentially through the cold phase, inside the cells with the necessary vertical development to produce ice.
In this work, we simulate the variability in cloud microphysics structure observed during the LBA/EMfi N!/ SMOCC-2002 (Large Scale Biosphere-Atmosphere Experiment in Amazonia/ Experimento de Microfísica de Nuvens/Smoke Aerosols, Clouds, Rainfall and Climate) experiment and the infl uence of pollution on the warm rain initiation. Simulations
span a wide range of situation varying from a clean marine to a very polluted environment. Moreover we present a parameterization to the liquid water content (LWC) as a function of the effective radius to account for the depth a cloud needs to attain to produce the fi rst precipitation embryo. This parameterization can be straightforward applied to the cloud depth as a function of the effective radius, since the LWC is approximately a linear function of height.
2. BRIEF CAMPAIGN DESCRIPTION
The cloud microphysical campaign consisted of several fl ights and took place from 21 September to 18 October 2002 and was especially designed to investigate different microphysical regimes observed during the dry-to-wet transition period in the Amazon basin. Figure 1 shows a map of the experimental sites. A detailed campaign description is found in Andreae et al. (2004).
Figure 1 – Aircraft trajectories for the LBA/SMOCC/EmfiN!
experiments flights by the ALPA instrumented aircraft, between 21 September and 18 October. Cities are indicated by numbers: 1. Fortaleza, 2. Teresina, 3. Marabá, 4. Alta Floresta, 5. Ji-Paraná, 6. Porto Velho, 7. Vilhena, 8. Rio Branco, 9. Cruzeiro do Sul.
The measurements were made using the instrumented aircraft of Universidade Estadual do Ceará, UECE, fi tted with instruments for cloud microphysics measurements and also CCN spectra on some occasions. The data used in this paper came from two instruments: the UW83-1 CCN counter, and a FSSP-100, modifi ed by Droplet Measurements Technology.
C and k were used for each microphysical regime. According to different values of C and k, masses are classifi ed from clean to very polluted .
The different sites investigated encompass four different types of environments: 1) environments found at Northeast Brazil Coast, which receives aerosols mainly from Atlantic Ocean, due to the predominantly easterly fl ow. Due to their main source of cloud nuclei this environment was called “Blue Ocean”; 2) environments found at Westerly Amazon, over which the forest remains mostly untouched (called “Green Ocean” due to the fact that CCN found at those places show characteristics of clean marine environment; Roberts et al., 2001); 3) environments found over Rondônia, during the month of October, after signifi cant rain events (called “Transitional”); and 4) environments observed over Mato Grosso and Rondônia states, where a large number of fires is responsible for a signifi cant aerosol loading every year, usually until September (called “Polluted”).
3. PARCEL MODEL SIMULATIONS
The use of a parcel model to evaluate modifi cation of the cloud ability to produce rain is questionable. First because the use of a parcel model to simulate rain formation is not appropriate since the parcel model assumes that all particles and drops are confi ned in the ascending volume. Second, because in the cases in which the droplets grow to large sizes (and also their masses increases) their fall velocities exceed the updraft of the parcel, and thus they would leave the ascending parcel. Third, there is no feedback between the growth of clouds particles and the cloud dynamics, since the model only treats the microphysics of the growth and does not the effect of released latent heat. Therefore the use of a parcel model is only appropriated for the early development stage of the cloud when the particles are still very small, which is suitable for the investigation carried out here.
The numerical model is the parcel version of Almeida et al. (1998), Almeida (1997), and Costa et al.’s (2000). In this version the model comprises prognostic equation for 178 categories of cloud condensation nuclei (CCN), and 100 categories of liquid phase hydrometeors. The microphysical processes are represented as source/sink terms in the prognostic equations for CCN and droplet distribution.
∂ ∂ = − ∂ ∂ ⎛ ⎝⎜ ⎞ ⎠⎟ = n t n t j j j nuc
1,...,178 (1)
∂ ∂ = ∂ ∂ ⎛ ⎝⎜ ⎞ ⎠⎟ + ∂ ∂ ⎛ ⎝⎜ ⎞ ⎠⎟ + ∂ ∂ ⎛ ⎝⎜ ⎞ ⎠⎟ + ∂ ∂ ⎛ ⎝ f t f t f t f t f t i i nuc i con i coa i ⎜⎜ ⎞⎠⎟ +⎛⎝⎜∂∂ ⎞⎠⎟ cbrk i sbrk f t
i = 1, ..., 100 (2)
Due to the fact that only small nuclei can reach their equilibrium size quickly (Mordy, 1959), the procedure adopted
by Kogan (1991) is used to estimates the radius of the activated droplet at cloud base. So, only small nuclei are activated when supersaturation exceeds the critical value determined by Köhler’s curve.
Condensation growth is calculated as given by Mordy (1959). The curvature term is neglected for raindrops (radius greather than 50 µm) and the solute term is taken into account during only one microphysical time step.
Al changes due collision-coalescence, collision-beakup and spontaneous breakup are considered. Coalescence and colisional breakup probabilities are calculated according to Low and List (1982a). Filament, sheet and disk breakup are represented following Low and List (1982b) for distribution-function to of droplet fragments. Spontaneous breakup is incorporated following Kamra et al., 1991).
The 178 CCN particles categories allow representing CCN of all different sizes and chemical compositions. For this study, the CCN distribution function is obtained for nuclei radius ranging from approximately 0.006μm up to 6.293 μm, which corresponds to supersaturation from 4% to approximately zero, and is supposed to be composed by (NH4)2SO4. It can be shown that CCN size distribution, following any relation of the type N = Csk, can be obtained by adding relations of the form
f A r
r r
i = i ⎛ ⎝⎜ ⎞ ⎠⎟ − 0 α β
exp( ) (3).
With different values of Ai, α, r0 and β. We adopted this procedure to represent each environment simulated, with the respective values of c and k, to represent any different aerosol, from the clean to the very polluted situation.
The numerical parcel model simulations are performed with a prescribed vertical velocity of 5.00 m/s, which are typically the values of velocities found in core of convective clouds cells. The model was initialized using conditions typically found during the rainy season in Fortaleza: surface pressure of 960 hPa, temperature of 303 K, and relative humidity of 80%. As a result, the simulated cloud base was about 460 m.
5. DROPLETS SPECTRA FOR DIFFERENT CCN REGIMES
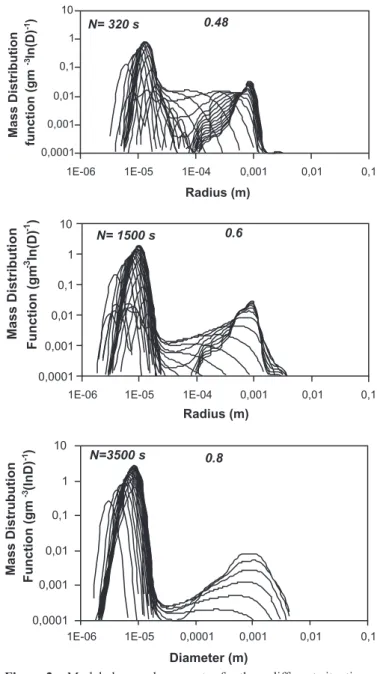
To illustrate the ability of the numerical model in reproducing qualitatively the microphysical characteristics of clouds in different environments, examples of mass distribution-function are shown in Figures 2a, 2b and 2c.
2700 m), which agrees with observations of radar echoes of rain clouds with tops below 3 km at Fortaleza.
During the “transition season”, the environment still presents a high concentration of aerosols, but in an amount slightly lower than that found in the middle of the burning season. Also more water becomes available due to the change in the large scale circulation over the Amazon region. As a consequence, raindrop size particles appear faster and are able to collect somewhat larger (compared to their counterparts in a polluted environment) droplet. Some warm rain may develop in this situation, as suggested in Figure 2b.
In a polluted environment, the distribution function shows typically one mode (as in Fig. 2c), composed of small droplets (modal radius close to 10 μm). It is noticeable that the small particle mode does not widen as in the blue ocean case. Because very small particles essentially follow the air fl ow around falling large particles, collection of small droplets by the large particles do not occur and warm rain does not develop in the early stage of the parcel ascent.
Figure 3 shows the warm rain height (as defined previously) as a function of droplet concentration for simulated condition ranging from a very clean to a very polluted situation for a ascending speed of 5.0 m/s. Simulations also point out that changes in large scale conditions, i.e., a higher water vapor supply in the environment, can contribute signifi cantly to the reduction of the warm rain initiation altitude. Figure 3 also shows the comparison of 3 simulations, where the initial relative humidity was modifi ed. The height of the clouds base evidently tends to diminish with the increase of the initial relative humidity, but the effect of a higher humidity on the warm rain initiation altitude is still more signifi cant, especially for droplet concentrations higher than 1000 cm-3. For droplet concentrations of about 2000 cm-3, as the ones found in the polluted and transition season, a reduction of 10% in the relative humidity causes a rise of the altitude of warm rain of more than 1200 m. This result suggests that the relative humidity in the atmosphere is the most important factor to determine the warm rain occurrence during the transition season.
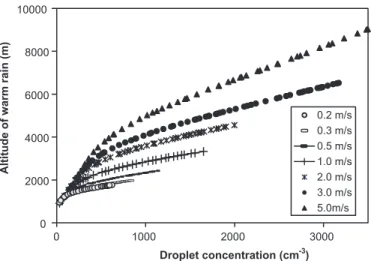
Figure 4 shows the modifi cation on the altitude of warm rain formation when different vertical velocities are imposed to the model. Velocities are set to 0.20, 0.30, 0.50, 1.00, 2.00, 3.00, and 5.00 m/s. As we can see, at low vertical ascents (up to 2.0 m/s) drop concentration does not increase beyond 2000 cm-3. It means that, at low vertical velocities, the maximum supersaturation reached in the parcel air permits only a small fraction of the CCN to be activated. Certainly, this fraction represents the largest nuclei in the spectrum. When higher vertical velocity is imposed, a higher fraction is activated, producing higher concentration, which, in its turn, leads to the suppression of warm rain formation.
N= 320 s 0.48
0,0001 0,001 0,01 0,1 1 10
1E-06 1E-05 1E-04 0,001 0,01 0,1
Radius (m)
Mass
Distribution
function
(gm
-3ln(D) -1)
N= 1500 s 0.6
0,0001 0,001 0,01 0,1 1 10
1E-06 1E-05 1E-04 0,001 0,01 0,1
Radius (m)
Mass
Distribution
Function
(gm
-3 ln(D) -1 )
N=3500 s 0.8
0,0001 0,001 0,01 0,1 1 10
1E-06 1E-05 0,0001 0,001 0,01 0,1
Diameter (m)
Mass
Distrubution
Function
(gm
-3(lnD) -1)
Figure 2 – Modeled mass drop spectra for three different situations: (a) clean environment, (b) transition end (c) polluted
0 2000 4000 6000 8000
0 1000 2000 3000
Drop concentration (cm-3)
Height
(m)
80% 90% 70%
Figure 3 – Warm rain height as a function of drop concentration for
0 2000 4000 6000 8000 10000
0 1000 2000 3000
Droplet concentration (cm-3)
Altitude
of
warm
rain
(m)
0.2 m/s 0.3 m/s 0.5 m/s 1.0 m/s 2.0 m/s 3.0 m/s 5.0m/s
Figure 4 – Altitude of warm rain formation as a function of cloud
droplet concentration for different vertical velocities.
6. MODELED EFFECTIVE RADIUS X MODAL RADIUS
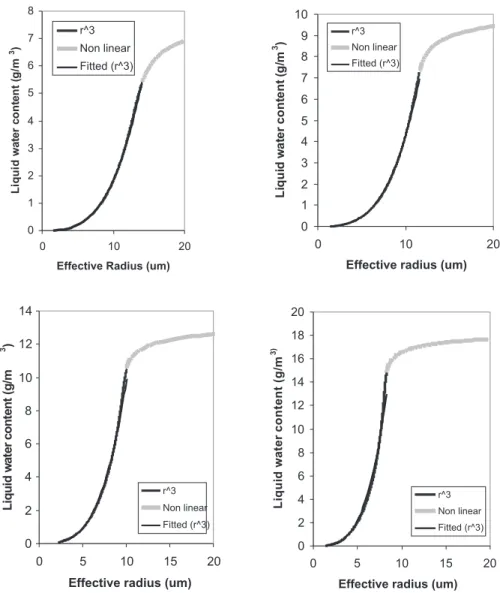
As we can see in Figures 5a to 5d the relation between the modeled LWC and reffe follows a approximately 3 power law (with correlation up to 0,9998), although a exponential profi le can also be applied (with lower correlation, in this case ~ 0.9766). In Figure 5a, 5b, 5c, 5d, the mean concentrations are 360, 760, 1530, and 3200, for an ascending speed of 5.0 m/s. As drop concentration increase the spectrum becomes more peaked. As a consequence, the exponent power law deviates from the 3 values, growing with the increasing concentration of fi nest portion of the CCN and according to the nucleation of new small droplet.
The blue ocean case shows a nearly 3 exponent power growth for reffe, going straightforward to 14 μm. According to this power law tendency, only the clouds formed in condition close to that found in Fortaleza would be able to produce warm rain, since the values of reffe=14 μm would be attained only above the freezing level for cloud with drop concentration greater than approximately 500 cm-3. The growth rate of the r
effe dependent on the drop concentration. In the blue oceans cases it reaches 14 μm in less than 1500 m for the 2 m/s ascending rate case (295 cm-3), and about 2000 m for the 5 m/s ascending rate case (360 cm-3). In the polluted case the r
effe reaches only about 7.2 μm after 3000 m cloud depth. The reffe growth in the polluted case is very slow. The value of 8.5 μm, for instance, is reached only after approximately 6200 m cloud depth.
Above a certain point, the relation between LWC and reffe deviates quickly from the 3 power law trend due to the non-linear nature of the warm rain formation process. We can also see that, according to the drop concentration, the values of reffe=14 μm are attained only for relatively high values of LWC in the case of polluted clouds.
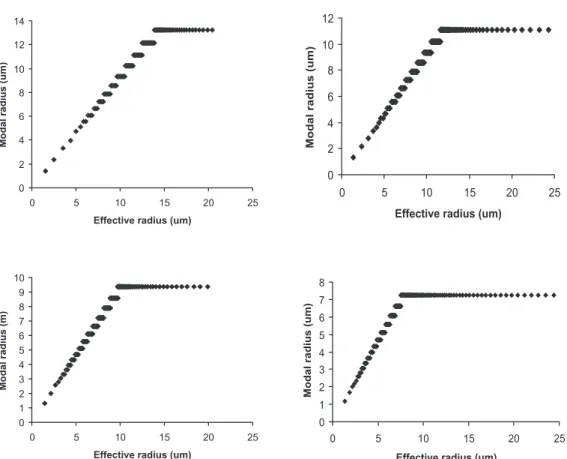
In the case of a moderately polluted, as can be characterized by the transition period from the dry season to the rainy season in the Amazon, the precipitating modal particle is less developed than the clean continental environment, as expected. Moreover, it reveals that the modal radius does not overcome the values of ~ 10 μm and doesn’t show a continuous growth in the parcel model. In Figure 6a, for example, the values of reffe and modal radius are extremely well correlated up to 14 μm in the blue ocean case, despite the scattering of data due to the bin nature of the radius representation. After this interval the values of reffe increase while the modal radius stays constant. This saturation also occurs in other simulations, except that, as drop concentration increases, the saturation modal radius values decreases. This results are supported by the work of Freud et al. (2005) in which modal radius does not show an undefi ned growth tendencies as that demonstrated by the reffe.
In a recent paper Costa and Sherwood (2004) used this same model to determine the height of warm rain formation as a function of modal radius. There they indicate the height of warm rain formation as the height where the modal radius attains a value of about 12μm. According to what is shown here, neither this model does produce modal radius bigger than 10μm with drop concentration higher than 1500 cm-3, nor a droplet concentration higher than 2000 cm-3 can be obtained at a 2.0 m/s ascending rate with a realistic CCN distribution. According to this result, the Costa and Sherwood (2004)’s results are not consistent.
A proposition for a curve to represent the relation between the reffe and the LWC obtained with the parcel model is proposed and shown in Figure 7. It is represented according to the relation
LWC= N +tgh reffe−c
⎛ ⎝⎜
⎞ ⎠⎟ ⎡
⎣
⎢ ⎤
⎦ ⎥ 1
2 3
1
2 1 (4)
which fi ts well the behavior of reffe from 3 to 20 μm. In (3) N1 (g/m3) = 4.78 ln(N) – 22.29, and c1(m2/3) = 10.26N-0.1219, where N is the mean drop concentration in cm-3. These results can be applied to evaluate the depth a cloud from any type of air masses needs to develop to generate the fi rst precipitation embryo necessary to produce warm rain.
In polluted environments droplet concentrations are much higher, often exceeding 2500 cm-3. Such increased droplet concentration suggest a signifi cant suppression of precipitation development in the warm phase, since the available water vapor condenses in a large number of very small particles with little chance of coagulation.
The transitional environments show values of droplet concentration that are close to the ones found in the polluted counterpart. This suggests that the greater precipitation effi ciency of clouds during such period is not only due to CCN and droplet concentration.
Figure 8 depicts the values of observed reffe according to the cloud depth for four regimes observed during the SMOCC/EmfiN!/LBA experiment. Points represent
Figure 5 – LWC as a function of reffe for four situation simulated by the parcel model (a)
Blue ocean; (b) Green Ocean; (c) Transition, and (d) Polluted. In the fi rst part of each graphs
the relation between LWC and reffeare represented by LWC=0 001reffe 3 1707
. . (R=0.9998); LWC=0 0023reffe
3 2708
. . (R=0.9994);
LWC=0 0039reffe 3 3955
. . (R=0.9981); and
LWC=0 0076reffe 3 7604
. .
R = 0,9952, respectivelly.
0 1 2 3 4 5 6 7 8
0 10 20
Effective Radius (um)
L iq u id w a te r c o n te n t (g /m 3) r^3 Non linear Fitted (r^3) 0 1 2 3 4 5 6 7 8 9 10
0 10 20
Effective radius (um)
L iq u id w at er co nt ent (g/ m 3 ) r^3 Non linear Fitted (r^3) 0 2 4 6 8 10 12 14
0 5 10 15 20
Effective radius (um)
L iq u id w a te r c o n te n t (g /m 3 ) r^3 Non linear Fitted (r^3) 0 2 4 6 8 10 12 14 16 18 20
0 5 10 15 20
Effective radius (um)
Li qui d w a te r c onte nt (g/ m 3) r^3 Non linear Fitted (r^3)
observations, while lines represent the values obtained from the parcel model.
Figure 6 – comparison between the modal radius and reffe for four situation simulated by the parcel model (a) Blue ocean; (b) Green Ocean; (c) Transition, and (d) Polluted.
0 2 4 6 8 10 12 14
0 5 10 15 20 25
Effective radius (um)
Modal
radius
(um)
0 2 4 6 8 10 12
0 5 10 15 20 25
Effective radius (um)
Modal
radius
(um)
0 1 2 3 4 5 6 7 8 9 10
0 5 10 15 20 25
Effective radius (um)
Modal
radius
(m)
0 1 2 3 4 5 6 7 8
0 5 10 15 20 25
Effective radius (um)
Modal
radius
(um)
0 1 2 3 4 5 6 7 8
0 10 20
Effective Radius (um)
Liquid
water
content
(g/m
3 )
Modeled tgh(r^2/3)
Figure 7 – parameterization of LWC as a function of reffe (see text for
more details).
Figure 8 – Comparison of modeled and observed effective radius as
a function of the cloud depth. Points represent observations, while lines represent modeled values and the parameterization proposed in equation (1). Also is indicated the modeled mean droplet concentration. The thg(r2/3) line was obtained for a droplet concentration of 2000 cm-3,
which is close to the observed values for the polluted environment.
0 1000 2000 3000 4000 5000 6000 7000
0 5 10 15
Effective Radius (um)
Cloud
depth
(m)
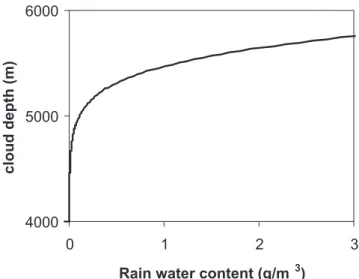
freezing level the droplets grew only to about two third the threshold for warm rain initiation. It is probable that, in some special cases, the ice-phase processes still have not started. This is illustrated in Fig. 9, which shows the values of rain water content plotted against cloud depth for a simulation performed for a polluted environment with a vertical velocity of 4m/s. As we can see, the appearance of rain occurs right below the 5 km cloud depth level.
4000 5000 6000
0 1 2 3
Rain water content (g/m3)
cloud
depth
(m)
Figure 9 – Rain water content against cloud depth for a polluted
situation. Vertical velocity is 4 m/s and mean drop concentration is 2950 cm-3.
7. CONCLUSIONS
This work presented results form a parcel model with detailed treatment of the liquid phase microphysical process, focusing on changes in the precipitation initiation over the Amazon due to the presence of aerosols generated by forest burning.
Comparing results from 3 sets of simulations showed that the environment humidity can play a signifi cant role in changing the process of rain initiation. It was shown that a mere 10 % change in the relative humidity may change the warm rain height by as much as 1 km, for concentration greater that 1000 cm-3. This can be a crucial factor to determine either a population of clouds (namely, the ones with tops not too above much the 0° C isotherm) will be able to produce precipitation or not.
When low velocities are imposed to the vertical ascent, low supersaturations are reached inside clouds. This implies that a small fraction of the CCN, corresponding to the largest nuclei in the spectrum, can be activated. As higher vertical velocities are imposed to the parcel, the higher is the fraction activated. This leads to higher droplet concentration, which, in fact, leads to the suppression of warm rain formation.
Finally, parameterization of the liquid water content as a function of of reffe has shown that under very special condition (namely, high relative humidity and low ascending rates) even the most polluted environments can still produce warm rain.
8. REFERENCES
ALMEIDA, G.P., A.A. COSTA, K.C. MENDES, A.J.C. SAMPAIO: Detailed microphysics in a two dimensional cloud model. Preprints of the AMS Conference on Cloud Physics, Everett, Washington, USA, pp. 91 – 94, 1998. ALMEIDA, G.P.: Microfísica explicita para um modelo de
nuvem quente convectiva. Msc. Thesis, 137 pp, Bib. Set. Física, UFC, 1997.
ANDREAE, M. O., D. ROSENFELD, P. ARTAXO, A.A. COSTA, G.P. FRANK, K.M. LONGO, AND M.A.F. SILVA-DIAS: smoking rain clouds over the Amazon. Science, 303, 1337 – 1342, 2004.
BEARD, K. V., AND H. T. OCHS III: Warm-Rain Initiation: a overview of micro-physical mechanism. J. Appl. Meteor., 32, 608-625, 1993.
COSTA A. A., G. P. ALMEIDA E A. J. C. SAMPAIO: A bin microphysics cloud model with high order, positive defi nite advection. Atmospheric Research, 55, 225 - 255, 2000. FREUD, E., D. ROSENFELD, M.O. ANDREAE, A.A. COSTA,
and P. ARTAXO: Robust relation between CCN and the vertical evolution of cloud drop size distribution in deep convective clouds. Atmos. Chem. Phys. Discuss., 5, 10155 – 10195, 2005.
GERBER, H.: Microphysics of marine stratocumulus clouds with two drizzle modes. J. Atmos. Sci. , 52, 1649 – 1662, 1996.
KAMRA, A.K., R. V. BHALWANKAR, A. B. SATHE: Spontaneous breakup of charged and uncharged water drops freely suspended in a wind tunnel. J. Geophys. Res., 96, 17159 – 17168, 1991.
LOW, T. B. and R. LIST: Collision, coalescence, and breakup of raindrops: Part I. Experimentally established coalescence effi ciencies and fragment size distribution in breakup. J. Atmos. Sci. 39, 1591 – 1606, 1982a.
LOW, T. B. and R. LIST: Collision, coalescence, and breakup of raindrops: Part I. Parameterization of fragment size distribution. J. Atmos. Sci. 39, 1607 – 1618, 1982b. MORDY, W., Computation of the growth by condensation
of a population of cloud droplets. Tellus 11, 16 – 44, 1959.
ROBERTS, G.C., M.O. ANDREAE, J. ZHOU, P. ARTAXO: Cloud condensation nuclei in the Amazon Basin: “Marine” condition over a continent?. G. Res. Let., 28,14, 2807 – 2810.
ROSENFELD, D. and G. GUTMAN.. Retrieving microphysical properties near the tops of potential rain clouds by multispectral analysis of AVHRR data. Atmos. Res., 34 :259-283, 1994.