Overcoming the Schlieren Effect in Flow Injection
Spectrophotometry by Introduction of Large Sample Volumes.
Determination of Chloride in the Electrolyte of Lead-acid Batteries
Fábio R.P. Rocha*, and Joaquim A. Nóbrega
Departamento de Química, Universidade Federal de São Carlos, C.P. 676,
13565-905 São Carlos - SP, Brazil
Received: September 25, 1996
Um sistema de análise por injeção em fluxo com detecção espectrofotométrica é proposto para determinação de cloreto em eletrólito de bateria chumbo-ácido, utilizando a reação com tiocianato de mercúrio(II) em meio contendo ferro(III). A formação de gradientes de índice de refração no centro da zona de amostra foi evitada utilizando um elevado volume de amostra. Interferência devida a sulfato foi investigada e a correlação entre os equilíbrios químicos envolvidos e os sinais transientes gerados foi utilizada para desenvolver uma estratégia para a quantificação de cloreto. Amostras contendo de 2,2 a 3,7 mol L-1 de ácido sulfúrico podem ser determinadas utilizando a mesma curva analítica, sem efeitos matriciais ou qualquer tratamento prévio. O limite de detecção e o desvio padrão relativo das medidas foram estimados em 0,37amg Cl- L-1 (nível de confiança de 99,7 %) e 1,6%a(n = 10), respectivamente. A frequência de amostragem foi 45 h-1. Porcentagens de recu-peração entre 95,9 e 108% foram obtidas para adições de cloreto (2,00 a 8,00 mg L-1) nas amostras.
A flow injection spectrophotometric system is proposed for determining chloride in lead-acid battery electrolyte by using the displacement reaction between mercury(II) thiocyanate and chloride in a medium containing iron(III). The employment of a large sample volume was effective to avoid refractive index gradients in the central part of the sample zone. Sulfate interference was studied and the correlation between the chemical equilibria involved and the transient signals was used to develop a strategy for chloride quantification. Samples containing from 2.2 to 3.7 mol L-1 of sulfuric acid can be determined by using the same analytical curve, without matrix interference or any previous treatment. The detection limit and the relative standard deviation were estimated in 0.37amg Cl- L-1 (99.7% confidence level) and 1.6% (n = 10), respectively. The sampling rate was 45 h-1. Recoveries between 95.9 and 108% were obtained for additions of chloride (2.00 to 8.00 mg L-1) in the samples.
Keywords: flow injection spectrophotometry, lead-acid batteries, chloride, refractive index effect
Introduction
Flow injection analysis (FIA) is characterized by the formation of concentration gradients, caused by the disper-sion of the sample in the carrier stream. When sample matrices contain high concentrations of concomitants, in-tense refractive index gradients can be established in the sample zone. This is called the Schlieren effect and can affect the measurements of transient signals in flow injec-tion spectrophotometry1,2. The usual way to overcome this
perturbation is to employ a carrier with physical and chemi-cal characteristics as similar as possible to the samples. In some situations this is not a practical alternative and some experimental procedures need to be used to avoid or to correct for the Schlieren effect2. The use of flow diagrams
with high dispersion is the simplest alternative to avoid refractive index gradients, since in these systems the mix-ture between sample zone and carrier is improved3. How-ever, sensitivity is negatively affected by the flow
Article
conditions adopted. An instrumental method for Schlieren compensation based on measurements at two wavelengths was proposed by Zagatto et al.1. In this procedure, meas-urements must be equally affected by the Schlieren effect at both wavelengths and the molecular absorption process must occur only for one of them. More recently, Yamane and Saito4 employed a flow diagram with injection of a
large sample volume. Thus, the central part of the sample zone does not interact with the carrier and measurements can be made without perturbation. This is an ingenious way to overcome the Schlieren effect when there is no limitation in available sample volume and the sampling frequency is not a critical aspect. The employment of a large sample volume causes an additional advantage by improving sen-sitivity due to the lower dispersion.
Lead-acid batteries are inexpensive devices used to produce electrical energy from chemicals and are fre-quently employed to start engines, in communication de-vices and emergency power. In the 80’s lead-acid batteries represented approximately 60% of the sales of all batteries in the world5. The analysis of the sulfuric acid electrolyte
in this device is relevant because some constituents affect severely performance and lifetime. In this sense, chloride determination is important since this anion increases the sulfation rate and consequently reduces the lifetime. In addition, hydrochloric acid attacks both the sponge lead of the negative plate and the lead dioxide of the positive plate6.
Chloride concentrations in of lead-acid battery electrolyte should be lower than 4 mg L-1 to avoid these troubles7.
From an analytical point of view, this determination is not an easy task due to the high acidity of the medium that varies from 1.3 to 5.8 mol L-1 of sulfuric acid depending on
the application and charge state of the device5. Procedures
proposed to determine chloride in these samples are not satisfactory due to the lack of precision and accuracy. Frequently, they are only used for semi-quantitative esti-mation8. In flow injection spectrophotometric systems the
problem is further complicated due to the intense refractive index gradient that can be generated when this sample is injected in the carrier.
The majority of the flow injection procedures that have been proposed in the literature are related to the determina-tion of chloride in waters, involving displacement spectro-photometric procedures9 and these cannot be easily adapted
for high acidity samples. Lundell10 has previously
men-tioned, earlier in this century, that “there is no dearth of methods that are entirely satisfactory for the determination of elements when they occur alone”, and it could be said that in the nineties there is no lack of methods for determin-ing elements in water, but thdetermin-ings change completely with respect to complex matrixes. Of course, procedures that have been developed for water analysis are useful. How-ever, as efficient strategies for solution management, such as flow injection, are well established for less complex
samples it is required that they also be applied to analytes in more aggressive medium.
For determining chloride, a flow injection procedure based on a displacement reaction with mercury(II) thiocy-anate in a medium containing iron(III) was used. This reaction was previously adapted for flow injection spectro-photometric determination of chloride in waters11-13, blood serum14, ethanol15, plating baths16 and milk17. However,
these procedures cannot be directly applied for chloride determination in lead-acid battery electrolyte due to the occurrence of the Schlieren effect, which depends on the flow diagram used, and the influence of sulfate on complex formation equilibria. To solve the former problem, a system with a large sample injection volume was investigated. The latter effect was not carefully evaluated in previous studies and it was focused by taking into account sulfate influence on complex formation equilibria.
Experimental
Apparatus
A peristaltic pump (Ismatec IPC-8) and Tygon tubes (Technicon) were used for fluid propulsion. Polyethylene tubing (0.8 mm i.d.) was used to set up the flow diagram. The absorbance was measured with a 432 Femto (São Paulo, Brazil) spectrophotometer equipped with a flow cell with 8.6 mm optical path (200 µL). A potentiometer re-corder (Cole-Parmer) was used to register the transient signals. For injecting samples, a sliding bar commutator was used18.
Reagents and solutions
All solutions were prepared with distilled and deionized water, using analytical grade reagents. Sodium chloride was dried at 110 °C for 2 h and used to prepare a stock chloride solution, 1000 mg L-1. Working standard solutions containing 0, 2.0, 4.0, 6.0, 8.0 and 10.0 mg Cl- L-1 were prepared in a medium containing 2.2 or 3.7 mol L-1 H2SO4.
Sulfuric acid solutions: 1.0, 2.0, 3.0, 4.0, and 4.5 mol L-1 were prepared containing 2.0, 4.0, and 8.0 mg Cl- L-1. Chloride solutions of the same concentrations were also prepared without acid.
Chromogenic reagent was prepared containing 0.135% (m/v) Hg(SCN)2, 3% (m/v) Fe(NO3)3.9H2O, 0.2 mol L-1
HNO3, and 15% (v/v) ethanol. Distilled and deionized
water was used as carrier in the flow system, except when the sulfuric acid effect on the absorbance signal was inves-tigated. In this case, an acid solution with the same concen-tration as the reference solution was employed as carrier. Battery electrolyte samples were processed without any additional treatment.
Flow diagram and procedure
The schematic flow diagram used to investigate sulfuric acid influence on complex formation equilibria and to determine chloride in batterie electrolytes is shown in Fig. 1. The sample volumes used were 0.5 and 2.0 mL, respec-tively. In the former case, a sulfuric acid solution of similar concentration was employed as carrier with samples. In the later, water was used as carrier. To investigate the effect of the sample volume on the signal pattern, the flow diagram (Fig. 1) was employed with sample volumes that varied from 0.025 to 3.0 mL.
The sample was injected by sliding the central part of the commutator and the chromogenic reagent was intro-duced by confluence. Absorbance measurements were made at 480 nm.
Results and Discussion
As mentioned above, the usual way to circumvent the Schlieren effect in flow injection systems is to use samples and carrier with same matrix characteristics. However, if the samples present different media or very aggressive media the matrix matching strategy cannot be easily em-ployed. Both problems are found with battery electrolyte samples, since the concentration varies depending on the application and the charge state of the device5.
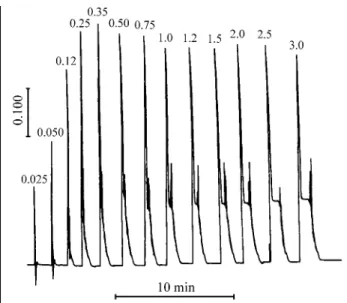
The use of water as carrier for electrolyte samples causes the Schlieren effect in flow systems with limited or medium dispersion. A practical alternative to solve this problem is the injection of a large sample volume to avoid intense gradients in the center of the sample zone. Thus, measurements of the transient signals could be done in this region without perturbation of measurements due to the Schlieren effect. In this sense, the sample volume was varied to attain a condition in which the Schlieren effect at the front and tail portions of the sample zone do not affect the measurements in the central part of the sample zone. The results obtained are shown in Fig. 2. A minimum sample volume of 1.2 mL is necessary to permit the sepa-ration of the portions affected by the Schlieren effect. When
the sample volume is greater, a plateau can be observed in the central part of the transient signals and this point can be employed for analyte quantification. To assure that meas-urements would not be affected by refractive index gradi-ents, a 2 mL sample volume was used. Although this volume is greater than that frequently employed in flow systems, this is not a critical aspect due to the availability of the electrolyte samples.
Transient signals of solutions containing different chlo-ride concentrations were obtained by using the flow system shown in Fig. 1 and a sample volume of 2 mL. By observing the results (Fig. 3), it can be seen that negative signals were
Figure 1. Flow diagram used to determine chloride in battery electrolyte samples. L = sampling loop. Sa=asample or reference solution; R = chromogenic reagent; W = waste. Ca=acarrier (sulfuric acid solution or water). Numbers between brackets indicate flow rates in mL min-1. For details see text.
Figure 2. Effect of sample volume on the transient signal shape to a solution containing 8 mg L-1 chloride in 3.7 mol L-1 sulfuric acid. Numbers indicate the sample volume (mL) injected into the carrier.
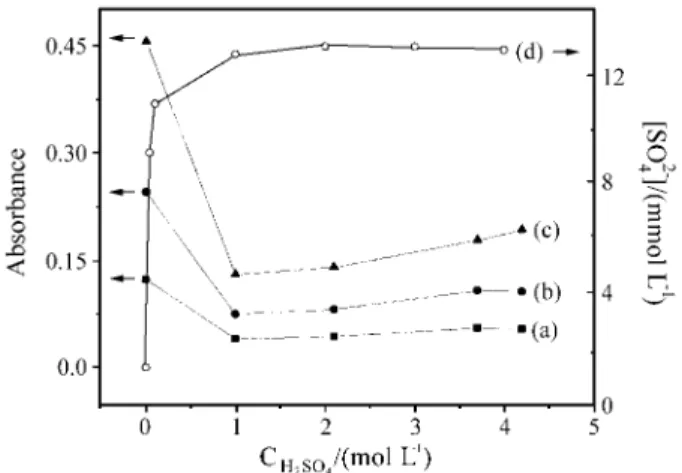
obtained for some chloride concentrations. Despite its un-usual pattern, the reproduceability was good and the effect of chloride concentration was noted. In order to understand these results, some experiments were made to evaluate the effect of sulfuric acid on absorbance. As previously de-scribed, these experiments were conducted by using sam-ples and carrier with same acidity. The results obtained are shown in Fig. 4 (a-c). Comparing signals obtained in water with those obtained in 1.0 mol L-1 H
2SO4 a strong negative
interference can be observed. However, for higher concen-trations of sulfuric acid the absorbance is practically con-stant. At this point, it was not clear if the effect on absorbance was caused by acidity or by sulfate concentra-tion. In a previous work19, it was observed that nitric and
perchloric acids produced a slight effect on the displace-ment reaction with mercury(II) thiocyanate and formation of iron(III)-thiocyanate complex. However, sulfuric acid caused a pronounced effect. These results can be explained by considering that the sulfate anion was the interfering species. This hypothesis can be confirmed by observing the variation of equilibrium sulfate concentration in sulfuric acid media (Fig. 4d). It can be seen that the variation of absorbance is closely related to the variation of sulfate concentration. While the equilibrium sulfate concentration increases (until about 1.0 mol L-1 sulfuric acid), the
absor-bance signal decreases. For higher concentrations of sulfu-ric acid the absorbance change is less because the sulfate equilibrium concentration is constant.
The negative signals observed (Fig. 3) can be explained taking into account the chemical equilibria involved in formation of thiocyanate complexes of iron(III). The indi-rect spectrophotometric method for chloride determination involves the displacement of thiocyanate from mercury(II) thiocyanate and the complexation of iron(III) by the dis-placed anion. The chromogenic reagent contains iron(III) and mercury(II) thiocyanate. Thus, the iron(III) thiocy-anate complexes are formed due to the equilibria estab-lished. In a medium containing high concentrations of sulfate an interferencewill occur as this anion is a stronger complexant than thiocyanate for iron(III):
[Fe(SCN)]2+ + 2 SO42- [Fe(SO4)2]- + SCN
K = 2.35 x 10⁴
The baseline absorbance is determined by the concen-tration of the iron thiocyanate complex that results when the chromogenic reagent is mixed with the aqueous carrier. The dispersion of the sulfuric acid solution injected into the carrier produces concentration gradients of sulfate in the sample zone. In the absence of chloride the baseline absor-bance is decreased because the sulfate present in the sample zone reduces the concentration of the iron thiocyanate complex. In the presence of chloride, the previous process occurs simultaneously to the displacement of thiocyanate
from mercury(II) thiocyanate by chloride and causes an increase in the blank absorbance, i.e. the absorbance signal obtained in absence of analyte. Depending on the chloride and sulfate concentrations, a negative or a positive signal will be observed and chloride can be quantified by meas-uring the difference between signal plateaus in the absence and in the presence of chloride. All signal interpretations are based on the formation of the first complex between iron(III) and thiocyanate. Other complexes were not con-sidered because under the experimental conditions adopted iron(III) was present in large excess in comparison with the complexing anion.
Adopting this strategy for signal treatment, analytical curves obtained for samples containing 2.2 or 3.7 mol L
-1 H
2SO4 presented slopes of 0.0233 and 0.0238 and
correlation coefficients of 0.9998 and 0.9996, res-pectively. The slope ratio, practically equal to unity, is an indication that chloride could be determined in sam-ples with different acidity by using only one analytical curve. A unity slope ratio was also obtained with curves generated from spiked samples or from standard solu-tions prepared in sulfuric acid by dilution of an analytical grade reagent. Data obtained from addition-recovery experiments are shown in Table 1. Recoveries varied from 95.9 to 108% and this indicates that matrix effects are not significant on the determination of chloride in battery electrolyte. A better evaluation of accuracy was not possible because standard reference materials or standard reference methods were not available. The rela-tive standard deviation was 1.6% (n = 10) for a 3.7 mol L-1aH2SO4 solution containing 8amgaCl- L-1. The
detec-tion limit was estimated as 0.37amg L-1 and the sensiti-vity is adequate for the determination of chloride in lead-acid battery electrolyte, here up to 4amg L-1 is tolerable7. The sampling rate was 45 h-1 and 2 mL of sample was consumed in each determination.
The main feature of the proposed procedure is the flow injection chloride determination in relatively concentrated sulfuric acid without any preliminary sample preparation and without perturbations from the Schlieren effect on signal measurements.
Acknowledgments
F.R.P.R. is grateful to CAPES (Coordenadoria de Aper-feiçoamento de Pessoal de Nível Superior) for a fellowship. The grant furnished by CNPq (Conselho Nacional de De-senvolvimento Científico e Tecnológico) to J.A.N. is thanked. The authors are also grateful for the partial support from FAPESP (Fundação de Amparo à Pesquisa do Estado de São Paulo) and to P.V. Oliveira for critical comments. M.F.N.C. Rosolem (Telebrás-Brazil) is thanked for supply-ing the samples.
References
1. Zagatto, E.A.G.; Arruda, M.A.Z.; Jacintho, A.O.; Mattos, I.L. Anal. Chim. Acta 1990, 234, 153.
2. Rocha, F.R.P.; Nóbrega, J.A. Química Nova1996, 19, 636.
3. Zagatto, E.A.G.; Reis, B.F.; Martinelli, M.; Krug, F.J.; Bergamin Fo, H.; Giné, M.F. Anal. Chim. Acta1987,
198, 153.
4. Yamane, T.; Saito, M. Talanta1992, 39, 215. 5. Linden, D. In Handbook of Batteries and Fuel Cells;
McGraw-Hill, New York, 1984.
6. Vinal, G.W. Storage Batteries; Wiley; New York, 4th Ed., 1955, p. 131.
7. Telebrás-Brazil. Regulatory Standards for sulfuric acid electrolyte of lead-acid batteries, 1988.
8. Rosolem, M.F.N.C. Personal communication; Centro de Pesquisa e Desenvolvimento, Telebrás, Campinas, 1992.
9. Chen, D.; Luque de Castro, M. D.; Valcárcel, M.
Analyst1991, 116, 1095.
10. Lundell, G.E.F. Ind. Eng. Chem. Anal. Ed. 1933, 5, 221.
11. Ruzicka, J.; Stewart, J.W.B.; Zagatto, E.A.G. Anal. Chim. Acta1976, 81, 387.
12. Slanina, J.; Bakker, F.; Bruyn-Hes, A.; Möls, J.J. Anal. Chim. Acta1980, 113, 331.
13. Van Staden, J.F. Frezenius Z. Anal. Chem.1985, 322, 36.
14. Hansen, E.H.; Ruzicka, J. Anal. Chim. Acta1976, 87, 353.
15. Krug, F.J.; Pessenda, L.C.R.; Zagatto, E.A.G.; Jacin-tho, A.O.; Reis, B.F. Anal. Chim. Acta1981, 130, 409. 16. Whitman, D.A.; Christian, G.D.; Ruzicka, J. Analyst
1988, 113, 1821.
17. Herrero, M.A.; Atienza, J.; Maquieira, A.; Puchades, R. Analyst1992, 117, 1019.
18. Krug, F.J.; Bergamin Fo, H.; Zagatto, E.A.G. Anal. Chim. Acta1986, 179, 103.
19. Florence, T.M. Anal. Chim. Acta1971, 54, 373.
FAPESP helped in meeting the publication costs of this article
Table 1. Addition-recovery of chloride in lead-acid battery electrolyte.
Chloride / (mg L-1)
Sample Added Found Recovery (%)
1 2.00 2.02 101
2 4.00 3.84 95.9
3 5.00 5.35 107
4 6.00 6.12 102
5 2.00
4.00 6.00
1.98 3.92 6.00
99.1 98.1 100
6 2.00
4.00 6.00
2.00 4.04 6.29
100 101 105
7 2.00
6.00
2.10 6.47