SCAVENGING PROCESSES OF ATMOSPHERIC PARTICULATE MATTER: A NUMERICAL
MODELING OF CASE STUDIES
FÁBIO LUIZ TEIXEIRA GONÇALVES,
1; KLAUS DIETER BEHENG
2, OSWALDO MASSAMBANI
1,
WOLFGANG VAUTZ, DIETER KLOCKOW
31
Depto. de Ciências Atmosféricas, Instituto de Astronomia, Geofísica e de Ciências Atmosféricas,
Universidade de São Paulo (IAG/USP), SP, Brasil
2
Institut für Meteorologiie und Klimaforschung-Karlsruhe, Germany
3Institut für Spektroskopie und Angewandte Spektrochemie, Dortmund, Germany
[email protected], klaus [email protected], [email protected]
Received March 2008 - Accepted March 2010
ABSTRACT:
Below cloud scavenging processes have been investigated considering a numerical simulation, local atmospheric conditions and particulate matter (PM) concentrations, at different sites in Germany. The below cloud scavenging model has been coupled with bulk particulate matter counter TSI (Trust Portacounter dataset, consisting of the variability prediction of the particulate air concentrations during chosen rain events. The TSI samples and meteorological parameters were obtained during three winter Campaigns: at Deuselbach, March 1994, consisting in three different events; Sylt, April 1994 and; Freiburg, March 1995. The results show a good agreement between modeled and observed air concentrations, emphasizing the quality of the conceptual model used in the below cloud scavenging numerical modeling. The results between modeled and observed data have also presented high square Pearson coeficient correlations over 0.7 and signiicant, except the Freiburg Campaign event. The differences between numerical simulations and observed dataset are explained by the wind direction changes and, perhaps, the absence of advection mass terms inside the modeling. These results validate previous works based on the same conceptual model.
Keywords: scavenging processes, particulate matter, numerical modeling
RESUMO: PROCESSOS DE REMOÇÃO DE MATERIAL PARTICULADO ATMOSFÉRICO: UMA MODELAGEM NUMÉRICA DE ESTUDO DE CASOS
Os processos de remoção atmosféricos foram investigados em simulação numérica, levando-se em conta as condições atmosféricas locais e a concentração de matéria particulada (MP) em diferentes lugares na Alemanha. Um modelo de remoção foi desenvolvido com intuito de predizer a variabilidade da concentração no ar da matéria particulada observada por um contador de partículas totais TSI, durante eventos de precipitação. As amostras de TSI, bem como os dados meteorológicos, foram coletadas em três Campanhas em Deuselbach, em três diferentes eventos; Sylt e Freiburg, respectivamente durante os meses de março de 1994, abril de 1994 e março de 1995. Os resultados mostram boa concordância entre os dados modelados e observados, com altos coeicientes de correlação quadráticos acima de 0.70, dentro da signiicância, exceto na Campanha de Freiburg. As diferenças apresentadas são devidas a alterações signiicativas da direção do vento e, talvez, devido à ausência de advecção de massa dentro do modelo. Estes resultados auxiliam a validação de trabalhos prévios baseados no mesmo modelo conceitual.
1. INTRODUCTION
Wet removal of particulate matter by rainfall should have an important role in the aerosol concentration of a pollutant atmosphere. The comprehension of the cleaning the atmosphere, with consequently impact on the ecosystems, human health and pollution transport are rather than obvious. There are two mechanisms: the incorporation to the droplets inside of cloud scavenging, denominated in cloud, and to the raindrops scavenging, denominated below cloud. The present paper had been investigated this second one, i.e., the below cloud process. We also consider the bulk particulate matter (PM), as the scavenged pollutant, within the aerosol range denomination; therefore, PM is a synonymous of aerosol herein.
The below cloud mechanism could be parametrized in a below cloud model taking in account the raindrop collision, in which includes many individual processes, as Brownian diffusion, interception and inertial impaction. The scavenging model presented in this work has been initially developed by Herbert and Beheng (1987) as a numerical model including the collision eficiency. The present work also considers the collision eficiency developed by Seinfeld and Pandis (1998), Volken (1994) and Pruppacher and Klett (1997).
Many authors have also been discussed the aerosol scavenging by raindrops with theoretical basis studies and laboratory tests, since Hampl et al. (1971) and Wang and Pruppacher (1978). Oberholzer et al. (1993) compared in ield campaigns during winter samples from soil in different levels taking in account the gas ammonia (NH3 ) and the particulate ammonium, NH4+, in the scavenging processes. Stähelin et al. (1993) has been worked on the same topic, entailed to that Campaigns, inside of the Project entitled “Winter precipitation at Mount Rigi”, or WaBoLu (Wasser, Boden und Luft, meaning “water, soil and air” in German language) for the Mt. Rigi region, central Switzerland. Volken (1994) modeled the scavenging processes of the same particulate NH4+ and gas NH3, inside this Project.
Leaitch and Isaac (1994) related the sulphate concentration to cloud drop, inding out relations between CCN (Cloud Condensation Nuclei) and cloud droplets development. Cautenet and Leveifre (1994) studied a 2-D convective cloud coupled with a chemical model in order to predict 5 chemical species through aerosol and gas scavenging processes at African Equatorial forest. The main results have shown a reduction of aerosol scavenging eficiency with increasing the rain intensity, a strong impact of the vertical atmospheric trace elements on ground rain concentration, a difference in scavenging eficiencies according to the origin of the elements (gas or aerosol) and a depletion of air concentrations during rainfall.
Bergin et al. (1996) modeled the scavenging processes of gases and PM, such as, sulphur dioxide (SO2), nitric dioxide
(NO2) and nitric acid (HNO3), for radiative fog clouds,
comparing to experimental measurements. These studies take in account to the particle size spectra, among other parameters.
More recently, Orb (1998) applied CLARK/DESCAM model in order to evaluate the concentration of ammonium (NH4+), through an orographic cloud scavenging processes and
compared to observe data set, obtaining quite reasonable results. Flossmann (1998) has been studied the interaction between cloud and aerosol scavenging taking in account the colisional eficiencies. Recently as well, Kasper-Girbl et al. (2000) have been calculated the scavenging eficiency of aerosol carbon and sulphate at Mt. Sonnblick, Austria.
Most of the recent works deal with in cloud scavenging processes where nucleation and impaction have greater importance such as Caro et al. (2004). Those authors treated the modeling with those in cloud processes, inside the warm cloud in a bidimensional model.
Gonçalves et al. (2000, 2002 and 2007) and Silva et al. (2008), studying the below cloud scavenging processes at Serra do Mar and Amazonia region, both in Brazil, denoted signiicant aerosol scavenging transference to the rainwater. These studies present a scavenging process based on a conceptual model without comparison and validation with disdrometric dataset. Disdrometric data would improve the numerical modeling, based on fact they display a detailed and real raindrop distribution rather than gamma functions which are normally and previously used.
Consequently, the aim of this study is to validate a conceptual model, below cloud base, in order to simulate the scavenging processes of bulk particulate matter (PM), and compared to the ield Campaigns measurements using disdrometric data. Therefore, it deals with observational and modeling analysis, comparing both in order to inspect the nature of the scaveging processes of PM by detailed raindrop spectra in which affects directly the reservoirs exchanges inside of ecosystems.
2. DATA AND METHODOLOGY
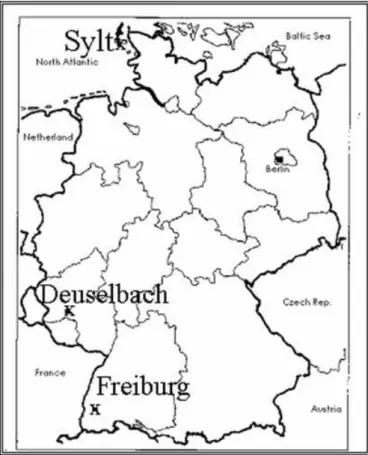
2.1 Experimental Sites
located inner Southwest Germany, in a rural region surronding by soft hills, no more than 200 m high. Three rainfall events took place, during this Campaign, which were herein evaluated. Freiburg is the most extreme Southwest city in Germany (over 10,000 habitants). It presents a rather continental climate, as Deuselbach, both different of maritime climate of Sylt. The Freiburg site is located in the suburbs of Freiburg, at Rhine valley, surrounded by Vosges (France) and Black Forest (Germany) Mountains, both over 1,000 m high.
2.2 Physical description of scavenging of particulate matter (PM)
The mathematical description comprising particle collection, as a drop falls through the polluted air it could collide with aerosol particles and collecting them. We denote the diameter of the falling drop by Dg and the aerosol particle diameter by Dp (in this case, PM) collected by the irst ones. We also denominate vt( Dp) and Vt(Dg) as particle terminal fall velocity and raindrop fall velocity, respectively. The volume swept out by the falling drop in time dt is (p/4)( Dp+Dg)2/
(Vt(Dg)-vt( Dp))/dt. The number of particles with diameter
Dp collected in time dt is the product the volume described and the total number of particles n(Dg) dDg in the diameters interval [Dg, Dg + dDg ]. This product should give us the number of particles of diameter Dp collected in time dt if the trajectories of the particles do not depend on the airlow patterns around the falling raindrop. With those considerations in mind, we introduce an empirical function of collision eficiency, E(Dp,Dg), describing just a fraction of particles, Dp, that are contained within the collision volume of the raindrop, Dg, which will be collected, leading us to the following equation;
where N(Dg) is the raindrop size distribution, Vt (Dg) and vt( Dp) are the terminal velocities of the raindrop and particle respectively and Lp (Dg) is scavenging coeficient.in s-1.
The integration of (1) is the particle scavenging coefficient Lp (Dg), which results with the following approximations: Vt (Dg) >> vt( Dp) and (Dg+ Dp)2 / Dg2 and thus the Equation 1 can be rewritten:
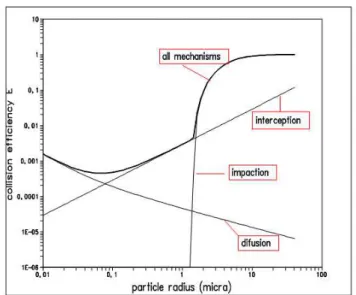
The raindrop size distribution N(Dg) is not usually known, except when there is a disdrometer dataset. N(Dg) also can be measured by a function of the rainfall rate, R0, obtained by disdrometer data or functions based on the drop size. According to Pruppacher and Klett (1997), Seinfeld (1998) and Volken (1994), the main forces involving the calculus of the collision eficiency is: Brownian diffusion, interception and impaction, described as it follows;
• Brownian diffusion.
The value of the collision eficiency of the Brownian (Ebrow) diffusion could be approximated by:
where Re is Reynolds number and Sc is the Schmidt number.
• Interception.
We can approximate the interception effect (Einter) by: (1)
2
0
( ) ( ) ( )
( ) 4
( , ) ( )
g p t g t p
p
g p g g
D D V D v D
D
E D D N D dD
p
∞ + −
L =
∫
(2)2 0
( ) ( ) ( , ) ( )
4
p g t g g p g g
D ∞
p
D V D E D D N D dDL =
∫
1/ 2 1/3 1/ 2 1/3 8
(1 0.29 Re 0.11Re )
Re
brow
E Sc Sc
Sc
= + +
(3)
where the ratio
p g
D
D
=
c
•Inertial Impaction.
The inertial impaction effect (Eimpac), is approximated
by the following equation, valid up to 2 mm of particle diameter:
with c as deined above, and
,
and
z
=
ln
St
−
ln
St
cri withSt
cri=
exp
(
−
0 1007 0 358
.
−
.
ln Re
+
0 0261
.
Re )
2where Re is Reynolds number, St is the Stokes number, in that case, Volken (1994) deines Stokes number as:
St =
where Vt, Dg were deined above and μaris the air viscosity.
•
Superposition of the Main Mechanisms
The sum of the main mechanisms given by Volken (1994) is:
with Eeletro and E(termo+diffuso) are too small to be included in this work. Avoiding the double collection of the two main mechanisms, interception and impaction, it was used the following assumption at Equation 7: Eimpac+inter=Eimpac+Einter-Eimpac.Einter. Although the solution is still a linear solution, it is possible to work below 1 unit for the eficiency E. Figure 2 shows all mechanisms together.
2.3 The Modeling Description
According to Junge (1963), the basic equation for particulate matter (PM) concentrations during the rainfall event is expressed,
where Cp0 is the initial concentration particles in air, Cp1, the particle air concentration (particulate/dm3), at time t, and L(Dp) is the below cloud coeficient of particles (Equation 2) and t is the rainfall time.
i) Description of Input Parameters
• The geometric model structure was based in a non-dimensional closed box, between the cloud base and the ground, without advection mass and in cloud mechanism. In other words, once the model starts to run, there are no external changes;
• A uniform raindrop size distribution (DSD) above the ground and uniform rainfall rate was considered just the evaporation of the drops. No splitting, break-up events or other changes of the DSD during the event took place. Different DSD relations could express the DSD, without disdrometric data. The Disdrometric DSD, from RD-69, was divided in ifty classes of drop size, varying from 0.3 mm to 5.2 mm diameter. Therefore, the raindrop size spectra were function of disdrometric data collected;
• The particle size was characterised by a trilog-normal function, based on Whitby (1980) and Jaenicke and Davies (1976), as rural distribution, between 0.01 mm to 40 mm (radius), divided in to 73 class sizes. The distribution in mass and number were assumed constant on time with respect to particle diameter, i.e., hygroscopic growth was not considered;
(7)1 (1 )(1 int ) max( )
tot impac er brown
termo difuso eletro
E E E E
E E E
= − − − +
+ + +
1 0exp( )
p p p
C =C −L t
(8) (4)
E
inter=
3 /
c
(5)
0
2 3
2
( ) (0.1465 1.302
0.607 0.293 )
c
y arctg z
z z
p
= + − + 2 0 2 ( ) (1 ) c impac y Ec
c
+ = + (6) 2 ( ) 2 ; 18 p p t t p ar D V Dρ
τ
υ
τ
m
−=
Figure 2 - Collision eficiency versus particles size spectra, including
• Falling velocity of raindrops was based on Pruppacher and Klett (1997);
• Particle density was assumed equal to 1.0 g/cm3.
ii) The Input Data
It had been chosen to the numerical simulation some events during the Sylt, Deuselbach and Freiburg Campaigns (see Figure 1 and Table 1). The sampling and data analysis had the following characteristics:
• The Cloud Condensation Nuclei counter, a TSI Portacounter (TSI is the name of the enterprise meaning “Trust, Science, Innovation”), was generated the bulk particulate matter concentration, per cubic decimetre (or air litre), with 1 minute resolution, equal or greater than 1 micron of aerodynamic diameter. The chosen periods are presented in the Table 1, adding the initial
air concentration input data. The different input values of Deuselbach data is due to fact they belong to three different events;
• During some events, it had been considered smoothing the peaks presented in the observed air concentrations, probably due to many factors, such as vehicle trafic. The TSI counters were placed near of trafic roads. Therefore, it was generated a mean value of the air concentrations, and for the corresponding disdrometric and rainfall rates, for each ive minutes, attempting to eliminate the peaks in Figures 3 and 4, for instances. For Sylt station, the mean had been evaluated during each one hour, and for Freiburg, the smallest event, it had been smoothed by three minutes;
• Rainfall rates during the Campaign had been evaluated by the disdrometer RD-69, with the software developed by Disdromet Ltd.. The events were considered as such when the rainfall rate was over 0.01 mm.h-1, and constant during more than 2 minutes;
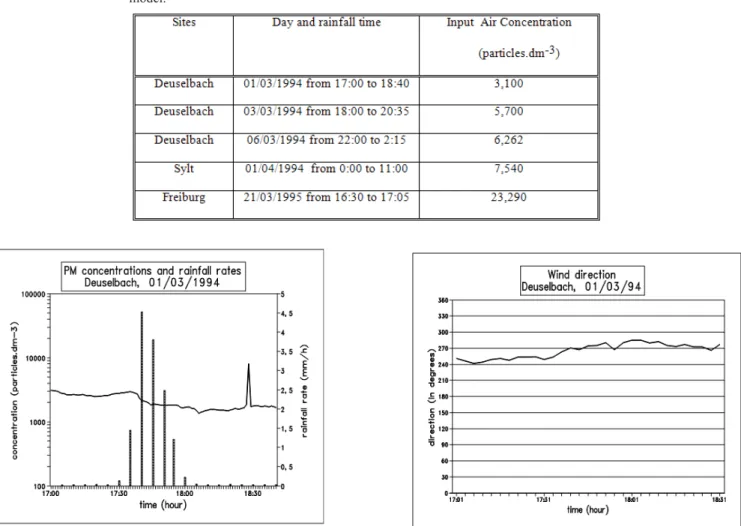
Table 1 - Sites, day, time and initial particulate matter concentration, as input in the model.
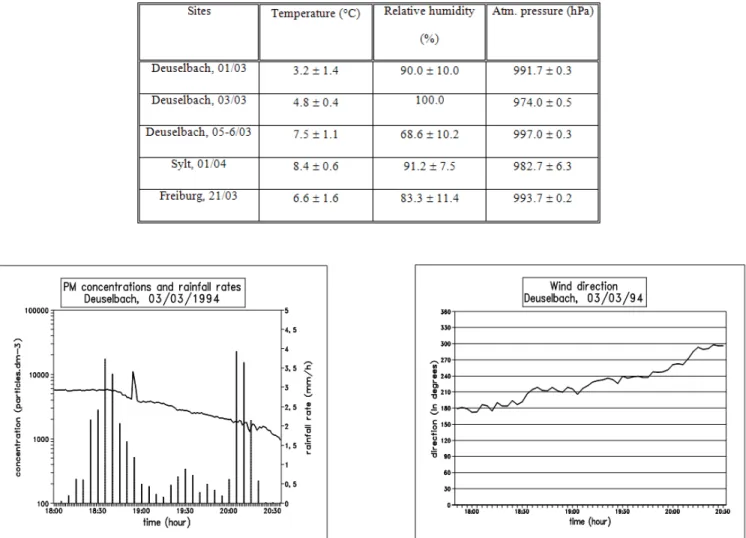
• Temperatures, relative humidity and atmospheric pressures had been measured and calculated their arithmetical means, obtained at the ground stations, during the respective rainfall event, in according to the Table 2. iii) Statistical Analysis
In order to compare modeled and observed data, Pearson correlation coeficient was used. The event sizes (time series) from Table 1 have 100, 155, 255, 660 and 35 data, respectively to the sites of Deuselbach (the three March events, by chronological order), Sylt and Freiburg. The data were performed by one minute each, but the statistical calculations were smoothed as described above. All statistical signiicances were considered with P<0.05, except the last event with P<0.1.
3. RESULTS
The Figures 3a to 7a illustrate total PM concentrations, particles number per dm3, with resolution of 1 minute, with the rainfall rate during the rainfall time period. The Figures 3b to 7b illustrate the wind directions of the same period. The numerical simulations are displayed in the Figures 8 to 12, which show both observed and modeled air PM concentrations.
i) The Results for March 1st at Deuselbach Are Depicted in Figures 3 and 8.
These Figures present a rainfall event along two hours, with slightly rainfall rate reaching 4.5 mm.h-1 at maximum (Figure 3). It also presents a decrease of observed PM concentration, probably due to the below cloud process.
Figure 4 - Particle matter concentration in air (as line and per dm3), collected at March 1st 1994, at Deuselbach, from 17:00 LT to 18:40, and the respective rainfall rates (Figure a as bars) and wind direction (Figure b) at the same period.
Figure 8 presents observed and modeled PM concentrations, in which both it reasonably during the irst 40 minutes of rainfall. The observed curve is normalized, i.e., the peaks are extracted. The same procedure for the other events was adopted. After this period, they started to be separated, showing a modeling underestimation. The irst explanation for this result could be a lightly mass advection through the box model which could be proved by wind direction change. The mass advection might bring another amount or different particulate matter concentrations, higher than expected by the modeling. The wind had been blown from the WSW (240°), at the beginning, during the irst 40 minutes of this rainfall event, softly
turning to the West, after 17:40 LT (see Figure 3b). At the matter of fact, this wind direction change could explain the difference between observed and modeled PM concentrations. However, it should be pointed out that those variations would not be suficient to support the modeled differences, due to the fact that that changing of wind direction was very soft. The nearest sources could play an important role as well, as for instances the vehicle trafic. Nevertheless, the modeling agreement has an excellent agreement showing the square correlation coeficient up to 0.91, even including the peak at 90 minutes of rainfall time. This peak is probably due to trafic crossing the study area, which is countryside (see at 18:30 in Figure 3a, typical for vehicle trafic).
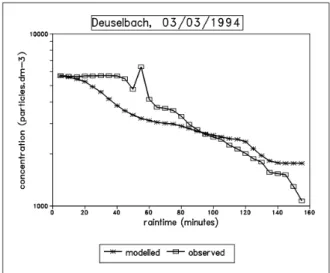
ii) The Results for March 3rd at Deuselbach Are Depicted in Figures 4 and 9.
This Figure 4 shows an event almost three hours long with rainfall rates less than 4 mm.h-1. Even though there was a signiicant decayment of particulate matter concentrations.
At the irst 40 minutes of rainfall time (Figure 4a), the observed PM concentrations have been maintained almost constant with a peak around 60 minutes, after that the PM concentrations decay. The modeled PM concentrations follow almost in parallel to the observed concentration, except by the last three values (Figure 9).
These possible differences could be again due to the advection mass absence, as it has been explained above. The wind direction (Figure 4b) altered softly and continuously during whole event, turning from the S (180°) to the WNW (300°). This variation should be enough to explain alone the particulate matter concentration decrease, in opposite of the result above (Deuselbach, March 1st), when the alteration had been too soft
Figure 5 - Particle matter concentration in air (as line and per dm3), collected at March 5-6th 1994, at Deuselbach, from 22:30 LT to 02:15, and the respective rainfall rates (Figure a as bars) and wind direction (Figure b) at the same period.
for such effect. Consequently, the square correlation coeficient also presents higher value up to 0.90, signiicant, although the regression analysis was evaluated without the initial value group (around initial twenty minutes) and without the three last points.
iii) The Results for March 5-6th at Deuselbach Are Depicted in Figures 5 and 10.
The Figures 5a and 5b present the third rain event with 4 hours duration and with rainfall rates quite soft, less than 0.7 mm.h-1, except after two hours of rainfall, which reached
the rate of 1.8 mm/h. The Figure 10 shows a good agreement between modeled and observed PM concentrations, in despite of the irst twenty minutes of rainfall time. Nevertheless, after that period, the observed PM concentration followed quite close to the modeled one, until 150 minutes.
The particulate matter variations and differences between simulated and observed could be also explained as it was described above, by the advection absence. These differences should be corroborated by the changing of the wind direction (see Figure 5b), where the irst thirty minutes (from 22:01 to 22:30 LT), the wind had been blown from WSW (around 250°), turning to W (270°), at 22:30 LT and it did not change anymore until the event ending. Therefore, in this case, almost without wind change, the observed PM concentration decrease could be easily attributed to the below cloud process, being very close to the modeled PM concentrations, even in absolute values. The square correlation coeficient presents the highest value of the all simulations: 0.93.
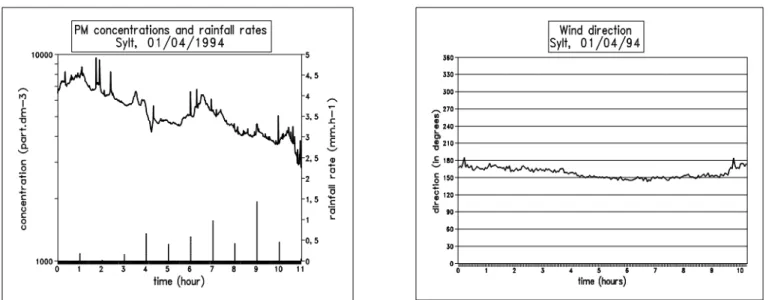
iv) The results for April 1st at Sylt Are Depicted in Figures 6 and 11.
The Figure 6a illustrates the longest event from the all sampled cases, lasting along 10 hours and with rainfall rates not higher than 1.5 mm.h-1, taking in account 1 hour mean.
The wind direction (Figure 6b) has been constant during whole event, blowing always from SSE (from 150 to 170°), from the sea, as expected for this area without transient systems. No wind direction alteration and with continuously soft rainfall rates could not explain the clear increase of the observed PM
Figure 7 - Particle matter concentration in air (as line and per dm3), collected at March 21st 1995, at Freiburg, from 16:30 LT to 17:05, and the respective rainfall rates (Figure a as bars) and wind direction (Figure b) at the same period.
concentration around 6 o'clock a.m. This increase should be attributed to a source at neighbourhood, as trafic vehicle rise, for example, probably at that time, or another source at SSE of the site. Nevertheless, these oscillations do not modify signiicantly the square correlation coeficient, keeping a signiicant value, around 0.80. Therefore, the modeled PM concentrations (Figure 11) could reproduce the observed concentration in a good agreement. In despite of the increase after 6 o'clock a.m., both concentrations follow each other almost in parallel.
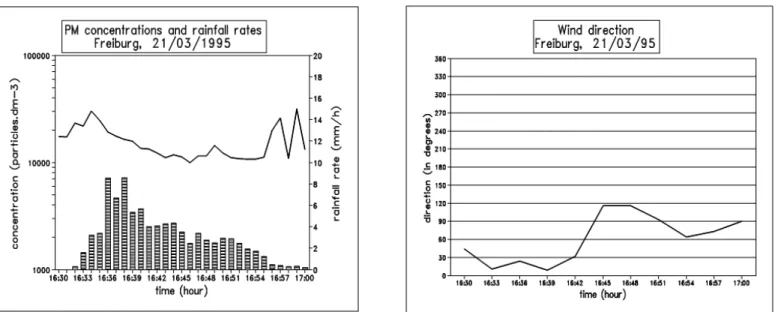
v) The Results for March 21st at Freiburg Are Depicted in Figures 7 and 12.
Figures 7a and 7b show the shortest event of all cases, less than 30 minutes, with rainfall rate reaching up
to 8 mm/h, presenting the only event with soft convective characteristics.
The modeling results (Figure 12) present a discrepancy between observed and modeled PM concentrations, exhibiting the lowest correlation coeficient from the all simulations, 0.60. This event presents the smallest dataset, last than 10 with three minute averages, in which, in this case is signiicant only with P<0.1. The peaks presented at the beginning, around 50 minutes of rainfall, could be due to the crossing vehicles, in the neighbourhood of the station, rather common in this site area, installed close of the street.
The wind direction (Figure 7b) could also explain the differences, presenting the greatest oscillation of the wind direction, within all events, oscillated irstly from the ENE/E to NNE, during the irst 40 minutes. After that, at 45 minutes of
Figure 9 - Particulate matter concentration in Deuselbach, 03/03/94: observed (normalized) and modeled, with t = 0 at 18:00 LT.
Figure 10 - Particulate matter concentration in Deuselbach, 05 to 06/03/9: observed (normalized) and modeled, with t = 0 at 22:00 LT .
Figure 11 - Particulate matter concentration in Sylt, 01/04/94: observed (normalized) and modeled, with t = 0 at 01:00 LT .
rainfall, it turned to the ESE (120°), returning to ENE and, more 9 minutes (after 54 minutes of the rainfall started) and to E, with 1 hour of rainfall time. These oscillations should partially be responsible by the PM concentration increase, at the beginning of the event, presented at the Figure 7a, with the soft peak at 16:50 and by the suddenly increment at 16:54. It also should be pointed out the event had been weakly convective, corroborating by the great oscillation of the wind direction.
vi) Wet Deposition
As an example, the amount of PM transferred from the atmosphere to the hydrosphere reservoir is at maximum about 10,000 particles per dm3 (at Freiburg event), by the below cloud process observed and modeled. Having the particles a density of 1 g/cm3, and mean aerodynamic diameter of 2 mm, it represents roughly 0.3 g/m2 of mass deposited on the ground by 4 mm of rainfall accumulated in the event time interval. Therefore based in this event, the transference of particle matter could be calculated in about 50 g/m2 per year by wet deposition, having a rainfall accumulation of 700 mm per year in Freiburg. This amount is higher than the literature data, as for example in Pruppacher and Klett (1997) around 1 to 7 g/m2 per year for urban areas. This higher result is expected due to the fact the modeling is dealing with just one single event which could overestimated the total removed by wet deposition in this region..
The other events present values below 10000 particles per dm3 and rainfall rates lower than the Freiburg event. The wet deposition is around 0.1 g/m2 of mass deposited on the ground by around 5-10 mm of rainfall accumulated. All with smaller wet deposition close to the literature, less than 10 g/m2.
4. CONCLUSIONS
Primarly the results presented herein show a reasonable agreement between the scavenging modeled and observed particulate matter concentrations, although the observed ones had underestimated the absolute modeled PM concentrations. The agreement could be veriied through the long events (many hours of rainfall) as well as the short ones (less than two hours of rainfall).
It is also interesting to point out that the stratiform events, characterised by rainfall rate smaller than 5 mm.h-1, typical for winter and spring in Germany, and without signiicant variations in the mean wind direction, have the highest correlation between observed and modeled PM concentrations. The wind direction variability could explain most of the differences between both concentrations. Therefore, the mass advection might be the explanation between modeled and observed PM concentration differences. That result should be improved with the 3-D
modelling perspective of the cloud scavenging processes. The disdrometric data set could reproduce the raindrop size distribution and were quite useful do validate the conceptual scavenging model.
The achieving results herein have shown the importance of the transference between the atmosphere and hydrosphere reservoirs, as well. This transference has a signiicative role, taking in account its impact on the ecosystems, particularly vegetation and soil. Therefore the particulate matter transference modeling, herein developed, is an approach, which could elucidate many implications such as the transference amounts and pollutant impacts.
Additionally, as consequence, these results validate the previous articles Gonçalves et al. (2000, 2002, and 2007) and Silva et al., (2008), where this conceptual model was based and applied with more complex modelling, but without disdrometric dataset support. All articles used B.V.2 model, which is based on the modeling herein described.
As perspectives, we will attempt to analyze the compounds inside the particulate matter and gases adding the 3-D modeling which includes the advection mass, in a numerical model such as B-RAMS.
5. ACKNOWLEDGEMENTS
Financial support of the German Ministry for Education and Research, the Ministry of Science and Research of Northrhine-Westphalia, ISAS.
6. REFERENCES
BERGIN, M.H, PANDIS, S.N., DAVIDSON, C.I., JAFFREZO, J.C., DIBBS, J.E., RUSSELL, A.G.., KUHNS, H.D. Modeling of the processing and removal of trace gases and aerosol species by Artic radiation fogs and comparisons with measurements. J. Geophys. Res., v. 101, n. D9, p.14465-14478, 1996. CAUTENET, S, LEVEIFRE, B. Contrasting behavior of gas
and aerosol scavenging in convective rain: A numerical and experimental study in the African equatorial forest.Journ. of Geophys. Research, v. 99, n. D6, p. 13013-13024, 1994. CARO, D., WOBROCK, W., FLOSSMANN, A. I.,
CHAUMERLIAC, N. A two-moment parameterization of aerosol nucleation and impaction scavenging for a warm cloud microphysics: description and results from a two-dimensional simulation.Atmos. Res., v.70, p.171-208, 2004. HAMPL, B., KERKER, M., COOKE, D.D.., MATIJEVIC, E.
Scavenging of aerosol particles by a falling water droplet. J.Atmos. Sci., v.28, n. 1211, 1971.
of atmospheric scavenging). Published in Berichtes des Zentruns für Umweltforschung, 3 (September) in Frankfurt, Johann Wolfgang Goethe-Universität.:79 págs.,1987. FLOSSMANN, A. I. Interactions of aerosol particles and clouds.
J. Atm. Sci, v.55, p. 879-887, 1998.
GONÇALVES, F.L.T.; MASSAMBANI O., BEHENG, K.D., SOLCI, M.C., ROCHA, V., SCHILLING, M., VAUTZ, W., KLOCKOW, D. Modeling and measurements of below scavenging processes in the highly industrialized region of Cubatão-Brazil. Atmos. Environ., v.34, n.24, p. 4113-4120, 2000.
GONÇALVES, F.L.T., MALHEIROS, A. R., FREITAS, R. S., ASSUNÇÃO, M. A. F., MASSAMBANI O. In-cloud and below-cloud numerical simulation of scavenging processes at Serra do Mar region, SE Brazil.Atmos. Environ., v.36, n.33, p. 5245-5255, 2002.
GONÇALVES, F.L.T., NAKAEMA, W.N., ANDRADE, M.F., FORNARO, A. In-cloud and below-cloud scavenging analysis of sulfate in the metropolitan area of São Paulo, Brazil. Revista Brasileira de Meteorologia, v.22, n.1, p. 94-104, 2007.
JAENICKE, R.; DAVIES, C.N. The mathematical expression of the size distribution of atmospheric aerosols. J. Aerosol Sci., v.7, p. 255-259, 1976.
JUNGE, C.E. Air chemistry and radioactivity. Academic, San Diego, Calif., Int. Geophys. Ser., v.4, p. 208-209, 1963. KASPER-GIEBL, A., KOCH, A., Hitzenberger, R., Puxbaum,
H. Scavenging eficiency of ‘aerosol carbon’ and sulfate in supercooled clouds at Mt. Sonnblick (3106 a.s.l. , Austria). J. Atm. Chem., v.35, p.33-46, 2000.
LEAITCH, W.R.; ISAAC, G.A. On the relationship between sulfate and cloud droplets number concentrations. J. of Climate, v.7, p.206-212, 1994.
OBERHOLZER, B.; VOLKEN, M.; COLLETT J.R., J.L.; STÄHELIN, J.; WALDVOGEL, A. Pollutant Concentrations and Below-cloud Scavenging of Selected N(-III) Species along a Mountain Slope. Water, Air and Soil Pollution, v.68, p. 59-73, 1993.
ORB, J. Modeling in-cloud scavenging: a comparison of measurements and modeling results. Dissertação defendida no Swiss Federal Institute of Technology, Zürich, Suiça, 102 págs, 1998.
PRUPPACHER, H.R.; KLETT, J.D. Microphysics of clouds and rainfall. Ed. Kluwer Academic Publishers Dordrecht, Netherlands. 714 págs., 1997.
SEINFELD, J.H.; PANDIS, S. Atmospheric chemistry and physics. Ed.: J.Wiley and Sons, 1326 págs, 1998.
SILVA, M.P.R.; GONÇALVES, F.L.T.; FREITAS, S. Two case studies of sulfate and nitrate scavenging processes in Amazonian region (rondonia) using numerical modeling with RAMS. Environmental Pollution, v.157, p. 637-645, 2008
STÄHELIN, J.; Waldvogel, A. COLLETT J.R.; DIXON J.R., HEIMGARTNER, R.; R.A; HENRICH, W.; HSU, C.; LI, S.; MOSIMANN, L.; OBERHOLZER, B.; REVOT, A.S.H.; SCHMIDT, W. SCHUMANN, T.; STEINER, M.; VOLKEN, M.; ZINDER, B. Scientiic Goals and Experiments of the Project “Winter Precipitation at Mount Rigi: an Overview. Water, Air and Soil Pollution, v.68, p.1-14, 1993.
VOLKEN, M. A. A Model of Below-Cloud Scavenging of Aerosols and Trace Gases: Results and Observations. Tese defendinda no Swiss Federal Institute of Technology, Zurique, Suiça, 157 págs., 1994.
WANG, P.K.; PRUPPACHEr, H.R. An experimental determination of the eficiency with which aerosols particles are collected by water drops in subsatured air. J.Atm. Sci., v.34, p.1664-1669, 1978.