Article
Printed in Brazil - ©2015 Sociedade Brasileira de Química0103 - 5053 $6.00+0.00
A
*e-mail: [email protected]
Cu and Ni Catalysts Supported on
γ
-Al
2O
3and SiO
2Assessed in Glycerol Steam
Reforming Reaction
Vivian V. Thyssen, Thaisa A. Maia and Elisabete M. Assaf*
Instituto de Química de São Carlos, Universidade de São Paulo, Av. Trabalhador Sãocarlense 400, 13560-970 São Carlos-SP, Brazil
Catalisadores de Cu e Ni suportados em γ-Al2O3 e SiO2 comerciais foram estudados frente
a reforma a vapor de glicerol. Os catalisadores foram preparados pelo método da impregnação e caracterizados por espectrometria de emissão atômica por plasma acoplado indutivamente, fisissorção de nitrogênio, redução a temperatura programada com H2 e difração de raios X. A
caracterização mostrou a presença de espécies com diferentes interações com os suportes: CuO, NiO e NiAl2O4. Os testes catalíticos foram realizados a 600 °C e, para o catalisador que apresentou
o melhor desempenho, foram realizadas reações a 500 °C e a 700 °C. Os testes mostraram que a presença de NiAl2O4 desfavorece a deposição de carbono, provavelmente devido à maior dispersão do Ni na superfície do catalisador. Observou-se também que o catalisador NiSi foi o que apresentou a maior atividade para a formação de H2, porém este apresentou a maior deposição de carbono
ao longo da reação.
Cu and Ni catalysts supported on commercial γ-Al2O3 and SiO2 were tested in the glycerol steam reforming. The catalysts were prepared by the impregnation method and characterized by inductively-coupled plasma atomic emission spectrometry, nitrogen physisorption, temperature programmed reduction with H2 and X-ray diffraction. The characterization indicated several
catalytic species in the samples interacting differently with the supports: NiO, CuO and NiAl2O4. The catalytic tests were performed at 600 °C, and the best catalyst was also tested at 500 °C and 700 °C. The results showed that the presence of NiAl2O4 did not favor the deposition of carbon
during the reaction, probably due to the greater dispersion of Ni on the catalyst surface. It was also observed that, although NiSi was the most active catalyst for H2 production, it also showed
the highest carbon deposit during the reaction.
Keywords: nickel, copper, catalysts, glycerol steam reforming
Introduction
Most of the world’s energy demand is supplied by fossil fuel burning. Besides subjecting countries to economic instability due to price fluctuations, these resources generate waste products that seriously endanger the environment, for example by global warming. Moreover, it is also known that one day these resources will be exhausted. Thus, alternative, clean and sustainable energy sources are vitally important.
One such alternative source of energy that stands out is
H2, which can be produced from renewable raw material
and whose combustion in fuel cells involves little waste
and practically no pollution. H2 can be produced by steam
reforming of hydrocarbons and alcohols, such as methane,
naphtha, methanol, ethanol and glycerol.1
Glycerol is produced as a byproduct in the transesterification reaction used to make biodiesel (equation 1), which is increasingly used as fuel, and the increase in its production results in a large supply of glycerol on the market. One possible way of using this
excess glycerol is in the production of H2 by glycerol
steam reforming reaction (GSR), given that, from 1 mol of
glycerol, up to 7 mol of H2 can be produced (equation 2).1
C3H5(OOC)3(Rn)3 + 3R’OH D 3RnCOOR’ +
C3H5(OH)3 (1)
C3H5(OH)3 + 3H2O D 3CO2 + 7H2
Buffoni et al.2 observed that the conversion of glycerol
into gaseous products depends greatly on temperature, with
a minimum temperature of 550 °C to achieve H2 selectivity.
According to Adhikari et al.,1 the conversion of glycerol
into H2 and CO2 involves preferential C–C bond cleavage
as opposed to the breaking of C–O bonds.
It is well established that catalysts with a noble metal in their compositions have excellent properties in various
reactions.3 However, these catalysts are expensive and
highly susceptible to deactivation by poisons such as sulfur. Thus, there is a need to develop catalysts that are specifically suited to each purpose. On account of their low cost and good activity, supported Cu and Ni systems are good alternatives to noble metals.
Carrero et al.4 studied Cu and Ni supported systems
and chose Ni as one of the active metals for their catalysts, owing to its good activity in the steam reforming processes. Researchers suggest that Ni catalysts favor the C–C
cleavage of the alcohols, leading to CH4, CO and H2
formation, but these catalysts are also known to favor the deposition of carbon, which may impair the performance of
the catalyst.5-7 CuNi bimetallic catalysts have been studied,
in order to avoid deactivation by carbon formation, due to
the ability of Cu to inhibit such formation.4
γ-alumina (γ-Al2O3) and silica (SiO2) are widely used as
supports, owing to their high specific areas, which provide a greater contact area and possibly a higher number of active sites for the desired reactions to occur.
Therefore, considering the need to seek new energy
sources and knowing the benefits of using H2, this article
focuses on the study of Cu, Ni and CuNi catalysts
supported on commercial γ-Al2O3 and on SiO2, applied to
the generation of H2 by the steam reforming of glycerol.
Experimental
Preparation
The catalysts were prepared by the wet impregnation method, with mass contents of 10% Cu and 10% Ni for monometallic catalysts and 5% Cu plus 5% Ni for bimetallic
catalysts, supported on the commercial γ-Al2O3 and SiO2.
Commercial SiO2 (Degussa, Aerosil 200) and γ-Al2O3
(Alfa-Aesar) supports were treated at 600 °C for 2 h under a flow of synthetic air, for thermal stabilization and surface water removal. The supports were impregnated with the metals wetting them with aqueous solutions of
Cu(NO3)2.3H2O and Ni(NO3)2.6H2O, the impregnation of
the bimetallic catalysts being performed simultaneously with the two metals; the excess water was removed by rotary evaporation at 80 °C for 6 h and the samples were
dried at 80 °C for 12 h. The catalytic precursor oxides were then prepared by calcination for 3 h at 600 °C, under
synthetic air flowing at 30 mL min−1. The samples obtained
were: 10% Cu/γ-Al2O3 (CuAl), 10% Ni/γ-Al2O3 (NiAl),
5% Cu 5% Ni/γ-Al2O3 (CuNiAl); 10% Cu/SiO2 (CuSi),
10% Ni/SiO2 (NiSi) and 5% Cu 5% Ni/SiO2 (CuNiSi).
Characterization
In order to measure the metal content of each sample, it was analyzed by atomic emission spectrometry of inductively-coupled plasma (ICP), with a Perkin Elmer ICP Optima 3000 DV. Ni and Cu standards were used to determine the calibration curve from which the concentrations of the metals in the catalysts were read.
The nitrogen physisorption (BET method) was used to determine the specific area of the catalysts, employing a Quantachrome Nova 1000e device.
Temperature-programmed reduction with H2 (TPR-H2)
was carried out on the samples, to study the reduction behavior of the oxide phases and, consequently, to monitor the degree of reduction and the interactions of the metal
phases with the support. The TPR-H2 analyses were carried
out in an Analytical Multipurpose System (AMPS3), the catalysts being reduced in a fixed-bed quartz reactor with
1.96% of H2/Ar (30 mL min−1), subject to a 10 °C min−1
heating ramp from 25 °C to 1000 °C.
The catalysts were characterized by X-ray diffraction (XRD) to identify the crystalline phases. The XRD analysis was performed on a Rigaku Multiflex diffractometer, with
Cu-Kα radiation. The Bragg angle was scanned at 2° min−1,
between 5° and 80° (2θ).
XRD patterns were also recorded in situ, under
activation conditions, at the XPD-10B beamline of the LNLS synchrotron radiation facility (Campinas, Brazil). The measurements were made in the reflection mode, in a
2θ interval from 30° to 75°, with radiation of λ = 1.54996 Å,
calibrated with a Si (1 1 1) monochromator. The oxidized
samples were heated in flowing H2 flow (30 mL min−1),
under a ramp of 10 °C min−1 from 25 °C to the reduction
temperature, and held at that temperature for 1 h, when a diffraction pattern was collected and the average size of the Ni metal crystallites on the catalysts was calculated from Scherrer’s equation (3).
L = (K.λ)/(β.cosθ) (3)
where L is the average width of the crystallite (nm), K is
Scherrer’s constant (ca. 0.9), λ is the wavelength of incident
radiation (nm), β is the half-height width of the most intense
Bragg angle of that peak (°).
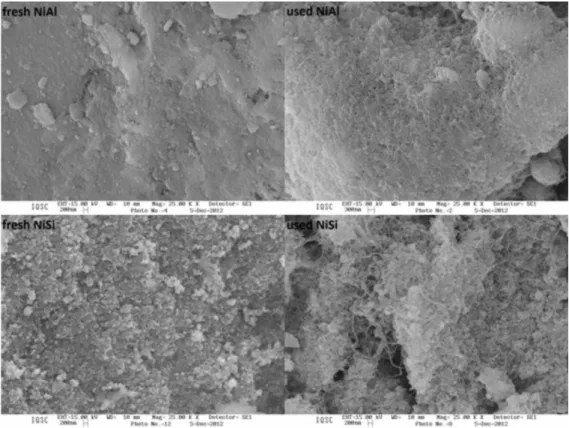
Both the fresh and used catalysts were analyzed by scanning electron microscopy (SEM) to assess the carbon formed on the catalysts. These analyses were performed on a LEO-440 scanning electron microscope equipped with an Oxford detector.
Thermogravimetric analysis (TGA) was performed to measure the weight loss on the used catalysts too, the analyses were performed with TGA/DSC1 supplied by Mettler Toledo.
Catalytic tests
The catalysts were activated (reduced) at various
temperatures, which depended on the TPR-H2 profiles of
each sample (NiAl and CuNiAl at 800 °C; CuAl, NiSi and
CuNiSi at 500 °C), for 1 h under flowing H2. The glycerol
steam reforming reactions were performed in a tubular quartz reactor with a water:glycerol molar ratio of 3:1, at
a flow rate of 2.5 mL h−1, produced with a high precision
pump. For each reaction, 150 mg of fresh catalyst was used. The tests were performed at 600 °C for 4 h. The catalyst with better performance was also tested at 500 °C and 700 °C.
The gaseous products were analyzed downstream with an in-line gas chromatograph (GC) (VARIAN GC-3800) with two columns in parallel, each with a thermal conductivity detector (TCD) at the outlet. The columns were packed with Porapak-N and 13X Molecular
Sieve, operating between 40 and 80 °C, with He and N2,
respectively, as carrier gas, flowing at 10 mL min−1. The
liquid products condensed at the reaction outlet were
analyzed with a gas chromatograph (Shimadzu), with H2 as
carrier gas and an HP5 capillary column, operating between 35 and 250 °C. During preparation of the liquid products for GC analysis, the solution was kept at a temperature below 10 °C, to avoid product evaporation.
The glycerol conversion to gaseous products was
calculated from equation 4.2
(4)
Results and Discussion
Characterization
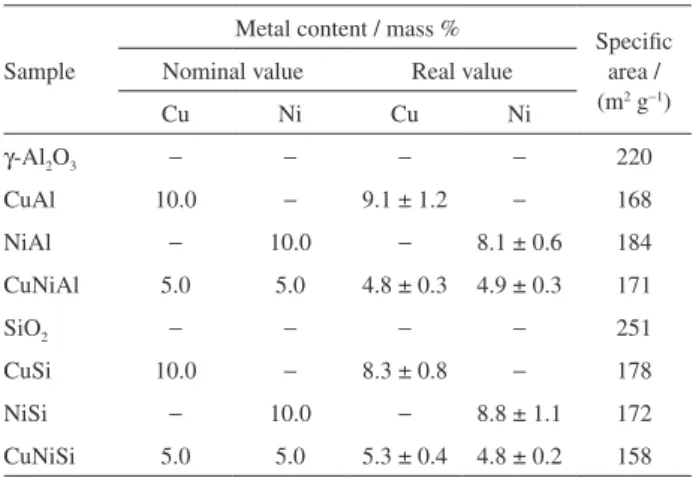
Table 1 shows the results of the metal content analysis of the catalysts, obtained by ICP, and the specific areas (BET method) of the supports and catalysts. The experiment values for metal content were close to the nominal content,
indicating that the preparation method was adequate. Small real differences in the values arise from the handling of the reactants during preparation.
These results show that there was a decrease in the original support area when metal impregnation was performed. This fact can be explained by assuming that, the Ni and Cu in calcined samples are in the oxide form of NiO and CuO, and these phases do not enlarge the surface area when the support already has a very high surface area, and, reduction in the specific area could result from either a partial obstruction of the pores on the support by the metal oxide or possible agglomeration of the metal on
the surface.8
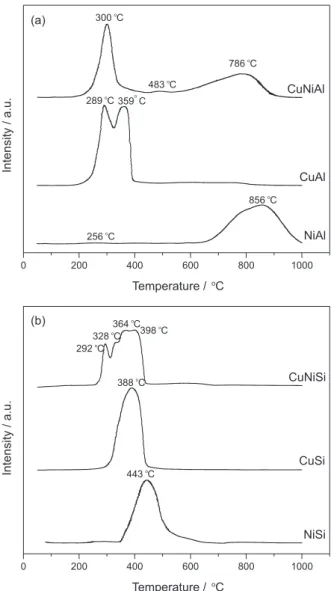
Figure 1a shows the results of the TPR analysis of the
catalysts with the metals supported on γ-Al2O3.
The TPR profile of the NiAl catalyst shows a large peak at 856 °C for reduction of the stoichiometric nickel
aluminate species (NiAl2O4) and a low peak at 256 °C,
which can be attributed to the reduction of NiO species that interact weakly with the support. In this catalyst, almost all the Ni is in stoichiometric nickel aluminate.
The literature usually reports the existence of four different species of nickel oxides: the first is reducible in the temperature range 250 °C to 350 °C and appears in the form of segregated crystallites that exhibit a very weak interaction with the support; a second species, reducible in the range 350 °C to 500 °C, consists of NiO in close contact with the support; that reduced in the range 500 °C to 750 °C consists of phases of non-stoichiometric nickel
aluminate (NiO-Al2O3) and that reduced above 750 °C
has the structure of stoichiometric nickel aluminate
(NiAl2O4). Species with stronger interaction with the
support show a higher temperature of reduction and are
harder to reduce.9-13
Table 1. Metal contents in the catalysts and specific areas of the catalysts
and supports
Sample
Metal content / mass % Specific
area / (m2 g−1)
Nominal value Real value
Cu Ni Cu Ni
γ-Al2O3 − − − − 220
CuAl 10.0 − 9.1 ± 1.2 − 168
NiAl − 10.0 − 8.1 ± 0.6 184
CuNiAl 5.0 5.0 4.8 ± 0.3 4.9 ± 0.3 171
SiO2 − − − − 251
CuSi 10.0 − 8.3 ± 0.8 − 178
NiSi − 10.0 − 8.8 ± 1.1 172
The TPR of the CuAl sample shows two peaks, the first at 289 °C and the second at 359 °C. These peaks can be
attributed to the reduction of copper oxide (Cu2+→ Cu0).
The first peak refers to the more dispersed CuO species
and the second to CuO crystallites.9-16
The CuNiAl catalyst TPR profile shows peaks at
300 °C, 483 °C and 786 °C. According to the literature,16,17
the first peak refers to the reduction of highly-dispersed copper oxide. There is only one copper oxide reduction peak, which may be due to the presence of nickel species that are reduced at the same temperature, hiding the two reduction peaks of the copper oxide species. The second peak refers to the reduction of NiO species interacting with the support and the third to the reduction of stoichiometric
nickel aluminate.9
According to Carrero et al.,4 copper has the property
of decreasing the reduction temperature of another metal on the support due to synergistic interaction between the
metal oxide phases.18 Thus, the decrease in the temperature
of reduction of the NiAl2O4 species in the bimetallic catalyst
can be explained (Figure 1a, 856 °C to 786 °C).
In the TPR of the sample of CuSi (Figure 1b), a peak at 388 °C is observed. This peak can be attributed to the
reduction of the copper oxide phase (Cu2+→ Cu0).16,19
The TPR profile of the catalyst NiSi shows a peak at
443 °C, referring to the reduction of Ni2+ in the NiO species
interacting with the support.3 Nickel silicates were not
detected, as these species would show reduction peaks at
a higher temperature.13 The presence of Ni3+ in the sample
can be discarded, owing to the absence of a reduction peak
at 200 °C.3,13
In the TPR of CuNiSi, peaks are observed at 292 °C, 328 °C, 364 °C and 398 °C. The first two peaks can be attributed to the reduction of the CuO species. The first peak refers to the more dispersed CuO species and the second to species in CuO crystallites, which have a
higher reduction temperature,16,19 as already mentioned.
The peak at 364 °C can be attributed to NiO species that interact weakly with the support and appear in the form of segregated crystallites, whereas the peak at 398 °C refers to the NiO species that have greater contact with
the support but do not form silicates.13,18 A decrease is
observed in the reduction temperature of NiO species in the bimetallic catalyst, compared to the NiSi monometallic catalyst, due to the synergistic interaction between the
CuO and NiO phases.18
Table 2 shows the H2 consumption during the reduction
of NiO, NiAl2O4 and CuO and the degree of reduction of
the catalytic metals.14
It can be seen that SiO2-supported catalysts showed
a higher degree of reduction of the metals than γ-Al2O3
-supported catalysts. This can be explained by the interaction of metal oxides with the supports. NiO and CuO species
supported on SiO2 interact weakly with the support and are
Figure 1. TPR profiles of catalysts supported on (a) γ-Al2O3 and (b) SiO2.
Table 2. H2 consumption by and degree of reduction of oxide phases
Catalyst H2 consumption / × 10
5 mol Reduction / %
CuO NiO NiAl2O4 Cu Ni
CuAl 14.0 − − 89 −
NiAl − − 12.4 − 73
CuNiAl 8.5 2.2 4.2 100 75
Catalyst H2 consumption / × 10
5 mol Reduction / %
CuO NiO Cu Ni
CuSi 17.1 − 99 −
NiSi − 16.2 − 95
thus more easily reduced, while the NiO-γ-Al2O3 (NiAl2O4)
shows a strong interaction, making the reduction of the metal more difficult.
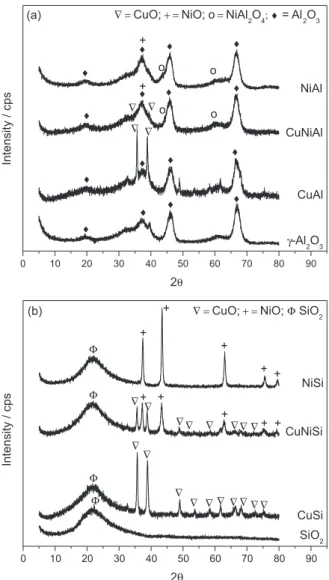
Figure 2a shows the diffractograms of the γ-Al2O3
-supported catalysts. The crystalline phases were identified
by comparison with JCPDS standards.20 The low
crystallinity of the catalysts is observed by the presence of broad and poorly defined peaks.
The peaks appearing at 2θ = 19.6°, 39.7°, 46.1°
and 66.5° in all diffraction patterns were attributed to
the support structure of γ-Al2O3 (JCPDS 82-1468). The
signals relating to three other oxide phases were also
observed: CuO, NiO and NiAl2O4. The signals related to
the CuO phase were observed at positions 2θ = 35.6° and
38.7°. As for the NiAl2O4 (JCPDS 10-0339) phase, peaks
were observed at 2θ = 46.1° and 59.7°, while for the NiO
phase (JCPDS 77-1877) there may be a signal at 37.6°, overlapping a signal related to the support.
Figure 2b shows the diffractograms of the catalysts
supported on SiO2. The peak that appears at 2θ = 22.3°, in
all the diffractograms, was attributed to the support structure
of SiO2 (JCPDS 84-0384). Signals referring to two other
oxide species were also observed: NiO and CuO. Those related to the NiO phase (JCPDS 77-1877) were observed
at 2θ = 37.5°, 43.5°, 63.0°, 75.5° and 79.5° and those related
to the CuO copper phase (JCPDS 80-1917) were observed
at 2θ = 35.6°, 39.0°, 48.7°, 61.8°, 65.5° and 66.4°.
Figure 3 presents the in situ XRD patterns of NiAl and
NiSi monometallic catalysts at room temperature and at reduction (activation) temperatures (850 °C and 450 °C, respectively). It may be noted that the peaks previously
observed at 2θ = 37°, 43° and 75°, related to NiO species,
disappear on reduction and peaks for metallic Ni0 appear at
2θ = 44°, 52° and 76°.20 The appearance of the Ni0 peaks is
an evidence of the reduction of NiO species in the catalysts.
The crystallite size of Ni0 was estimated by
Scherrer’s equation (equation 3), and it was found that
NiSi (0.4 nm) > NiAl (0.2 nm). The smaller size of Ni0
crystallites in the NiAl catalyst suggests a greater dispersion
of the nickel phase on the γ-Al2O3 support. In order to avoid
the formation of carbon, according to Chen et al.,21 small
Ni crystallites are highly desirable and the crystallite size of metallic Ni is a key factor for the formation of carbon.
Catalytic tests (glycerol steam reforming)
Considering the steam reforming reaction of glycerol (equation 2), with a water:glycerol molar ratio of 3:1, the reaction could, in theory, reach a maximum selectivity
of 70% formation of H2 and 30% of CO2. However, the
presence of CH4, CO, and in some cases, C2H4, as secondary
gas products and a number of liquid products, such as acetic acid and ethanol, indicates the occurrence of side reactions.
Figure 3. In situ XRD for NiAl and NiSi catalysts.
Figure 2. XRD patterns of catalysts supported (a) on γ-Al2O3 and (b)
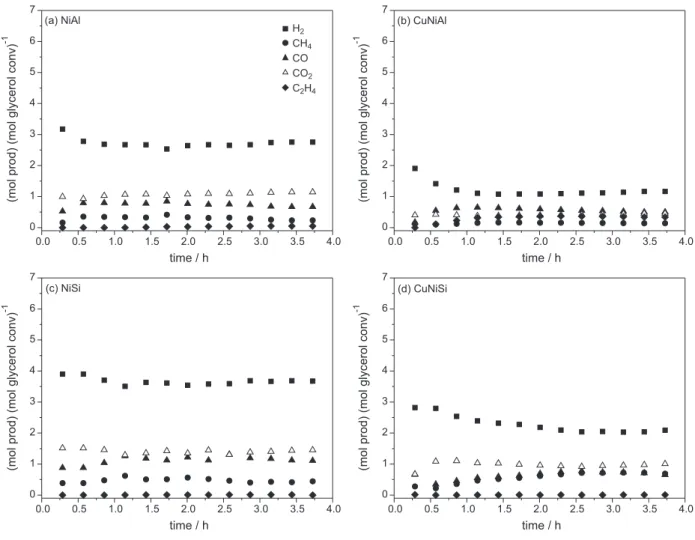
The results presented in Figure 4 and Table 3 were obtained with the monometallic Ni catalysts and bimetallic catalysts, which were active and stable during the reactions at 600 °C. The monometallic Cu catalysts supported on
γ-Al2O3 and on SiO2 were not active for the steam reforming
of glycerol under these experimental conditions.
Our results showed that the Cu activity in the steam reforming of glycerol is very low, the reaction being very slow. In the reactions on the monometallic catalysts of
Cu, an insignificant H2 selectivity and a very low glycerol
conversion were observed.
Figure 4 shows the evolution of reaction over time on stream to the catalysts. It can be seen that the formation
of all products remained constant throughout the reaction at 600 °C.
Table 3 shows the conversion of glycerol (gaseous
products),2 the formation of gaseous products and carbon
formation on the Ni monometallic catalysts and CuNi bimetallic catalysts.
It was observed that NiSi was the most active catalyst
for H2 production. However, at the same time, it was the
catalyst that produced the greatest carbon deposit during the catalytic test, which is deleterious to the process.
The great CO2 formation, compared to the CO
formation, in the reaction can be explained by the occurrence of the water-gas shift reaction (equation 5).
0.0 0.5 1.0 1.5 2.0 2.5 3.0 3.5 4.0 0
1 2 3 4 5 6 7
time / h
(a) NiAl
0.0 0.5 1.0 1.5 2.0 2.5 3.0 3.5 4.0 0
1 2 3 4 5 6 7
time / h
(b) CuNiAl
0.0 0.5 1.0 1.5 2.0 2.5 3.0 3.5 4.0 0
1 2 3 4 5 6 7
time / h
(c) NiSi
0.0 0.5 1.0 1.5 2.0 2.5 3.0 3.5 4.0 0
1 2 3 4 5 6 7
time / h
(d) CuNiSi
(mol prod) (mol glycerol conv)
-1
(mol prod) (mol glycerol conv)
-1
(mol prod) (mol glycerol conv)
-1
(mol prod) (mol glycerol conv)
-1
H2 H C 4 CO
O C 2 C H2 4
▲
Figure 4. Gas products of catalytic tests of GSR on the catalyst (a) NiAl, (b) CuNiAl, (c) NiSi and (d) CuNiSi, at 600 °C.
Table 3. Conversion (gaseous products), gaseous products/(mol prod).(mol glycerol in feed)−1 and carbon formed during GSR/(mmol C prod).[(mol
glycerol conv).h]−1
Catalyst Conversion / % H2 CH4 CO CO2 C2H4 Carbon
T = 600 °C
NiAl 69 2.7 0.2 0.3 0.5 − 0.4
CuNiAl 59 1.1 0.1 0.2 0.2 0.4 1.6
NiSi 72 3.7 0.3 0.5 0.7 − 2.2
Fierro et al.22 explain the occurrence of this reaction by its
thermodynamic equilibrium. CO can be produced by the
CH4 steam reforming reaction (equation 6) and by glycerol
direct decomposition (equation 7); thence, the equilibrium of the water-gas shift reaction can be shifted to the right,
favoring an increase in CO2 selectivity.
CO + H2O D CO2 + H2 ∆Hf25 °C = −41.99 kJ mol−1 (5)
CH4 + H2O D 3H2 + CO ∆Hf25 °C = +205.4 kJ mol−1 (6)
C3H5(OH)3D 3CO + 4H2 ∆Hf25 °C = +339.6 kJ mol−1 (7)
It can be seen that on SiO2-supported catalysts,
no C2H4 was formed during the reaction, while on the
γ-Al2O3-supported catalysts C2H4 appears among the
products. The formation of C2H4 is attributed to the acid
sites in the γ-Al2O3 support.23 It can also be seen that on the
catalyst NiAl, the formation of C2H4 was lower than on the
bimetallic catalyst CuNiAl, owing to a higher Ni content in the monometallic catalyst, which favors C–C cleavage
into the products CO2, CO, CH4 and H2.
The lower Ni content in the Ni–Cu catalysts may also
explain the decrease in H2 formation; moreover, the addition
of Cu to Ni-based catalysts can interfere with Ni availability on the surface of the material, thus hindering the Ni from cleaving the C–C bond and forming the expected gaseous products.
On the catalyst NiAl, the formation of carbon was lower than on all the other catalysts. The carbon may be formed by disproportionation of CO, leading to the formation of
CO2 and C, in the Boudouard reaction (equation 8). Another
possibility is the dissociation of CH4 (equation 9).
2CO D CO2 + C ∆Hf25 °C = −172.6 kJ mol−1 (8)
CH4D 2H2 + C ∆Hf25 °C = +74.9 kJ mol−1 (9)
The carbon formed during the reaction is expected to be at the metal-support interface, forming a filament and separating the metallic Ni from the support, until the catalyst is deactivated by loss of the active phase, which
happens with the breakup of the filament.24 Thus, Ni, which
favors the cleavage of C–C bonds (forming CO, CO2, CH4
and H2), loses this property.
The occurrence of the Boudouard reaction (equation 8) on the Ni catalysts should be considered likely, since the presence of the NiO species, observed in the TPR and XRD tests of the CuNiAl, NiSi and CuNiSi catalysts, favors the diffusion of carbon atoms. This diffusion occurs more readily in the presence of NiO, because this species does not interact strongly with the support, so that carbon atoms are more easily distributed on the interface between the metal and the support. However, in the presence of nickel
aluminate, this diffusion is hindered, since this species
interacts more strongly with the support.25
The nickel aluminate species, as precursors of catalysts, have been presented as the most stable species for nickel
reforming reactions, on account of the strong NiAl2O4
interaction, which favors the dispersion of Ni0 species
after activation and during the catalytic tests, in turn
preventing Ni0 sintering, thereby increasing their resistance
to deactivation by carbon formation. The addition of copper to the Ni catalyst led to the formation of nickel species interacting more weakly with the support, which do not benefit the catalytic process. Furthermore, the greater formation of stoichiometric Ni aluminate, identified by XRD and TPR analysis, in the monometallic Ni catalyst supported on alumina, may explain its lower carbon deposition during the reaction. This fact is consistent with the results already presented in the characterization of the
catalysts, in which NiAl showed the smaller Ni0 crystallite
size.
The addition of Cu to the NiSi catalyst led to a decrease in carbon formation during the reaction. The literature reports that Ni catalysts promote the formation of carbon, which is deposited between the metal phase and the support surface, as already mentioned, forming a filament that can be broken, thereby causing catalyst deactivation by the loss of the active phase. Cu does not favor the formation of carbon, as it changes the affinity of Ni for CO, not favoring
the occurrence of the Boudouard reaction (equation 8).9
The difference in the carbon formation between the
catalysts supported on γ-Al2O3 and on SiO2 can be explained
by the presence of NiAl2O4, which favors Ni0 dispersion.
According to the TPR results, SiO2-supported catalysts
did not show any kind of Ni interacting strongly with the support.
Electron micrographs of fresh and used NiAl and NiSi catalysts are shown in Figure 5 and it may be noted that the fresh catalysts exhibit different morphologies. After the reaction, on both NiAl and NiSi catalysts, carbon formation is evident, the carbon filament formation being greater on NiSi than on NiAl.
According to Lee and Li,26 Ni catalysts lead to the
formation of filamentous carbon during the reaction. This process leaves the active surface available, but continued filament growth results in fragmentation of the catalyst with loss of active phase.
The TGA profiles for used NiAl and NiSi catalysts samples are shown in Figure 6.
It can be seen that on NiAl catalyst, the carbon mass loss is lower than that on NiSi, which corroborates the theory that the greater dispersion of Ni on NiAl catalyst
Figure 6. TGA-DSC1 profiles of used NiAl and NiSi catalysts.
Figure 5. SEM images of fresh and used NiAl and NiSi catalysts.
catalyst; whereas in the NiSi catalyst, the presence of NiO explains the higher deposition of carbon in these material.
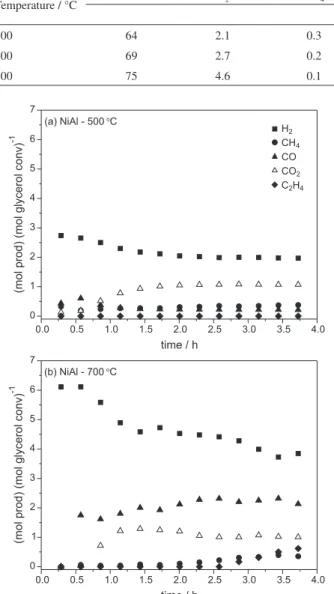
Figure 7 shows the catalytic performance of NiAl at 500 °C and 700 °C, and Table 4 shows the conversion of glycerol (to gaseous products), the formation of gaseous products and carbon on the NiAl catalyst, at the various temperatures.
The observed drop in CH4 selectivity and the rise in
the CO and H2 selectivity at 700 °C can be explained by
the thermodynamic equilibrium of the steam reforming of methane (equation 6), which is favored at the higher temperature. It was also observed that carbon formation decreased with increasing temperature, which can be explained by the inhibition of the Boudouard reaction (equation 8), since this is an exothermic reaction.
The CO2 formation, at 500 °C and 600 °C (Figure 4)
was greater than that of CO, which can be explained by the occurrence of the water-gas shift reaction (equation 5). However, at 700 °C, it can be seen that a reversal in the selectivity of these products occurred significantly more
CO being formed than CO2, which can be explained by the
occurrence of the steam reforming of methane (equation 6) and by the direct decomposition of glycerol (equation 7), as well as the reverse water-gas shift reaction, both of which are favored at this temperature.
The reverse water-gas shift reaction can also explain
Table 4. Conversion of glycerol (to gaseous products), gaseous products/(mol prod).(mol glycerol in feed)−1 and carbon formed during GSR on the catalyst
NiAl/(mmol C prod).[(mol glycerol conv).h]−1, at 500 °C, 600 °C and 700 °C
Temperature / °C Conversion / % H2 CH4 CO CO2 C2H4 Carbon
NiAl
500 64 2.1 0.3 0.1 0.4 − 1.1
600 69 2.7 0.2 0.3 0.5 − 0.4
700 75 4.6 0.1 1.0 0.5 0.2 0.2
0.0 0.5 1.0 1.5 2.0 2.5 3.0 3.5 4.0 0
1 2 3 4 5 6 7
time / h
(a) NiAl - 500oC
0.0 0.5 1.0 1.5 2.0 2.5 3.0 3.5 4.0 0
1 2 3 4 5 6 7
time / h
(b) NiAl - 700oC
H2
H C 4
CO O C 2
C H2 4
▲
(mol prod) (mol glycerol conv)
-1
(mol prod) (mol glycerol conv)
-1
Figure 7. Tests of the catalyst NiAl in the GSR reaction at (a) 500 °C
and (b) 700 °C.
during the reaction at 700 °C, at the same time that CO2
yield decreases, a rise in CO yield is observed.
Besides the gaseous products, the reaction of steam and glycerol also formed liquids under these conditions. The liquids formed during the reaction were identified (not quantified) as a mixture of acetic acid, 1,2,3-butanetrioltrinitrate, diglycerol, 1,2-propanediol, propanal, butanoic acid, pentanoic acid, 2-propanol, ethanol and ethylene glycol.
Conclusions
In the characterization of the catalysts, various kinds of metal-support interaction were observed, the catalysts
supported on alumina showing stronger interactions than those supported on silica. These interactions were reflected in the catalytic performance and, from the present results, it was possible to conclude that the formation of nickel-aluminate impeded the deactivation of the catalyst by carbon deposition. The best catalytic performance, with
high H2 selectivity and the lowest carbon formation, was
observed on the catalyst NiAl at 700 °C.
References
1. Adhikari, S.; Fernando, S.; Gwaltney, S. R.; To, S. D. F.; Bricka, R. M.; Steele, P. H.; Haryanto, A.; Int. J. Hydrogen Energy 2007, 32, 2875.
2. Buffoni, I. N.; Pompeo, F.; Santori, G. F.; Nichio, N. N.; Catal. Commun. 2009, 10, 1656.
3. Kirumakki, S. R.; Shpeizer, B. G.; Sagar, G. V.; Chary, V. R.; Clearfield, A.; J. Catal.2006, 242, 319.
4. Carrero, A.; Calles, J. A.; Vizcaíno, A. J.; Appl. Catal., A 2007, 327, 82.
5. Mariño, F.; Boveri, M.; Baronetti, G.; Laborde, M.; Int. J. Hydrogen Energy2001, 26, 665.
6. Mariño, F.; Baronetti, G.; Jobbagy, G.; Laborde, M.; Appl. Catal., A2003, 238, 41.
7. Galvita, V. V.; Semin, G. L.; Belyaev, V. D.; Semikolenov, V. A.; Tsiakaras, P.; Sobyanin, V. A.; Appl. Catal., A2001, 220, 123. 8. Chica, A.; Sayas, A.; Catal. Today2009, 146, 37.
9. Lee, J.; Lee, E.; Joo, O.; Jung, K.; Appl. Catal., A2004, 269, 1. 10. Rynkowski, J. M.; Paryjczak, T.; Lenik, M.; Appl. Catal., A
1993, 106, 73.
11. Lu, Y.; Xue, J.; Yu, C.; Liu, Y.; Shen, S.; Appl. Catal., A1998, 174, 121.
12. Dewaele, O.; Froment, G. F.; J. Catal.1999, 184, 499. 13. Vos, B.; Poels, E.; Bliek, A.; J. Catal.2001, 198, 77. 14. Dong, W. S.; Roh, H. S.; Jun, K. W.; Park, S. E.; Oh, Y. S.; Appl.
Catal., A2002, 226, 63.
15. Zhang, X.; Liu, J.; Jing, Y.; Xie, Y.; Appl. Catal., A2003, 240, 143.
16. Dow, W. P.; Huang, T. J.; Appl. Catal., A1996, 141, 17. 17. Dow, W. P.; Wang, Y. P.; Huang, T. J.; Appl. Catal., A2000,
190, 25.
19. Chen, L. F.; Guo, P. J.; Qiao, M. H.; Yan, S. R.; Li, H. X.; Shen, W.; Xu, H. L.; Fan, K. N.; J. Catal.2008, 257, 172. 20. JCPDS International Centre for Diffraction Data (JCPDS-ICDD
1994), Joint Committee on Powder Diffraction Standards; Pensilvânia USA, 1994. CD ROM.
21. Chen, H.; Yu, H.; Peng, F.; Yang, G.; Wang, H.; Yang, J.; Tang, Y.; Chem. Eng. J. (Loughborough, Engl.)2010, 160, 333. 22. Fierro, V.; Akdim, O.; Provendier, H.; Mirodatos, C.; J. Power
Sources2005, 145, 659.
23. Maia, T. A.; Bellido, J. D. A.; Assaf, E. M.; Assaf, J. M.; Quim Nova2007, 30, 339.
24. Trimm, D. L.; Catal. Today1999, 49, 3.
25. Bradford, M. C. J.; Vannice, M. A.; Appl. Catal., A 1996, 142, 73.
26. Lee, W. J.; Li, C.; Carbon2008, 46, 1208.
Submitted: December 10, 2013
Published online: September 12, 2014