Engineering
ISSN: 1809-4430 (on-line)
_________________________
1 Partes deste trabalho foram apresentadas no XLI Congresso Brasileiro de Engenharia Agrícola, XXXIV Congresso Nacional de Matemática Aplicada e Computacional, I Simpósio Brasileiro de Pecuária de Precisão Aplicada a Bovinocultura de Corte e XX Jornadas de Jovenes Investigadores da Asociacion de Universidades Grupo Montevideo.
2 Graduado, Mestre e Livre-Docente em Matemática, Doutor em Agronomia, Prof. Adjunto, Faculdade de Ciências e Engenharia, UNESP - Univ Estadual Paulista, Laboratório de Matemática Aplicada e Computacional, Tupã - SP, Fone: (14) 3404-4200, [email protected]
3 Bacharel em Administração, Mestre e Doutor em Agronomia, Prof. Assistente Doutor, Faculdade de Ciências e Engenharia, UNESP - Univ Estadual Paulista, Tupã - SP; UNIFENAS - Univ José do Rosário Vellano, Alfenas - MG,
4 Graduada e Mestre em Matemática, Doutora em Agronomia, Prof. Assistente Doutor, Faculdade de Ciências e Engenharia, UNESP- Univ Estadual Paulista, Tupã - SP, [email protected]
5 Bacharel em Administração, Tecnólogo em Análise e Desenvolvimento de Sistemas, Mestre em Agronegócio e Desenvolvimento, Doutorando em Agronomia, [email protected]
6 Médico Veterinário, Prof. Doutor, UNOESTE – Univ do Oeste Paulista, Presidente Prudente - SP, [email protected] 7 Graduado, Mestre e Livre-Docente em Matemática, Doutor em Agronomia. [email protected]
SOFTWARE TO ASSESS BEEF CATTLE BODY MASS THROUGH THE FUZZY BODY
MASS INDEX1
Doi:http://dx.doi.org/10.1590/1809-4430-Eng.Agric.v36n1p179-193/2016
LUÍS R. A. GABRIEL FILHO2, FERNANDO F. PUTTI3, CAMILA P. CREMASCO4,
DEYVER BORDIN5, MARCELO G. M. CHACUR6, LUIZ R. A. GABRIEL7
ABSTRACT: The Body Mass Index (BMI) can be used by farmers to help determine the time of evaluation of the body mass gain of the animal. However, the calculation of this index does not reveal immediately whether the animal is ready for slaughter or if it needs special care fattening. The aim of this study was to develop a software using the Fuzzy Logic to compare the bovine body mass among themselves and identify the groups for slaughter and those that requires more intensive feeding, using "mass" and "height" variables, and the output Fuzzy BMI. For the development of the software, it was used a fuzzy system with applications in a herd of 147 Nellore cows, located in a city of Santa Rita do Pardo city – Mato Grosso do Sul (MS) state, in Brazil, and a database generated by Matlab software.
KEYWORDS:computer system, IMC, Mamdani and profits.
SOFTWARE PARA A AVALIAÇÃO DE GANHO CORPORAL DE REBANHO NELORE
PELO ÍNDICE DE MASSA CORPORAL FUZZY
RESUMO: O Índice de Massa Corporal (IMC) pode ser utilizado por pecuaristas para auxiliar na determinação do momento da avaliação de ganho corporal do animal. No entanto, o cálculo desse índice não revela imediatamente se o animal está apto ao abate ou se necessita de cuidados especiais para recuperação. O objetivo deste trabalho foi desenvolver um software utilizando a lógica fuzzy
para a comparação da massa corporal de bovinos entre si e identificação dos grupos para abate, e dos que necessitam de alimentação mais intensa, utilizando-se das variáveis “massa” e “altura”, e a saída IMCFuzzy. Para a elaboração do software, utilizou-se de um sistema fuzzy com aplicações em
um rebanho de 147 vacas nelore, localizado em Santa Rita do Pardo-MS, e um banco de dados gerado pelo software Matlab.
PALAVRAS-CHAVE: sistema computacional, IMC, Mamdani, lucros.
INTRODUCTION
MONTIEL & AHUJA (2005) analyze bodily aspects that alter the reproduction of animals, which affect the quality of meat and the poor development of the calf. REZENDE et al. (2012) finds relationships between genotype and phenotype of animals facing slaughter, in which groups with the best phenotypes excel in meat quality.
In agricultural engineering, mathematical models with real application in the area are being developed using numerical correction equations of temporal variables (GABRIEL FILHO et al., 2011b), or by developing systems based on artificial intelligence (GABRIEL FILHO et al., 2011a e PEREIRA et al., 2008), in companies of laying aviculture (CREMASCO et al., 2010), energy generation solar photovoltaic and wind power for rural electrification (CANEPPELE et al., 2013), evaluate vitality of catasetum fimbiratum species (Orchidacea) (PUTTI et al., 2014),evaluation of uncertainty transaction in cassava chain (GABRIEL FILHO et al., 2015) and application of controlled by fuzzy logic in electrically driven fertilizer (GARCIA et al., 2014).
Also applications for the prevention of diagnosis in dairy cattle (MOLLO NETO et al., 2014), and not to predict the bays occupancy rate (CAMPOS et al., 2013), in determining the prediction of broiler chickens (PONCIANO et al., 2012) and thermal comfort chickens (NASCIMENTO et al., 2011).
According to GABRIEL FILHO et al. (2011a), an analytical framework of fuzzy rule-based system with the implementation of MATLAB was carried out, which indicated the body mass index of the cattle. Which had as input "Mass" and "Height" and as output the body mass index, called the Fuzzy Body Mass Index (Fuzzy BMI). This proposed system reported that it in its performed a validation based on a statistical analysis using the Pearson correlation coefficient of 0.923, representing a high positive correlation and indicating that the proposed method is accurate.
In agriculture there are various software that help producers in decision making, in the determination of the rice grain quality (CAPPELLI et al., 2015), the interference of climate change on production (LARDY et al., 2015) information management system precision agriculture (NIKKILÄ et al., 2010) also the characterization of the types of insects (ÁLVAREZ et al., 2012).
The aim of this study was to develop a computer program in DELPHI language. The simulate the consequences of the real application of the results by creating a methodology for managing pasture to assist the decision making of cattleman and demonstration of an analysis of the gain in arrobas and financial resources of a herd. Which will enable the farmer to periodic evaluation of his herd seeking the best fit to evaluate the herd body gain and thus determine the moment to slaughter the cattle.
MATERIAL AND METHODS
Description of the cattle and analysis variables
The experimental data were obtained in a farm located from a city of Santa Rita do Pardo-MS (latitude 21° 18' 10'' S, longitude 52° 49' 50'' W and 360m of altitude), from a total of 147 Nellore beef between 5 and 7 years old.
There types data were obtained from the animals, "Mass" (in kilograms), "Height" (in meters) and "BMI" (body mass index in kg.m-²), for de calculate was utilized the MINITAB 16 (2014). BMI is derived data since it is calculated from the relation:
BMI = (1)
Methods of preparing the proposed fuzzy system
"Good" and "Very good" see (KLIR & YUAN, 1995; MASSAD et. al., 2008; LABABIDI et. al., 2006).
For the creation of a system based on fuzzy rules, it was necessary to define an input processor (or fuzzificator), a set of linguistic rules, a fuzzy inference method and a output processor (or defuzzificator) that generates a real number as output according to this proposed system, which is represented in Figure 1, a software system was (GABRIEL FILHO et al., 2011a).
FIGURE 1. Fuzzy rule-based system for cattle use with two input variables ("Mass", "Height"), a variable output (Fuzzy BMI) and 25 rules.
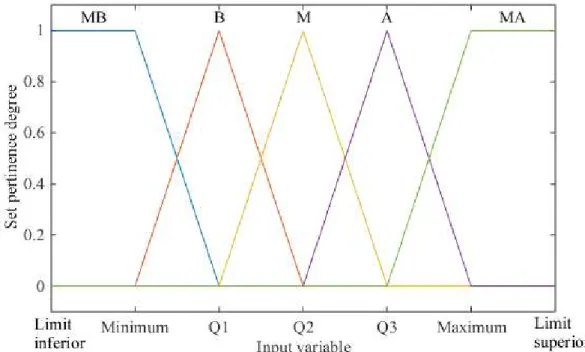
According to GABRIEL FILHO et al. (2011a), the input variables of the proposed system based on fuzzy rules were the "Mass" and "Height" of the animals. For each variable five membership functions called "Very Low" (VL), "Low" (L), "Medium" (M), "High" (H) and "Very High" (VH), were defined according to Table 1. Quartiles of the data groups are represented by Q1, Q2 and Q3, and uses the maximum and minimum values, and also inferior and superior limits defined by the numbers respectively smaller and larger than the minimum and maximum, enabling the use of the system to other animals not evaluated (Figure 2).
TABLE 1. Definition of the pertinence functions of the input variables.
Fuzzy set Type Delimiter
“Very Low” (VL) Trapezoidal [ Inferior Limit - 1, Inferior Limit, Minimum, Q1 ] “Low” (L) Triangular [ Minimum, Q1, Q2 ]
“Medium” (M) Triangular [ Q1, Q2, Q3 ]
“High” (H) Triangular [ Q2, Q3, Maximum ]
“Very High” (VH) Trapezoidal [ Q3, Maximum, Superior Limit, Superior Limit + 1 ]
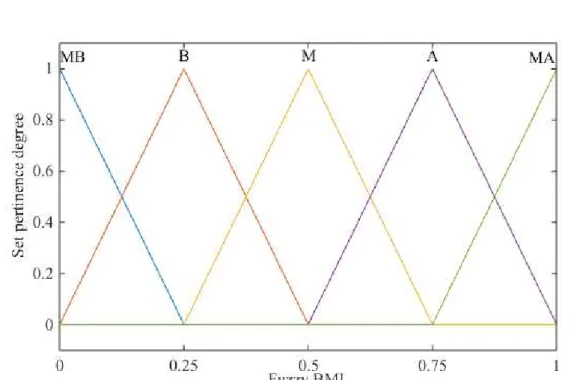
The output variable of the fuzzy system was called fuzzy body mass index (Fuzzy BMI), generating a real number in the interval [0,1]. The membership functions of this variable contains the same names of the input variable functions. And were all of a triangular kind. The sets VL and VH were represented by functions with 0.25 support and the sets L, M and H were with 0.5 support, according to Table 2 and Figure 3.
TABLE 2. Definition of the pertinence functions of the output variables.
Fuzzy Set Type Delimiters
“Very Low” (VL) Triangular [ -1; 0; 0.25 ] “Low” (L) Triangular [ 0; 0.25; 0.5 ] “Medium” (M) Triangular [ 0.25; 0.5; 0.75 ]
“High” (H) Triangular [ 0.5; 0.75; 1 ] “Very High” (VH) Triangular [ 0.75; 1; 2 ]
FIGURE 3. Pertinence functions defined to the fuzzy sets of the Fuzzy BMI output variable.
TABLE 3. Combinations of the input variables with points of 1 degree of pertinence associated with the fuzzy sets to generate the Rule Base.
Variable
Mass Height
Fuzzy Set Point with 1 degree of
pertinence associated Fuzzy Set
Point with 1 degree of pertinence associated
VL Minimum VL Minimum
VL Minimum L Q1
VL Minimum M Q2
VL Minimum H Q3
VL Minimum VH Maximum
L Q1 VL Minimum
L Q1 L Q1
L Q1 M Q2
L Q1 H Q3
L Q1 VH Maximum
M Q2 VL Minimum
M Q2 L Q1
M Q2 M Q2
M Q2 H Q3
M Q2 VH Maximum
A Q3 VL Minimum
A Q3 L Q1
H Q3 M Q2
H Q3 H Q3
H Q3 VH Maximum
VH Maximum VL Minimum
VH Maximum L Q1
VH Maximum M Q2
VH Maximum H Q3
VH Maximum VH Maximum
Methods for preparing the proposed fuzzy system
These calculated values of BMI of the points with 1 degree of membership were classified by associations with the fuzzy sets of the output variable. For this, the percents were determined at levels 0% (minimum), 20%, 40%, 60%, 80% and 100% (maximum) of the data group BMI of the 147 animals, performing a subsequent classification of BMI of the points with 1 degree of membership, according to the following convention, characterizing the rule base of the fuzzy system:
- If BMI ≤ P(20%) the Fuzzy BMI is “Very Low” (VL);
- If P(20%)≤ BMI < P(40%) the Fuzzy BMI is “Low” (L);
- If P(40%)≤ BMI < P(60%) the Fuzzy BMI is “Medium” (M);
where,
represents the percentile in the level of the calculated values sets of the BMI of the 147 animals.
Mandani the inference method used to calculate the numerical value of the output variable in accordance with Rule Base was the with the aid of Fuzzy Logic Toolbox of the software MATLAB® R2014b, Copyright 1984-2014 The MathWorks Inc. (MATLAB, 2014), it was possible to create a computationally system based on fuzzy rules, and also determine a surface and a contour map of the system representation.
The Laboratory of Computational and Applied Mathematics pertaining to the Faculty of Science and Engineering in UNESP, University Estadual Paulista, location where the numerical and experimental studies of this project were developed, owns the license for the use of that software.
Methodologies for determining the higher degree of pertinence of Fuzzy BMI
In order to determine the highest degree of membership of each fuzzy set calculated after applying the fuzzy system it was necessary to determine the ranges of the points with fuzzy BMI with the highest degree of membership of each fuzzy set VL, L, M, H and VH.
Using the notation Pi = 0.25· i to i = 0,...,4, the membership functions of the fuzzy sets of the
input variables may be written in this form:
,
(2)
(3)
where,
FuzzySet represents the fuzzy sets VL, L, M, H and VH.
The intersection points between lines (that intersects each other) of the pertinence functions of the fuzzy sets regarding to the input variables are given by:
(4)
where,
AntFuzzySet and PostFuzzySet represents the anterior and posterior adjacent fuzzy sets. Thus,
the midpoints between the quartiles coincide with the points of intersection of pertinence functions of adjacent fuzzy sets.
Thus, indicating the fuzzy sets VL, L, M, H and VH by , with assuming the values 0, 1, 2, 3 and 4, respectively, we have:
- If , then , and
(with higher degree of pertinence to this last set), to i = 1,2,3;
this last set). In the case, ,
- If , then and (with higher degree of pertinence
to this last set). In the case, .
Furthermore, it can be said that:
- If fuzzy BMI is lower than , then it have an higher degree of pertinence to VL set;
- If fuzzy BMI is lower than and lower than , then it have an higher degree
of pertinence to L set;
- If the fuzzy BMI is higher than and lower than , then it have an higher
degree of pertinence to M set;
- If the fuzzy BMI is higher than and lower than , then it have an higher
degree of pertinence to H set;
- If the fuzzy BMI is higher than , then it have an higher degree of pertinence to VH
set.
Methodologies for determining the ideal masses for slaughter
In order to determine the ideal weight to slaughter the animals, we started from the formula of the desired BMI that indicates that the animals can be slaughtered, this desired BMI was calculated from the average BMI of the "M" group, minimum group to be slaughtered:
(5)
After calculating these values, it was necessary to calculate the desired masses for the animal to reach the minimum BMI to be slaughtered, from the relation:
(6)
After the implementation of the fuzzy system, a database with information of (1) Mass and (2) Height was created. For the database, data between [142; 595 kg] were created, regarding to minimum and maximum heats of the registered cattle of the experimental herd used. Similarly for height were used inferior and superior limits of the height values established for the experimental herd. To this database, 13,620 combinations were made creating pairs of values of mass and height in which the mass ranged 1kg and the height 1 centimeter.
After creating this database in a spreadsheet form, the command “xlsread” of the Matlab software was used to read the spreadsheet created. With the "evalfis" command of Matlab software, the fuzzy BMI was calculated for each data pair (mass, height), and an "xlswrite" spreadsheet data was obtained.
- existent variables: mass, height, ; - mass_min: = 142; and mass_max: = 595;
- If, (mass < mass_min) so (Fuzzy BMI = 0.08 and = "VL"); - If, (mass > mass_max) so (Fuzzy BMI = 0.92 and = "VH”).
RESULTS AND DISCUSSION
The minimum and maximum values of height and weight, which were collected from the herd used for the study were, respectively, [1.21 m, 1.5 m] and [142 kg, 595 kg] with these values it was possible to establish a database with all possible combinations of mass and height, and the Fuzzy BMI was calculated by the Matlab software. After this step, the software was prepared in Delphi language, where these combinations were used the as basis for calculation of other values that are not present in this intervals.
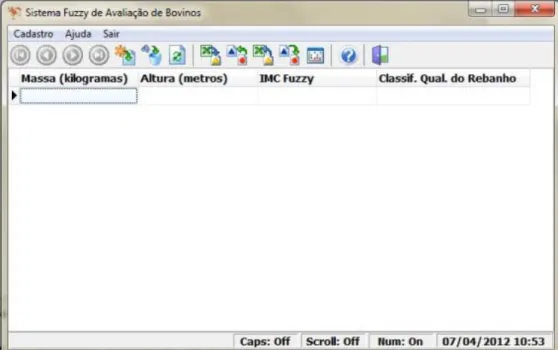
The software (Figure 4) may be used to analyze the animals of the herd of cattle individually (Figure 5), where the quantitative and qualitative classification is made automatically, we took as an example, an animal from a herd with mass of 300 kg and 1.4 m height and obtained result of the fuzzy BMI as = 0.0878 which resulted in “Very low (VL) (Figure 6).
FIGURE 5. Interface of the software, in the moment of the insertion of the data to analysis, with Mass in kilograms and Height in meters.
FIGURE 6. Results of the analysis in the Software, in which was inserted a Mass of 300kg and Height of 1.4m and was obtained a Fuzzy BMI of 0.877 and its classification was “VL”.
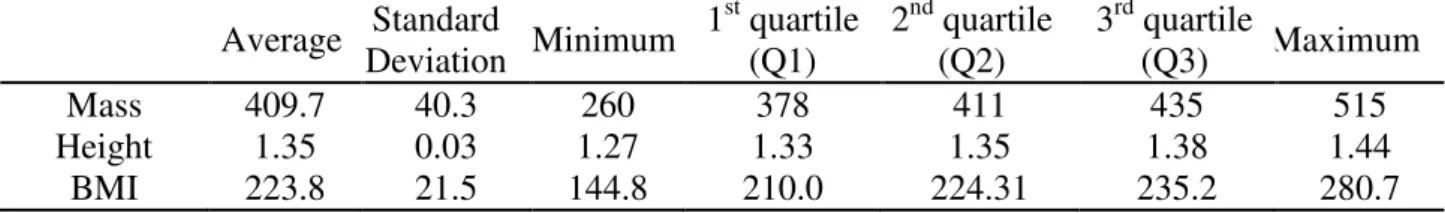
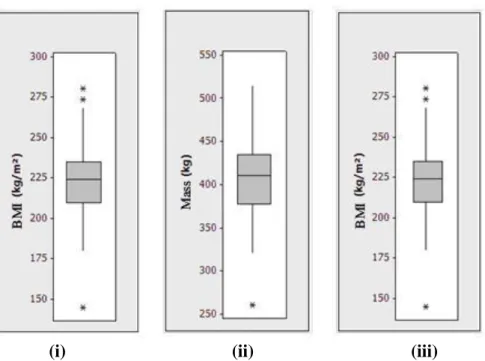
The descriptive statistical analysis of the information regarding analyzed animals data mass (kg), height (m) and body mass index (kg.m-²) performed, can be seen in Table 5 and Figure 7.
TABLE 5. Descriptive analysis of Mass, Height and BMI data of the animals of this study.
Average Standard
Deviation Minimum
1st quartile (Q1)
2nd quartile (Q2)
3rd quartile
(Q3) Maximum
Mass 409.7 40.3 260 378 411 435 515
Height 1.35 0.03 1.27 1.33 1.35 1.38 1.44
(i) (ii) (iii)
FIGURE 7. Box plot to the sample data of the (i) Mass, (ii) Height and (iii) BMI data of the animals.
Figure 8 shows the amount of each animal per group and its percentage, which indicates which animals are more propitious to be slaughtered, and which should stay longer to acquire the ideal weight for slaughter.
FIGURE 8. Distribution of the amount of animals and its respective percentages by analysis group.
Thus, the Box Plot of the Fuzzy BMI of the studied animals of their respective groups were
FIGURE 9. Box plot of the Fuzzy BMI of the VL, L, M, H and VH groups.
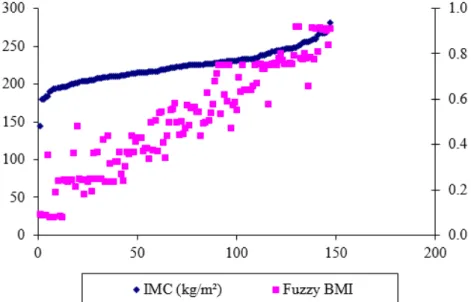
The software, after performing the classification of animals, first prepares a graph that shows the result of each individual (Fuzzy BMI), the regression line of the analysis performed (Figure 10)
and also prepares a graph showing the relation between the BMI and Fuzzy BMI, where a
correlation of 0.923 was observed, for our data. This is very close to 1, showing that the proposed method is very suitable for helping decision making of the producer (Figure 11).
FIGURE 10. Graph created from the software, indicating the relation between the Fuzzy BMI and
FIGURE 11. Relation between the conventional BMI and the Fuzzy BMI, which presents a relation
of 0.923.
Also, the groups of the “MR” and “R” herd were superior, and a proper treatment for such cows to be similar to the group "M” was held, the quality of the body of the herd would be better and its weight would be higher.
To quantify this gain, the average of the animals in the group "M" was calculated. From this value, if all the animals in groups "VL" and "L" reached the average of the animals of group "M" that was 222.13 kg.m-², the gain in quantity of arrobas (@) would be 61.30@, and adopting the arroba price of beef cattle (for slaughter) in the state of Mato Grosso do Sul by the PECUÁRIA (2012) site, which was R$ 90.00 (~U$$ 35,00), the financial gain would be approximately R$ 5.500.00 (~U$$ 2000,00). This value is a parameter to help the producer decide if it’s worthy to use the methods proposed to determine the best moment to slaughter the animal, thereby leveraging their income.
However, this result of body mass gain may be interpreted as a major benefit in increasing the birth rate of these animals (when the herd is not for meat production), because according to ROCHE (2006), cows with lower body score have lower birthrate because the recovery of postpartum body condition is more difficult. Since this condition overrides the subsequent breeding season, so the body condition may also indicate that the demand for food by the herd is not being supplied by the posture of farm.
According COLAZO & KASTELIC (2012), practices that involve the welfare of the management and playback can boost productivity and meat quality, thereby raising the selling price. The body mass gain of the cattle is not only important for the purpose of slaughter, but rather assumes great prominence at the moment of reproduction, which is closely linked to productivity of farms (FAULKNER, 1990; BROWNE et al., 2000; CHACUR et al., 2012; CHACUR et al., 2013).
Thus, for this herd of 147 Nellore cows producers may have a gain of around 10% in mass, if they could modify the procedure for creation of "VL" and "L" groups, defined.
CONCLUSIONS
This study establishes a computational method capable of interpreting the body mass index of any kind of cattle and in any region of the country. This method, that is able to imitate part of the human reasoning, was based on fuzzy logic.
This interpretation of this index, defined as Fuzzy Body Mass Index (Fuzzy BMI) is
A significant innovation compared to systems based on fuzzy rules is that the existing rule base system created in this study has not been drawn from interviews with experts in the area, but by the pre-existing Body Mass Index (BMI).
The cattle evaluation software in systems of fuzzy rules developed in this study is an easy program to use that can help producers in any region or producers of different breeds, indicating the levels of Fuzzy BMI, which possibly would help to determine the ideal moment to the slaughter part of the herd, aiming to maximize the producer profits and minimize the time of the animal growth.
The fact that the cattle gain certain value in arrobas and calculate the percentage of gain for sale is an important study. After this study, the researchers of agribusiness may verify the profitability of the fact, and will depend on what type of cattle management methods and weight gain.
ACKNOWLEDGMENTS
The authors are grateful to the CNPq (National Counsel of Technological and Scientific Development) by the assistance by the granted scholarship of Scientific Initiation (PIBIT/UNESP) and scholarships for Research Productivity (RP) (Process: 306964/2014-7).
REFERENCES
ÁLVAREZ, A.J.; OLIVA, R. M.; VALERA, D. L. Software for the geometric characterisation of insect-proof screens. Computers and Electronics in Agriculture, Amsterdam, v.82, p.134-1444, 2012.
ANUALPEC: anuário da pecuária brasileira. São Paulo: Instituto FNP, 2009.
BROWNE, M. F.; HALL, J. B.; DIETZ, R. E. Body condition scoring beef cows. Virginia Cooperative Extension, 2000.
CAMPOS, A. T.; CASTRO, J. O.; SCHIASSI, L.; JUNIOR, T. Y.; PIRES, M. F. Á.; MATTIOLI, C. C.Prediction of free-stall occupancy rate in dairycattle barns through fuzzy sets. Engenharia Agrícola, Jaboticabal, v.33, n.6, p. 1079-1089, 2013.
CANEPPELE, F. L.; SERAPHIM, O. J.; GABRIEL FILHO, L. R. A.; CREMASCO, C. P.; SAVI, A. F. Gains obtained in hybrid systems of energy generation solar photovoltaic and wind power for rural electrification with the use of fuzzy logic controllers based. Scientific Journal Agricultural Engineering, Belgrado-Sérvia, v.28, n.2, p.35-44, 2013.
CAPPELLI, G.; BREGAGLIO, S.; ROMANI, M.; FECCIA, S.; CONFALONIERI, R. A software component implementing a library of models for the simulation of pre-harvest rice grain quality.
Computers and Electronics in Agriculture, Amsterdam, v.104, p.18-24, 2015.
CHACUR, M. G. M., MIZUSAKI, K. T, GABRIEL FILHO, L. R. A., OBA, E., RAMOS, A. A. Seasonal Effects on Semen and Testosterone in Zebu and Taurine Bulls. Acta Scientiae
Veterinariae, Porto Alegre, v.41, p.1-5, 2013.
CHACUR, M. G. M.; MIZUSAKI, K. T; SANTOS, F. H.; CESARE, A. G.; GABRIEL FILHO, L. R. A.; OBA, E.; RAMOS, A. A. Influência da estação do ano nas características do sêmen e na concentração de hormônios em touros Nelore e Simental. Arquivo Brasileiro de Medicina Veterinária e Zootecnia, Belo Horizonte, v.64, p.540 - 546, 2012.
COLAZO M. G.; KASTELIC, J. P. Reproductive management in cattle and sheep. Encyclopedia of Life Support Systems (EOLSS.2012). Disponível em:
http://www.eolss.net/Sample-Chapters/C10/E5-15-20-08.pdf. Acesso em: 15 jun. 2015.
FAULKNER, D. B. Body condition scoring beef cows. In: WINTER BEEF MEETINGS, 1989– 1990. Proceedings… Urbana-Champaign: Department of Animal Sciences, 1990. p. 11-16.
GABRIEL FILHO, L. R. A.; CREMASCO, C. P.; PUTTI, F. F.; CHACUR, M. G. M. Application of fuzzy logic for the evaluation of livestock slaughtering. Engenharia Agrícola, Jaboticabal, v. 31, p. 813-825, 2011a.
GABRIEL FILHO, L. R. A.; PEREIRA, D. F.; BARATO, F. F.; MAGALHÃES, M. M. Method of numerical correction of errors occasioned by delay of records during the monitoring of
environmental variables of interest for animal production. Engenharia Agrícola, Jaboticabal, v.31, p.835 - 846, 2011b.
GABRIEL FILHO, L. R. A.; PIGATTO, G. A. S.; LOURENZANI, A. E. B. S. Fuzzy rule-based system for evaluation of uncertainty transaction in cassava chain. Engenharia Agrícola,
Jaboticabal, v. 35, n. 2, p. 350-367, 2015.
GARCIA, A. P.; CAPPELLI, N. L.; UMEZU, C. K. Electrically driven fertilizer applicator controlled by fuzzy logic. Engenharia Agrícola, Jaboticabal, v.34, n.3, p. 510-522, 2014. KLIR, G. J; YUAN, B. Fuzzy sets and fuzzy logic theory and applications. New Jersey: Prentice-Hall PTR, 1995.
LABABIDI, H. M. S.; BAKER, C. G. J. Fuzzy modeling. In: SABLANI, S.S.; DATTA, A.K.;
REHMAN, M.S.; MUJUMDAR, A.S. (Ed.) Handbook of food and bioprocess modeling techniques. New York: CRC Press, 2006. P.451-457.
LARDY, R.; BELLOCCHI, G.; MARTIN, R. Vuln-Indices: Software to assess vulnerability to climate change. Computers and Electronics in Agriculture, Amsterdan, v.114, p.55-57, 2015. MASSAD, E.; ORTEGA, N. R. S.; BARROS, L. C.; STRUCHINER, C. J. Fuzzy logic in action: applications in epidemiology and Beyond (Studies in Fuzziness and Soft Computing). Berlin: Springer-Verlag, 2008.
MATH WORKS. MATLAB reference guide. Natick, 2014. MINITAB User`s Guide Release 16 for Windows, 2014.
MOLLO NETO, M.; NAAS, I. A.; CARVALHO, V. C.; CONCEICAO, A. H. Q. Preventive diagnosis of dairy cow lameness. Engenharia Agrícola, Jaboticabal, v.34, n.3, p. 577-589, 2014. MONTIEL, F.; AHUJA, C. Body condition and suckling as factors influencing the duration of postpartum anestrus in cattle. Animal Reproduction Science, Amsterdam, v. 85, p. 1-26, 2005. NASCIMENTO, G. R.; PEREIRA, D. F.; NAAS, I. A.; RODRIGUES, L. H. A. Índice fuzzy de conforto térmico para frangos de corte. Engenharia Agrícola, Jaboticabal, v.31, n.2, p. 219-229, 2011.
NIKKILÄ, R.; SEILONEN, I.; KOSKINEN, K. Software architecture for farm management information systems in precision agriculture. Computers and Electronics in Agriculture, Amsterdam, v.70, p.328-336, 2010.
PECUÁRIA. Disponível em: http://www.pecuaria.com.br/cotacoes.php. Acesso em: 10 jun. 2015 PEREIRA, D. F.; BIGHI, C. A.; GABRIEL FILHO, L. R. A.; CREMASCO, C. P. C. System fuzzy
for estimate of welfare of broiler breeders. Engenharia Agrícola, Jaboticabal, v.28, p. 624-634,
2008.
PONCIANO, P. F.; JUNIOR, T. Y.; SCHIASSI, L.; CAMPOS, A. T.; NASCIMENTO, J. W. B. Sistema fuzzy para predição do desempenho produtivo de frangos de corte de 1 a 21 dias de idade.
Engenharia Agrícola, Jaboticabal, v. 32, n. 3, p. 219-229, 2012.
REZENDE, F. M.; FERRAZ, J. B. S.; ELER, J. P; SILVA, R. C. G.; MATTOS, E. C.; IBÁÑEZ-ESCRICHE, N. Study of using marker assisted selection on a beef cattle breeding program by model comparison. Animal Reproduction Science, Amsterdam, v.147, p. 40-48, 2012.
ROCHE, J. F. The effect of nutritional management of the dairy cow on reproductive efficiency.
ERRATA
No artigo “SOFTWARE TO ASSESS BEEF CATTLE BODY MASS THROUGH THE FUZZY BODY MASS INDEX”, com número de DOI: 10.1590/1809
-4430-Eng.Agric.v36n1p179-193/2016, publicado no periódico revista Engenharia Agrícola 36 (1):179-193, na página 179:
Onde se lia:
SOFTWARE TO ASSESS BEEF CATTLE BODY MASS THROUGH THE FUZZY BODY MASS INDEX
Leia-se:
SOFTWARE TO ASSESS BEEF CATTLE BODY MASS THROUGH THE FUZZY BODY
MASS INDEX1
Onde se lia:
LUÍS R. A. GABRIEL FILHO1, FERNANDO F. PUTTI2, CAMILA P. CREMASCO3,
DEYVER BORDIN4, MARCELO G. M. CHACUR5, LUIZ R. A. GABRIEL6
Leia-se:
LUÍS R. A. GABRIEL FILHO2, FERNANDO F. PUTTI3, CAMILA P. CREMASCO4,
DEYVER BORDIN5, MARCELO G. M. CHACUR6, LUIZ R. A. GABRIEL7
Onde se lia:
_________________________
1 Graduado, Mestre e Livre-Docente em Matemática, Doutor em Agronomia, Prof. Adjunto, Faculdade de Ciências e Engenharia, UNESP - Univ Estadual Paulista, Laboratório de Matemática Aplicada e Computacional, Tupã - SP, Fone: (14) 3404-4200, [email protected]
2 Bacharel em Administração, Mestre e Doutor em Agronomia, Prof. Assistente Doutor, Faculdade de Ciências e Engenharia, UNESP - Univ Estadual Paulista, Tupã - SP; UNIFENAS - Univ José do Rosário Vellano, Alfenas - MG,
3 Graduada e Mestre em Matemática, Doutora em Agronomia, Prof. Assistente Doutor, Faculdade de Ciências e Engenharia, UNESP- Univ Estadual Paulista, Tupã - SP, [email protected]
4 Bacharel em Administração, Tecnólogo em Análise e Desenvolvimento de Sistemas, Mestre em Agronegócio e Desenvolvimento, Doutorando em Agronomia, [email protected]
5 Médico Veterinário, Prof. Doutor, UNOESTE – Univ do Oeste Paulista, Presidente Prudente - SP, [email protected] 6 Graduado, Mestre e Livre-Docente em Matemática, Doutor em Agronomia. [email protected]
Recebido pelo Conselho Editorial em: 27-6-2014 Aprovado pelo Conselho Editorial em: 09-7-2015
Leia-se:
_________________________
1 Partes deste trabalho foram apresentadas no XLI Congresso Brasileiro de Engenharia Agrícola, XXXIV Congresso Nacional de Matemática Aplicada e Computacional, I Simpósio Brasileiro de Pecuária de Precisão Aplicada a Bovinocultura de Corte e XX Jornadas de Jovenes Investigadores da Asociacion de Universidades Grupo Montevideo.
2 Graduado, Mestre e Livre-Docente em Matemática, Doutor em Agronomia, Prof. Adjunto, Faculdade de Ciências e Engenharia, UNESP - Univ Estadual Paulista, Tupã - SP, Fone: (14) 3404-4200, [email protected]
3 Bacharel em Administração, Doutor em Agronomia, Prof. Assistente Doutor, Faculdade de Ciências e Engenharia, UNESP - Univ Estadual Paulista, Tupã - SP; UNIFENAS - Univ José do Rosário Vellano, Alfenas - MG, [email protected]
4 Graduada e Mestre em Matemática, Doutora em Agronomia, Prof. Assistente Doutor, Faculdade de Ciências e Engenharia, UNESP- Univ Estadual Paulista, Tupã - SP, [email protected]
5 Bacharel em Administração, Tecnólogo em Análise e Desenvolvimento de Sistemas, Mestre em Agronegócio e Desenvolvimento, Doutorando em Agronomia, [email protected]
6 Médico Veterinário, Prof. Doutor, UNOESTE – Univ do Oeste Paulista, Presidente Prudente - SP, [email protected] 7 Graduado, Mestre e Livre-Docente em Matemática, Doutor em Agronomia, [email protected]
Recebido pelo Conselho Editorial em: 27-6-2014 Aprovado pelo Conselho Editorial em: 09-7-2015
Eng. Agríc., Jaboticabal, v.36, n.1, p.179-193, jan./fev. 2016
Na página 184, onde se lia:
Leia – se