D im e n sion a n d Book - t o- M a r k e t Ra t io Aga in
Th e En glish Ca se
Pedro Rino Vieira
I SEG – Technical Universit y of Lisbon [email protected] l.pt
José Azevedo Pereira
I SEG – Technical Universit y of Lisbon j [email protected] l.pt
W ORKI N G PAPER N . 5 / 2 0 0 6
Sept em ber 2006
Abst r a ct
Using t he Fam a- French Model ( 1993) Daniel and Tit m an ( 1997) show t hat size and book-t o- m arkebook-t effecbook-t s cannobook-t be undersbook-t ood as disbook-t ress facbook-t or proxies, bubook-t as characbook-t erisbook-t ics t hat explain t he cross sect ion variat ion in st ock ret urns. Davis et al. ( 2000) refut e t hese result s using a different set of dat a. While addressing t his quest ion, w e have found unexpect ed evidence against t he Fam a- French Model in t he UK m arket and challenging result s regarding t he size and book- t o- m arket effect s in bot h t he UK and USA. Our findings, at t he very least , suggest a bad CAPM specificat ion and, at m ost , suggest t hat financial m arket s are not efficient .
Ke y w or ds: Behavioural Finance, Size Effect , Book- t o- Market Effect , CAPM, Efficient Market Hypot hesis, Financial I nvest m ent s
JEL Cla ssifica t ion: G12, G14
Mainstream finance advocates that financial markets are efficient and their investors fully rational in
the Efficient Markets Hypothesis (EMH) sense. Being fully rational means two things. In the first
place, investors accurately and continuously update in their decision decision-making framework on
the basis of new data made available in the market. Secondly, given this updated setting, investors try
to take the best decisions in order to maximize their utility. This is a simple and appealing vision of the
world that is particularly useful in theoretical modelling exercises. Unfortunately it is only half the
story, as recent work from neurobiology tells us (Damásio, 2003). Actually, Damásio explains that
human beings have two complementary ways of making decisions. Way A, the fully rational one,
leads to some mental images being projected in our minds, such as options for action and their future
consequences. Based on these images we come out with a decision through different reasoning
strategies. However, at the same time, we recall ancient emotional memories lived in similar
situations, which is way B. This recall, conscious or not, influences our decision making process
conditioning our analysis of the situation. If a decision made in a previous situation has provoked
some pleasant outcomes and feelings, in a similar current situation we will tend to make a decision
without comprehensive rational reasoning that takes into account the differences of the new context. If
the framework has changed, most likely the decision taken will not be the best or the same as that we
would reach using the rational way alone. Most likely, phenomena such as representativeness,
anchoring or availability biases found by Kahneman and Tversky (1974) are the result of this way B
(Damásio, 1974).
This, and further research on psychology1 raises, at least, profound doubts about the hypothesis that
investors are fully rational and the market is efficient in any of the three forms considered by Fama
(1970). So, it can be expected that EMH models, namely the Sharpe-Lintner-Black (SLB) or Capital
1 For example Alpert and Raiffa (1982), Fischhoff et al. (1977), Buehler et al. (1994), Kahneman and
Asset Pricing Model (CAPM) [Sharpe (1964), Lintner (1965) and Black (1972)], do not apply
properly to real world situations. Not surprisingly several Behavioural Finance researchers have found
several anomalies in the CAPM. Banz (1981) found that shares issued by big firms tend to produce
lower returns than shares issued by small companies. Keim (1983) confirmed this result. This is the
size effect. Basu (1983) analyzed the relationship between earnings’ yield, market value and return for
NYSE common stocks. He confirmed the size effect and found that shares issued by firms with higher
earnings’ yield have had higher returns. De Bondt and Thaler (1985, 1987), in a more behavioural
study, discovered that most people “overreact” to unexpected and dramatic news events in such a way
that, in the long term, portfolios of prior “losers” are found to outperform prior “winners”. Jegadeesh
and Titman (1993) analyzed this same question, finding that in the short term, prior “winners” are still
“winners” and prior “losers” are still “losers”. Rosenberg et al. (1985) discovered that average returns
on U.S. stocks are positively related to the book-to-market ratio. Bhandari (1988) documented a
positive relation between leverage and average return.
All these results that have challenged the SLB model might have two meanings. One possibility is a
misspecification of the SLB model, which can be addressed with a more sophisticated one, perhaps
with a multi-factor model based on the work of Merton (1973) and Ross (1976). Another and more
radical possibility is to assume that those results imply the inefficiency of the financial markets, which
sounds appealing under the Behavioural Finance approach. To address this issue, Fama and French
(1992, 1996) examined all these variables and concluded that the cross-sectional variation in expected
returns can be explained by size and book-to-market, while β, the traditional SLB model measure of
risk fails to explain the return dispersion. Fama and French (1993) defend that if higher returns are
compensation for higher systematic risk then the book-to-market and size are proxies for distress and
distressed firms are riskier because they are more sensitive to certain business cycle factors. So, the
EMH still applies, even if the SLB model suffers from misspecification. Fama and French (1993) run
several tests that support their claims. First they show that prices of high book-to-market and small
size stocks tend to move in a way that supports the idea of a common risk factor. Secondly, they
developed a multi-factor model in the sense of Merton (1973) and Ross (1976) with three factors that
(1) size (a small capitalization portfolio minus big capitalization portfolio they called SMB); (2)
book-to-market ratio (a high book-book-to-market portfolio minus a low book-book-to-market portfolio they called
HML); (3) value-weighted market portfolio (Rm). The Fama-French model is:
(
R
R
)
s
SMB
h
HML
b
R
R
i−
f=
i m−
f+
i+
i (1)Fama and French (1993) support the EMH, but cannot explain the economic role of size and
book-to-market. They state that size and book-to-market are proxies of risk, but they cannot detail this
relationship or describe the specific kind of risk that is measured.
Under the Behavioural Finance paradigm and taking into account the teachings of neurobiology and
psychology we might want to consider different explanations. Lakonishok et al. (1994) suggest some
investors tend to get overly excited about stocks that have done very well in the past and buy them up,
so that these “glamour” stocks become overpriced. At the same time, they overreact to stocks that have
done very badly, overselling these “value” or high book-to-market stocks and they become
underpriced. So, strategies that invest disproportionately in these underpriced stocks and underinvest
in stocks that are overpriced outperform the market, even when those are not fundamentally riskier.
This explanation challenges the EMH, but does not deny a relation between systematic risk and return
or the supposition that the return premium of high book-to-market and small size stocks can be
explained by a factor model. However, we can ask a more fundamental question: are the return
patterns of characteristic-sorted portfolios really consistent with a factor model at all? This question
was raised by Daniel and Titman (1997), who wanted to know whether the high returns of high
book-to-market and small size stocks can be attributed to their factor loadings. In short, Daniel and Titman
(1997) question if relative distress drives stock returns and if book-to-market is a proxy for relative
distress. The underlying idea is that low book-to-market (strong firms) produce low stock returns and
high book-to-market stocks (distressed firms) have high returns, regardless of risk loading.
Their results indicate that (1) there is no discernible separate risk factor associated with high or low
book-to-market firms, and (2) there is no return premium associated with any of the three factors
identified by Fama and French (1993), suggesting that the high returns related to these portfolios
book-to-market stocks do covary strongly with other high book-to-book-to-market stocks, the covariances do not result
from there being particular risks associated with distress, but rather reflect the fact that high
book-to-market firms tend to have similar properties.
Responding to this study, Davis et al. (2000) use a different approach for a much longer time period.
While Daniel and Titman study returns from July 1973 to December 1993, Fama and French use data
from July 1929 to June 1997. They confirm Daniel and Titman’s results for the 1973-1993 period of
time. However, when they use the entire sample the empirical evidence supports the Fama-French
Model. Once again we have contradictory results. In this case, we have the same phenomenon but
studied with different methodologies and samples, which might weaken the findings, since a good
model should apply in all situations (Kothari et al., 1995).
In summary, there is an open debate centered on whether these factors can possibly represent relevant
aggregate risk. In this article, while readdressing this question we have found unexpected and
surprising results. We found evidence that (1) the book-to-market effect is different between the
British and American samples, (2) in the USA sample, the relationship between returns and volatility
is negative (higher returns are associated to lower volatility and thus lower risk), (3) the market factor
of the Fama-French model is the only one able to explain the UK firms’ returns and (4) size effect and
book-to-market are strongly correlated.
In Section I we present the data. In Section II we characterize and re-analyze the size and
book-to-market effects in the UK and USA, comparing the results and calculating the correlation between size
and book-to-market. In Section III we analyze the Fama-French model and the variables used by them,
including their excess return explanatory power. We also calculate the correlation between SMB and
HML. In Section IV we present the main conclusions of our work.
I Data
The London Stock Exchange sub-sample data used in this study was retrieved from DataStream and
covers the period from December 1982 to June 2002. It includes all firms that have been listed for at
least two years in the Worldscope UK 2003 database and have prices available in both December of
year, the number of stocks analyzed in each year varies along the period. We considered 887 firms in
the first year and 1892 in the last one. The average number of firms listed is each year is 1478. The
book-to-market ratio (BE/ME) and market equity (ME) were then used to form the portfolios from
July of t through June of Year t+1. According to Fama and French (1993), the end of June is used as
the portfolio formation date to guarantee that the book-equity value for year t-1 is public information.
All firms with non-positive book-equity have been excluded. The market value is defined as the
number of shares outstanding times the share price. The number of shares outstanding is updated when
new stock is issued or when it changes (e.g. stock split). The book-equity value is calculated as the
fixed assets less intangible assets minus total debt, minority interests and preferred stock.
Within each year, we ranked all stocks in the sample based on their book-to-market ratio at the end of
year t-1. Given these rankings the sample was divided into five quintiles. Next, the stocks were
re-ranked in accordance with their market-equity value at the end of June of year t and divided into five
new quintiles. This way, each stock belongs simultaneously to a certain BE/ME quintile and a ME
quintile. The matching of these two sets of quintiles allowed the creation of 25 portfolios per year. For
each portfolio we computed the weighted-average return. To calculate the return rate, we considered
the adjusted price of the last day of the month. Then we computed the monthly market return as the
weighted-average return of all firms listed in the considered month. The risk free return rate used is the
English three-month T-Bill return.
For the Fama-French model study, we followed the Fama and French work (1993) and formed six new
portfolios based on the intersection of the three book-to-market categories (High, Medium and Low
with breakpoints at 30% and 70%) and two size categories (Small and Big with breakpoint at 50%).
These portfolios are designated LS, MS, HS, LB, MB and HB. With these we formed two new
portfolios to capture the book-to-market and size effect, as proposed by Fama and French (1993). The
first portfolio is the SMB (small minus big) that captures the size effect and is the difference between
the return of large and small firms with similar book-to-market. It was calculated as the simple
average of LS, MS and HS returns minus the simple average of LB, MB and HB returns. The second
portfolio is the HML (high minus low) and captures the book-to-market effect. It is the difference
II The size and book-to-market effects
Following the work of Daniel and Titman (1997) we first analyzed the size and book-to-market effects
in the English market. The results summarized in Table 1 confirm the size effect found in the
American sample. Actually, smaller firms show a monthly return 1.3% higher than bigger firms,
showing also higher risk measured by the standard deviation (differential of 5.37%). The return
premium does not seem too high for this risk level, although this question is not directly addressed
here. The first unexpected result is related to book-to-market. The results suggest that there is no
BE/ME effect in the UK, since no linear relationship was found between return and book-to-market.
These results are statistically significant (t-statistics above 3 to size effect and 5 to BE/ME effect).
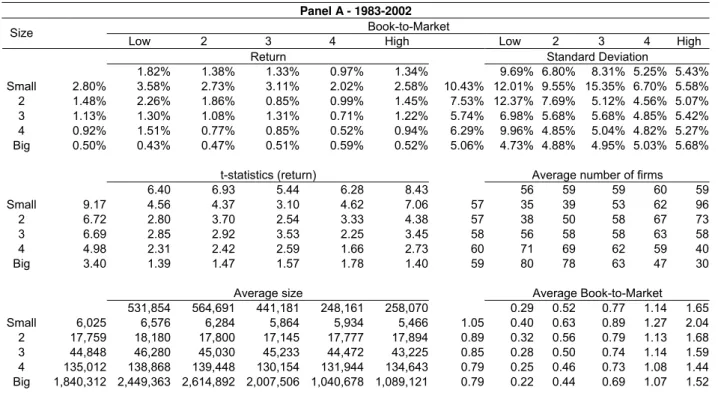
Table 1 – Descriptive statistics of the 25 portfolios - UK
Taking into account that the size and book-to-market effects were first reported in the eighties and that
people are not totally rational and use short-cuts in their decision-making processes, we might expect
to find a change in investor behaviour related to a different understanding and usage of
book-to-market ratios. Therefore, the period under study was divided into two smaller periods of ten and nine
years respectively. The first goes from July 1983 to June 1993 (first decade) and the second from July
1993 to June 2002 (second decade). Panel B of Table 1 shows that, in the first decade, the results are
still surprising. Comparing the extreme portfolios we verify a book-to-market effect, but when we
consider the intermediate portfolios, no relationship could be established. Apparently there is no
relationship between risk and return. The size effect is verified in the first decade, although without a
full linear relation between return and risk. In the second decade, the book-to-market effect has
reversed with firms with low BE/ME showing higher returns than firms with high BE/ME (1.58%
higher). Once again, the relationship between risk and return is not totally linear, but tends towards the
expected behaviour from a rational perspective. So, the risk profile of these companies has changed
and then the return profile has also changed, but not the book-to-market, which is really striking. What
phenomenon might explain this modification? Why are firms with high book-to-market now more
Quintiles allow the analysis to be fine tuned, but may hide some general trends. Consequently, the
same analysis was performed on the Fama-French portfolios. Table 2 shows the results, which are
similar but not the same. Size effect is confirmed. Across the period the reversal in the book-to-market
effect seems to be confirmed (lower BE/ME firms earn a monthly higher return of 0.25%).
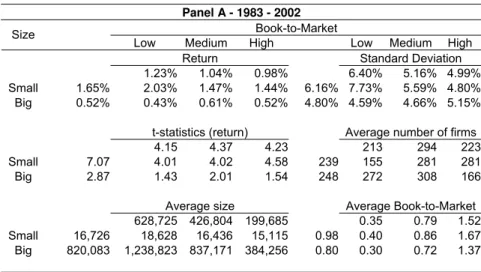
Table 2 – Descriptive statistics of the Fama-French portfolios - UK
However, in the first decade, the BE/ME shows the expected behaviour with a monthly return
premium of 0.45% associated with higher BE/ME firms. However, in the second one, the results have
reversed. Firms with lower BE/ME earn a monthly return premium of 0.9%. These results are
statistically significant, but not as strong as those obtained with the use of 25 portfolios. The usage of
these two different sets of portfolios does not alter the main conclusions in the period considered, but
it seems that some kinds of portfolio are more appropriate to illustrate certain results than others.
These results apply to the UK market and contradict the findings reported for the United States.
Nevertheless, these different studies use samples that cover different time periods. We therefore
extended our analysis to the US market with a sample that covers the Amex, Nasdaq and NYSE (Table
3). During the overall period, as well as in each decade, the BE/ME effect is as expected and the
results are statistically significant. What is odd is the size effect. The biggest firms with lower
market have higher returns than small firms with lower BE/ME, but small firms with high
book-to-market have higher returns than big firms with high BE/ME. Thus, the evidence from the complete
sample does not support size effect. Also interesting is that in the first decade we can observe a size
effect that is the opposite of what could be expected, and, in the second decade, the size effect
corresponds to expectations. The major surprise is, however, the relationship between return and
volatility. In the BE/ME portfolios, the stocks with lower returns show consistently higher volatility in
all time periods considered. In the size portfolios this relation is not clear. During the first decade, a
negative relationship was found and by contrast, in the second decade, we found a positive
relationship, as would be expected by the EMH. If volatility measures risk and the data are good, these
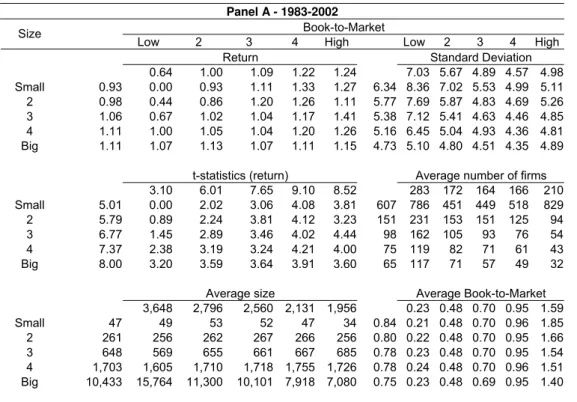
Table 3 – Descriptive statistics of the 25 portfolios - USA
As done for the LSE, we also studied the Fama-French portfolios in the USA. Table 4 summarizes the
results, which are similar to those observed in the 25 portfolio analysis. Firms with higher BE/ME
show consistently higher returns and lower volatility than firms with lower BE/ME. Size effects still
exhibit contrary behaviour from one decade to the next. Big firms show higher returns in the first
decade and small firms have higher returns in decade two. In all periods of time, small companies with
lower BE/ME presented lower volatility, independently of their returns.
Table 4 – Descriptive statistics of the Fama-French portfolios - USA
This relation between return and volatility is a puzzle and challenges the EMH. It just seems that risk
is not relevant in investment decisions any more, although these results could be spurious. Size effect
and book-to-market measure different things, but have one common variable: market equity, which
means that these two effects are correlated. This correlation might provoke some unexpected results.
To study correlation the natural logarithm of ME and BE/ME is used following Fama and French
(1992), since in this way we can better capture the underlying effects. Table 5 shows the existence of a
negative correlation between size and book-to-market (-0.299 across the period). This correlation is
not extreme, but it might be enough to destroy their ability to together explain the cross section
returns. When we analyze the 25 portfolios, the correlation seems to be stronger, about 0.5, meaning
that these two variables are highly correlated. Multi-factor models like the Fama-French might loose
explanatory power due to this high correlation.
Table 5 – Annual correlations between size and BE/ME
Table 6 – Annual correlations between size and BE/ME for the 25 portfolios
III The Fama-French Model
From the previous discussion we know that the BE/ME effect in UK exhibits strange behaviour when
compared with the expected results. Its relation with volatility is, at the very least, peculiar, and the
correlation between market value and book-to-market ratio is considerable, although not extreme.
These results have obvious consequences for the Fama-French model. If the variables are correlated
volatility discovered in this sample were verified in n different samples of the same universe, then size
and book-to-market could not be risk proxies. Thus, the Fama-French model seems to be in trouble.
Therefore, instead of following our intended path, it was necessary to test the model for the UK. The
results are as follows:
To test the model we ran the regression
i i
i f m i i f
i
R
a
b
R
R
s
SMB
h
HML
R
−
=
+
(
−
)
+
+
+
ε
(2)However, first we described the model variables shown in Table 7. For the portfolios SMB and HML
the data confirms the previous results obtained in relation to dimension and book-to-market, in each
period considered. As expected, the factor risk of market β has a positive premium. Each factor
average has a strong statistical significance as measured by one sample t-test. However, there is one
worrying result: the correlation between dimension and book-to-market is stronger when the portfolios
SMB and HML are used. Across the period the correlation is -0.596 with statistical significance at the
0.01 level. In the second decade, the correlation is -0.750 with the same statistical significance, which
is high and unexpected. However, no correlation was detected in the first decade. The correlation
between SMB and HML on the one hand and Rm-Rf on the other is not significant in any periods.
However, the correlation between SMB and Rm-Rf in the first decade is relevant. This result confirms
the findings of Fama and French (1992, 1993).
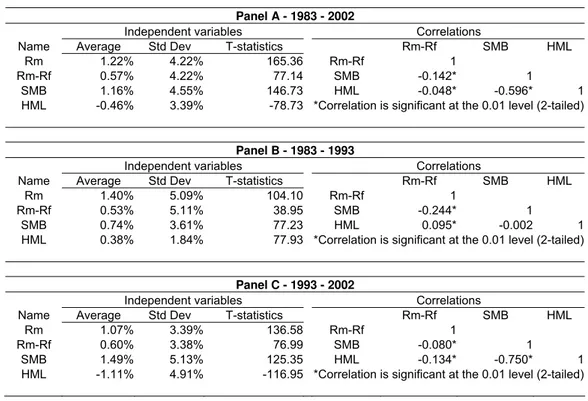
Table 7 – Description of Fama-French model variables
As in the previous section, here we also analyze the correlation for each of the 25 portfolios. The
results are in Table 8 and show that during the entire period the correlation is usually above 0.5, which
is an important correlation level. However, analyzing each decade, we found some interesting results.
Just as Fama and French (1993) argued, the usage of HML and SMB substantially reduces the
correlation between ME and BE/ME in the first decade. In the second decade, HML and SMB are
strongly correlated. Once again, we have to ask what might have provoked these unexpected changes
Table 8 – Correlation between HML and SMB for the 25 portfolios
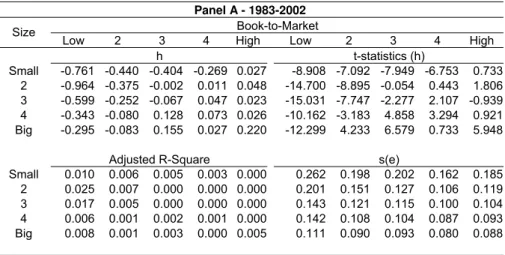
These results promise to raise autocorrelation problems in the OLS regression with HML and SMB as
independent variables. This is so, as shown in Table 9. The regressions have statistical significance
(test F, not reported here) and each independent variable can explain the returns reported, even if only
to a very low degree. Actually the adjusted R-square assumes a considerably low level, failing to
confirm previous evidence (Fama and French, 1993, 1996). However, this low adjusted R-square is
not totally unexpected if one considers that this model has a very strong sectional component. What is
problematic is the positive slope of both factors, which associated with the high correlation level
between SMB and HML, suggests notorious problems of autocorrelation. Note that the HML slope
should be negative in the second decade and when the entire sample is used.
Table 9 - Regression Ri-Rf=ai+hiHML+siSMB+εi
Associated as independent variables HML and SMB cause technical problems, but what happens when
they are considered alone? Table 10 summarizes the results of a regression with HML as a unique
independent variable. In each and every sample used, the regressions are statistically strong and the
slope is as expected: erratic over the period; positive in the first decade, reflecting the positive relation
between returns and BE/ME; and negative in the second decade as the return-BE/ME relation became
negative in this last period. The relation with risk is linear and as expected, but may not be enough to
explain the earnings difference, although this question is not directly addressed here. Once again, the
adjusted R-square is quite low, making the BE/ME almost irrelevant as an explanatory variable of
return. Table 11 reports the results of the factor SMB regression. When we considered the SMB alone
it presented the expected behaviour (positive slope). Smaller firms had a higher risk premium when
compared with bigger firms. This result is statistically significant. The relationship between risk and
return tends towards linearity. Again, we cannot say if the return premium is or is not appropriate to
compensate for the different risk levels. The adjusted R-square is very low, but higher than the HML
Table 10 – Regression Ri-Rf=ai+hiHML+εi
Table 11 – Regression Ri-Rf=ai+siSMB+εi
If the HML and SMB are of lesser importance in terms of their capacity for explaining returns, what
about the market factor? Will it also be irrelevant, or perhaps it will be relevant but not as important as
predicted in the SLB model? To answer this question we ran a regression of excess firm return on the
market risk premium, using a model similar to the Fama-MacBeth Model (1983). The results are in
Table 12 and are the more significant in statistical terms (highest t and F statistics). The factor has a
positive slope and is usually higher in the portfolios with highest returns. This effect is consistent
across the entire period of time. Although erratic, the adjusted R-square is considerably higher than in
the other factors, thus the market factor has, indeed, more explanatory potential, particularly in the
portfolios with bigger and higher book-to-market firms. Nevertheless, it is still insufficient to fully
explain the excess return of common stock. At most, it explains 43.2% of the risk premium (portfolio
with size Big and BE/ME quintile 4 in decade 1. Another interesting point is that the β has stronger
explanatory ability in decade 1 than in decade 2. In certain cases the capacity has decreased by 20%
(portfolios with big size and BE/ME less than 5). What can explain these changes?
These results challenge the Fama-French model, since its explanatory capacity in the UK seems to be
quite inferior to that reported by Fama and French (1993, 1996) and SMB and HML seem to be
strongly correlated. Nevertheless, we tested the model, and the results are presented in Table 13. As
expected, the results provide evidence on the autocorrelation already reported. The HML factor when
analyzed together with SMB presents positive slopes, what does not correspond to the relation
between HML and excess return. Thus, the Fama-French model seems to be affected by an
autocorrelation problem in the UK market. If so, we should rethink the meaning of dimension and
BE/ME and we cannot test if they are risk proxies or characteristics that cannot be associated with a
specific risk profile.
Table 12 – Regression Ri-Rf=ai+bi(Rm-Rf)+εi
Table 13 – Regression Ri-Rf=ai+bi(Rm-Rf)+hiHML+siSMB+εi
This model appears not to work due to the strong correlation between SMB and HML. If this is the
more consistent behaviour through the time period and reveals higher capability to explain excess
returns than HML (the adjusted R-square tends to be higher), we chose to keep the SMB factor in the
model. Therefore, we ran a regression on:
i i
f m i i f
i
R
a
b
R
R
s
SMB
R
−
=
+
(
−
)
+
+
ε
(3)The results of the new regression are summarized in Table 14. Without the perverse effects of
autocorrelation, we can conduct a more comprehensive analysis of the tested model. In each studied
period we find similar results with an important exception: the model has a powerful explanatory
capacity in the first decade, which is not that surprising if we take into account the previous evidence.
Actually, this first period shows results close to those expected by the literature. It is consistently in
the second decade that the results are unexpected and unforeseen.
Table 14 – Regression Ri-Rf=ai+bi(Rm-Rf)+siSMB+εi
In all portfolios and periods of time the market factor presents similar values statistically no different
than 0.85, which supports the finding reported by Fama and French (1993). Thus, the market premium
risk seems to compensate for a systematic risk factor common to all firms. This interpretation is
consistent with the EMH and the multi-factor models of Merton (1973) and Ross (1976). The factor
SMB shows very regular behaviour, with higher loadings in smaller firms and lower loadings in bigger
firms, in an almost linear relation across different size quintiles for each BE/ME quintile.
The adjusted R-square suggests (1) that model 3 is as able to explain the excess returns as model 2 and
(2) these two variables are still insufficient to provide a comprehensive and full explanation of excess
returns. The unexplained and unconsidered factors should have been captured by the intersections of
Fama-French Model and the SMB model tested here. Table 15 shows the intersections and
correspondent t statistic for the 25 portfolios in each period of time. As expected, the intersections are
significantly different from zero in both portfolios. Also as expected, the intersections are lower and
less statistically significant in the first decade than in the second one.
Our findings show that the Fama-French model does not apply in UK, meaning that our initial project
cannot be pursued. However, interesting evidence has been found that requires some reflection. It is
Table 15 – Regression Interception
IV Conclusions
The results are quite unexpected. We have found that:
• In the UK, the book-to-market effect is the opposite of the one verified in the USA;
• In the American sample, there is a negative correlation between return and volatility (higher
returns associated to lower volatility);
• In the English sample, the Fama-French model does not apply. The market factor is unique
and is the only one with a good ability to explain excess returns; and
• Size effect and book-to-market are strongly correlated in the UK sample.
Thus, the results suggest there are important differences between the English and the American
markets. One possible cause is a biased sample (Banz and Breen, 1986 and Kothari et al. 1995). In this
study, there are some structural differences in the portfolio composition of both sets of portfolios
between the UK sample and the USA sample (see Table 16 and Table 17). The market value and book
value computation are similar to the Fama-French (1992, 1996, 2000) and Daniel and Titman (1997)
one, but not exactly the same. These differences in data and methodology might explain the findings.
In the UK, the firm distribution by quintiles is approximately uniform, which does not happen in the
USA sample where 60% of the firms are in the first size quintile. Similarly, the first and last BE/ME
quintiles are those with higher number of firms (28% in the first quintile and 21% in the fifth quintile).
These differences might explain, to a certain extent, the different results.
However, our conclusions may not be so surprising considering that Kothari et al. (1995), with a
different sample, report there is a weak relationship between BE/ME and excess return, and that the β
properly measures the relation between return and risk premium, as long as the β is calculated on an
annual basis. These findings, similar to ours, raise the question of possible data mining. This question
is also addressed by Conrad et al. (2003, pp. 1969). These authors suggest that the methodologies
developed to explore CAPM weaknesses and our familiarity with the data might explain up to 50% of
the in-sample relation between firm characteristics and returns uncovered using single (one-way) sorts.
In this case, we are so extremely familiarized with the USA data that we might have used data in such
a way as to help us support certain desired conclusions. In the UK, this does not happen, once the data
are less well known. We believe that our work does not suffer from this bias because we have used
American methodologies with an English sample. Thus, our results should be more impartial.
Table 16 – Structure of the 25 portfolios
Table 17 – Fama-French portfolios
Moreover, there is one set of results that cannot be explained this way: the difference between the two
decades, which is the most striking finding. In the first decade, the results correspond to what would
be expected, in line with other evidence reported throughout the paper. However, in the second decade
something has changed in an unanticipated way, allowing an opposite book-to-market effect.
However, if BE/ME is a risk proxy, when we study this effect we are, actually, analyzing the relation
between risk and return, using book-to-market as an intermediate that represents risk. So, a real change
in the BE/ME effect implies a different relation between BE/ME and risk. If volatility is a measure of
risk, than what really changed in the second decade was the relation between return and risk/volatility,
not the one between BE/ME and volatility. So, the BE/ME effect is the same, but the risk profile has
changed. Thus, this seems to confirm BE/ME as a risk proxy. But this is not the complete story. We
still have a question to answer: what may have caused the change in the relation between risk and
returns? The obvious explanation brings us back to neurobiology, behavioural finance and the main
idea that investors’ behaviour is full of irrationality, emotions, feelings, and memories that are taken
into account in the decision process that can lead us to irrational decisions. Our hypothesis is:
something has induced a change in the way investors evaluate firms with lower BE/ME, creating
higher demand and turnover for this stock. Because investors usually buy and sell intraday or
overnight, they force greater price floating and, thus, higher volatility. In this sense, they are riskier
and have a higher return level associated. This possibility should be followed up in future studies.
One can argue that this explanation is not good enough because it does not consider the size effect. It
is true, but we would not expect that. Literature refers to the BE/ME as the main explanatory factor
regarding excess returns, with a much stronger explanatory capacity than size effect. In addition, the
preference for the BE/ME factor in investment decisions is normal under this assumption. A similar
phenomenon may have affected β. In the early nineties several scholars such as Fama and French
(1992) announced the death of β. So, if β is not a relevant factor, it will be less and less used. The
relationship between β and excess returns tends to decrease, as our results suggest.
These results have obvious implications for the question raised initially: what is the real role of the
size and book-to-market effects? Considering the contradictions between the USA and the UK
samples and the reduced explanatory power when regressed against excess return, they may not be risk
proxies or relevant characteristics for explaining return or excess return. If we considered only the UK
sample, then HML and SMB could be understood as proxies of risk.
The overall analysis, specifically the UK-USA contradictions, leads us to a conclusion: either we have
a data bias or financial markets are inefficient and reflect serious irrationality.
V References
Alper, M. and H. Raifa (1982), ‘A Progress Report on the Training of Probability Assessors’, in D. Kahneman, P. Slovic and A. Tversky (eds.), Judgment Under Uncertainty: Heuristics and Biases (Cambridge University Press)
Banz, R. (1981), ‘The Relationship Between Return and the Market Value of Common Stocks’, Journal of financial Economics, Vol. 9, No. 1 (March), pp. 3-18
Banz, R. and W. Breen (1986), ‘Sample-Dependent Results Using Accounting and Market Data: Some Evidence’, Journal of Finance, Vol. 41, No. 41 (September), pp. 779-793
Basu, S. (1983), ‘The Relationship Between Earnings Yield, Market Value, and Return for NYSE Common Stocks’, Journal of Financial Economics Vol. 12, No. 1 (June), pp. 129-156
Bhandari, Laxmi C. (1988), ‘Debt/equity Ratios and Expected Common Stock Returns: Empirical Evidence’, Journal of Finance, Volume 43, No. 2 (June), pp. 507-528
Black, F. (1972), ‘Capital Market Equilibrium with Restricted Borrowing’, Journal of Business, Vol. 45, No. 3 (July), pp. 444-455
Buehler R., D. Griffin, and M. Ross (1994), ‘Exploring the ‘Planning Fallacy’: Why People Underestimate their Task Completion Times’, Journal of Personality and Social Psychology, Vol. 67, No. 3 (March), pp. 366-381
Camerer, C. and R. Hogarth (1999), ‘The Effects of Financial Incentives in Experiments: A Review and Capital-Labor Production Framework’, Journal of Risk and Uncertainty, Vol. 19, No. 1-3 (December), pp. 7-42
Damásio, A (2003), Looking for Spinoza. Joy, Sorrow and the Feeling Brain (Orlando: Harcourt Books)
Daniel, K. and S. Titman (1997), ‘Evidence on the Characteristics of Cross-Sectional Variation in Stock Returns’, Journal of Finance, Vol. 52, No. 1 (March), pp. 1-33
Davis, J., E. Fama, and K. French (2000), ‘Characteristics, Covariances, and Average Returns: 1929 to 1997’, Journal of Finance, 55, No. 1 (February), pp. 389-406
De Bondt, W. and R. Thaler (1985), ‘Does the Stock Market Overreact?’, Journal of Finance, Vol. 40, No. 3 (July), 793-808
--- --- (1987), ‘Further Evidence on Investor Overreaction and Stock Market Seasonality’, Journal of Finance, Vol. 42 No. 3 (July), pp. 557-581
Edwards, W. (1968), ‘Conservatism in Human Information Processing’, in B. Kleinmutz (ed.), Formal Representation of Human Judgment (New York: John Wiley and Sons)
Fama, E. and J. MacBeth (1973), ‘Risk, Return and Equilibrium: Empirical Tests’ Journal of Political Economy, Vol. 81, No. 3 (May-June), pp. 607-636
Fama, E. (1970), ‘Efficient Capital Markets: A Review of Theory and Empirical Work’, Journal of Finance, Vol. 25, No. 2 (May), pp. 383-417
Fama, E. and K. French (1992), ‘The Cross-Section of Expected Stock Returns’, Journal of Finance, Vol. 47, No. 2 (June), pp. 427-465
--- --- (1993), ‘Common Risk Factors in Returns on Stocks and Bonds’, Journal of Financial Economics Vol. 33, No. 1 (February), pp. 3-56
--- --- (1996), ‘Multifactor Explanations of Asset Pricing Anomalies’, Journal of Finance, Vol. 51, No. 1 (March), pp. 55-84
Fischhoff, B., Slovic, P. and S. Lichtenstein (1977), ‘Knowing With Certainty: The Appropriateness of Extreme confidence,’ Journal of Experimental Psychology: Human Perception and Performance, Vol. 3, No. 4 (November), pp. 552-564
Jegadeesh, N. and S. Titman (1993), ‘Returns to Buying Winners and Selling Losers: Implications for Stock Market Efficiency’, Journal of Finance, Vol. 48, No. 1 (March), pp. 65-91
Kahneman, D, and A. Tversky (1982), ‘Intuitive Prediction: Biases and Corrective Procedures’ in D. Kahneman, P. Slovic and A. Tversky (eds.), Judgment Under Uncertainty: Heuristics and Biases (Cambridge: Cambridge University Press)
--- --- (1974), ‘Judgement Under Uncertainty: Heuristics and Biases’, Science, Vol. 185, No. 4157 (September), pp. 1124-31
Keim, Donald B. (1983), ‘Size Related Anomalies and Stock Return Seasonality: Further Evidence’, Journal of Financial Economics Vol. 12, No. 1 (June) pp. 13-32
Kothari, S. P., J. Shanken and R. Sloan (1995), ‘Another Look at the Cross-Section of Expected Returns’, Journal of Finance, Vol. 50, No. 1 (March), pp. 185-224
Lintner, J. (1965), ‘The Valuation of Risk Assets and the Selection of Risky Investments in Stock Portfolios and Capital Budgets’, Review of Economics and Statistics, Vol. 47, No. 1, (February), pp. 13-37
Lord, C., Ross and M. Lepper (1979), Biased Assimilation and Attitude Polarization: The Effects of Prior Theories on Subsequently Considered Evidence’, Journal of Personality and Social Psychology, Vol. 37, No. 11 (November), pp. 2098-2109
Merton, R. (1973), ‘An Intertemporal Capital Asset Pricing Model’, Econometrica, Vol. 41, No. 5 (September), pp. 867-887
Rosenberg, B., K. Reid and R. Lanstein (1985), ‘Persuasive Evidence of Market Inefficiency’, Journal of Portfolio Management Vol. 11, No. 1 (Spring), pp. 9-17
Ross, S. (1976), ‘The Arbitrage Theory of Capital Asset Pricing’, Journal of Economic Theory, Vol. 13, No. 3 (December), pp. 341-360
Table 1 – Descriptive statistics of the 25 portfolios - UK
The London Stock Exchange sub-sample data used covers the period from December 1982 to June 2002. It includes all firms that have been listed for at least two years in the Worldscope UK 2003 database and have prices available in both December of year t-1 and June of year t. The book-to-market ratio (BE/ME) and book-to-market equity (ME) were then used to form the portfolios from July of t through June of Year t+1. All firms with non-positive book-equity have been excluded. The market value is defined as the number of shares outstanding times the share price. The number of shares outstanding is updated when new stock is issued or when it changes (e.g. stock split). The book-equity value is calculated as the fixed assets less intangible assets minus total debt, minority interests and preferred stock.
Within each year, we ranked all stocks in the sample based on their book-to-market ratio at the end of
year t-1. Given these rankings the sample was divided into five quintiles. Next, the stocks were
re-ranked in accordance with their market-equity value at the end of June of year t and divided into five new quintiles. This way, each stock belongs simultaneously to a certain BE/ME quintile and an ME quintile. The matching of these two sets of quintiles allowed the creation of 25 portfolios per year. For each portfolio we computed the weighted-average return. To calculate the return rate, we considered the adjusted price of the last day of the month.
Panel A - 1983-2002
Book-to-Market
Size
Low 2 3 4 High Low 2 3 4 High
Return Standard Deviation
1.82% 1.38% 1.33% 0.97% 1.34% 9.69% 6.80% 8.31% 5.25% 5.43% Small 2.80% 3.58% 2.73% 3.11% 2.02% 2.58% 10.43% 12.01% 9.55% 15.35% 6.70% 5.58% 2 1.48% 2.26% 1.86% 0.85% 0.99% 1.45% 7.53% 12.37% 7.69% 5.12% 4.56% 5.07% 3 1.13% 1.30% 1.08% 1.31% 0.71% 1.22% 5.74% 6.98% 5.68% 5.68% 4.85% 5.42% 4 0.92% 1.51% 0.77% 0.85% 0.52% 0.94% 6.29% 9.96% 4.85% 5.04% 4.82% 5.27% Big 0.50% 0.43% 0.47% 0.51% 0.59% 0.52% 5.06% 4.73% 4.88% 4.95% 5.03% 5.68%
t-statistics (return) Average number of firms
6.40 6.93 5.44 6.28 8.43 56 59 59 60 59
Small 9.17 4.56 4.37 3.10 4.62 7.06 57 35 39 53 62 96
2 6.72 2.80 3.70 2.54 3.33 4.38 57 38 50 58 67 73
3 6.69 2.85 2.92 3.53 2.25 3.45 58 56 58 58 63 58
4 4.98 2.31 2.42 2.59 1.66 2.73 60 71 69 62 59 40
Big 3.40 1.39 1.47 1.57 1.78 1.40 59 80 78 63 47 30
Average size Average Book-to-Market 531,854 564,691 441,181 248,161 258,070 0.29 0.52 0.77 1.14 1.65 Small 6,025 6,576 6,284 5,864 5,934 5,466 1.05 0.40 0.63 0.89 1.27 2.04 2 17,759 18,180 17,800 17,145 17,777 17,894 0.89 0.32 0.56 0.79 1.13 1.68 3 44,848 46,280 45,030 45,233 44,472 43,225 0.85 0.28 0.50 0.74 1.14 1.59 4 135,012 138,868 139,448 130,154 131,944 134,643 0.79 0.25 0.46 0.73 1.08 1.44 Big 1,840,312 2,449,363 2,614,892 2,007,506 1,040,678 1,089,121 0.79 0.22 0.44 0.69 1.07 1.52
Panel B - 1983-1993
Book-to-Market
Size
Low 2 3 4 High Low 2 3 4 High
Return Standard Deviation
1.13% 1.29% 1.22% 1.07% 1.71% 5.90% 6.25% 5.90% 5.69% 6.11% Small 2.61% 2.46% 3.02% 2.29% 2.09% 3.17% 6.96% 6.83% 8.45% 6.50% 6.54% 6.64% 2 1.28% 1.20% 1.03% 1.10% 1.29% 1.79% 5.79% 6.09% 5.79% 5.96% 5.43% 6.00% 3 1.04% 0.92% 0.89% 1.25% 0.79% 1.34% 5.61% 5.62% 5.51% 5.86% 5.43% 5.92% 4 0.86% 0.62% 0.86% 0.91% 0.66% 1.21% 5.59% 5.46% 5.31% 5.91% 5.38% 6.08% Big 0.64% 0.43% 0.65% 0.57% 0.52% 1.03% 5.61% 5.50% 5.60% 5.42% 5.74% 5.93%
t-statistics (return) Average number of firms
4.64 5.04 5.04 4.58 6.81 47 48 49 48 48
Small 9.09 3.95 3.91 3.87 3.50 5.22 47 30 35 42 53 74
2 5.37 2.15 1.95 2.02 2.61 3.27 46 35 44 46 52 53
3 4.50 1.80 1.78 2.34 1.60 2.48 48 47 50 48 49 43
4 3.73 1.25 1.78 1.68 1.35 2.19 49 55 53 53 49 37
Big 2.79 0.85 1.27 1.15 1.00 1.91 49 65 58 53 37 33
Average size Average Book-to-Market
313,437 285,628 329,961 236,491 176,831 0.33 0.56 0.84 1.16 1.70 Small 4,854 5,551 4,794 4,554 4,747 4,625 1.07 0.42 0.62 0.93 1.26 2.11 2 13,674 13,440 13,682 13,777 13,593 13,878 0.94 0.35 0.63 0.88 1.17 1.67 3 35,586 35,655 36,072 35,994 36,016 34,193 0.90 0.31 0.55 0.82 1.15 1.66 4 108,370 110,438 110,314 108,642 105,135 107,318 0.84 0.29 0.51 0.80 1.12 1.50 Big 1,179,865 1,402,101 1,263,278 1,486,838 1,022,966 724,141 0.83 0.26 0.50 0.74 1.09 1.55
Panel C - 1993-2002
Book-to-Market
Size
Low 2 3 4 High Low 2 3 4 High
Return Standard Deviation
2.54% 1.48% 1.44% 0.86% 0.96% 12.47% 7.35% 10.26% 4.74% 4.55% Small 3.01% 4.76% 2.43% 3.96% 1.95% 1.95% 13.14% 15.67% 10.62% 20.97% 6.90% 4.12% 2 1.70% 3.39% 2.73% 0.59% 0.68% 1.10% 9.01% 16.55% 9.23% 4.05% 3.42% 3.86% 3 1.22% 1.70% 1.28% 1.38% 0.63% 1.10% 5.87% 8.18% 5.87% 5.52% 4.18% 4.85% 4 0.98% 2.43% 0.66% 0.80% 0.37% 0.65% 6.96% 13.09% 4.32% 3.95% 4.17% 4.27% Big 0.36% 0.43% 0.28% 0.45% 0.65% -0.02% 4.39% 3.79% 4.01% 4.42% 4.17% 5.37%
t-statistics (return) Average number of firms
4.87 4.80 3.34 4.32 5.01 65 70 69 71 70
Small 5.47 3.25 2.44 2.02 3.02 5.07 67 40 43 64 71 118
2 4.49 2.18 3.16 1.54 2.12 3.04 68 41 56 70 81 93
3 4.96 2.22 2.34 2.67 1.61 2.42 69 64 66 67 77 73
4 3.37 1.98 1.64 2.16 0.96 1.63 71 86 85 72 69 43
Big 1.95 1.21 0.73 1.08 1.67 -0.34 70 95 98 73 57 26
Average size Average Book-to-Market
761,766 858,441 558,254 260,444 343,585 0.28 0.46 0.76 1.12 1.75 Small 7,257 7,655 7,851 7,244 7,183 6,355 1.12 0.43 0.58 0.99 1.26 2.32 2 22,059 23,170 22,134 20,690 22,180 22,122 0.93 0.35 0.49 0.79 1.10 1.94 3 54,598 57,464 54,460 54,959 53,373 52,732 0.84 0.24 0.46 0.73 1.13 1.62 4 163,056 168,795 170,116 152,799 160,163 163,406 0.75 0.20 0.40 0.66 1.09 1.39 Big 2,535,520 3,551,745 4,037,643 2,555,578 1,059,324 1,473,312 0.73 0.16 0.37 0.63 1.03 1.48
Table 2 – Descriptive statistics of the Fama-French portfolios - UK
The London Stock Exchange sub-sample data used covers the period from December 1982 to June 2002. It includes all firms that have been listed for at least two years in the Worldscope UK 2003 database and have prices available in both December of year t-1 and June of year t. The book-to-market ratio (BE/ME) and book-to-market equity (ME) were then used to form the portfolios from July of t through June of Year t+1. All firms with non-positive book-equity have been excluded. The market value is defined as the number of shares outstanding times the share price. The number of shares outstanding is updated when new stock is issued or when it changes (e.g. stock split). The book-equity value is calculated as the fixed assets less intangible assets minus total debt, minority interests and preferred stock.
Within each year, we ranked all stocks in the sample based on their book-to-market ratio at the end of
year t-1. Given these rankings the sample was divided into three book-to-market categories (High,
Medium and Low with breakpoints at 30% and 70%). Next, the stocks were re-ranked in accordance with their market-equity value at the end of June of year t and divided into two size categories (Small and Big with breakpoint at 50%). This way, each stock belongs simultaneously to a certain BE/ME group and an ME group. The matching of these two sets of groups allowed the creation of 6 portfolios per year. For each portfolio we computed the weighted-average return. To calculate the return rate, we considered the adjusted price of the last day of the month.
Panel A - 1983 - 2002
Book-to-Market
Size
Low Medium High Low Medium High
Return Standard Deviation
1.23% 1.04% 0.98% 6.40% 5.16% 4.99%
Small 1.65% 2.03% 1.47% 1.44% 6.16% 7.73% 5.59% 4.80% Big 0.52% 0.43% 0.61% 0.52% 4.80% 4.59% 4.66% 5.15%
t-statistics (return) Average number of firms
4.15 4.37 4.23 213 294 223
Small 7.07 4.01 4.02 4.58 239 155 281 281
Big 2.87 1.43 2.01 1.54 248 272 308 166
Average size Average Book-to-Market 628,725 426,804 199,685 0.35 0.79 1.52
Small 16,726 18,628 16,436 15,115 0.98 0.40 0.86 1.67 Big 820,083 1,238,823 837,171 384,256 0.80 0.30 0.72 1.37
Panel B - 1983 - 1993
Book-to-Market
Size
Low Medium High Low Medium High
Return Standard Deviation
0.88% 1.05% 1.33% 5.47% 5.57% 5.56% Small 1.50% 1.29% 1.46% 1.76% 5.63% 5.63% 5.77% 5.51% Big 0.66% 0.46% 0.63% 0.90% 5.40% 5.30% 5.34% 5.59%
t-statistics (return) Average number of firms
2.48 2.90 3.71 176 241 180
Small 5.07 2.52 2.77 3.50 194 140 227 217
Big 2.33 0.94 1.28 1.77 204 213 256 144
Average size Average Book-to-Market 333,816 293,132 185,713 0.40 0.85 1.51
Small 13,018 14,379 12,979 11,695 0.99 0.45 0.90 1.61 Big 528,756 653,252 573,286 359,730 0.85 0.34 0.79 1.40
Panel C - 1993 - 2002
Book-to-Market
Size
Low Medium High Low Medium High
Return Standard Deviation
1.60% 1.04% 0.61% 7.25% 4.70% 4.30% Small 1.79% 2.79% 1.48% 1.10% 6.69% 9.42% 5.42% 3.91% Big 0.37% 0.40% 0.60% 0.11% 4.08% 3.73% 3.84% 4.63%
t-statistics (return) Average number of firms
3.33 3.35 2.12 251 347 266
Small 4.96 3.17 2.93 3.00 283 171 334 345
Big 1.68 1.14 1.67 0.26 293 330 360 188
Average size Average Book-to-Market 939,156 567,510 214,393 0.29 0.73 1.53
Small 20,630 23,100 20,075 18,714 0.96 0.34 0.81 1.74 Big 1,126,743 1,855,213 1,114,945 410,072 0.74 0.24 0.66 1.33
Table 3 – Descriptive statistics of the 25 portfolios -
The NYSE, AMEX and Nasdaq sub-sample data used covers the period from December 1982 to June 2002 and were arranged by Fama and French from Compustat and CRSP data. BE is the COMPUSTAT book value of stockholders’ equity, plus balance sheet deferred taxes and investment tax credit (if available), minus the book value of preferred stock. The book-to-market ratio (BE/ME) and market equity (ME) were then used to form the portfolios from July of t through June of Year t+1. All firms with non-positive book-equity have been excluded.
Within each year, all stocks were ranked in the sample based on their book-to-market ratio at the end of year t-1. Given these rankings the sample was divided into five quintiles. Next, the stocks were re-ranked in accordance with their market-equity value at the end of June of year t and divided into five new quintiles. This way, each stock belongs simultaneously to a certain BE/ME quintile and an ME quintile. The matching of these two sets of quintiles allowed the creation of 25 portfolios per year. For each portfolio the weighted-average returns were computed. To calculate the return rate, we considered the adjusted price of the .
Panel A - 1983-2002
Book-to-Market
Size
Low 2 3 4 High Low 2 3 4 High
Return Standard Deviation
0.64 1.00 1.09 1.22 1.24 7.03 5.67 4.89 4.57 4.98 Small 0.93 0.00 0.93 1.11 1.33 1.27 6.34 8.36 7.02 5.53 4.99 5.11
2 0.98 0.44 0.86 1.20 1.26 1.11 5.77 7.69 5.87 4.83 4.69 5.26 3 1.06 0.67 1.02 1.04 1.17 1.41 5.38 7.12 5.41 4.63 4.46 4.85 4 1.11 1.00 1.05 1.04 1.20 1.26 5.16 6.45 5.04 4.93 4.36 4.81 Big 1.11 1.07 1.13 1.07 1.11 1.15 4.73 5.10 4.80 4.51 4.35 4.89
t-statistics (return) Average number of firms
3.10 6.01 7.65 9.10 8.52 283 172 164 166 210 Small 5.01 0.00 2.02 3.06 4.08 3.81 607 786 451 449 518 829
2 5.79 0.89 2.24 3.81 4.12 3.23 151 231 153 151 125 94 3 6.77 1.45 2.89 3.46 4.02 4.44 98 162 105 93 76 54 4 7.37 2.38 3.19 3.24 4.21 4.00 75 119 82 71 61 43 Big 8.00 3.20 3.59 3.64 3.91 3.60 65 117 71 57 49 32
Average size Average Book-to-Market
3,648 2,796 2,560 2,131 1,956 0.23 0.48 0.70 0.95 1.59 Small 47 49 53 52 47 34 0.84 0.21 0.48 0.70 0.96 1.85
2 261 256 262 267 266 256 0.80 0.22 0.48 0.70 0.95 1.66 3 648 569 655 661 667 685 0.78 0.23 0.48 0.70 0.95 1.54 4 1,703 1,605 1,710 1,718 1,755 1,726 0.78 0.24 0.48 0.70 0.96 1.51 Big 10,433 15,764 11,300 10,101 7,918 7,080 0.75 0.23 0.48 0.69 0.95 1.40
Panel B - 1983-1993
Book-to-Market
Size
Low 2 3 4 High Low 2 3 4 High
Return Standard Deviation
0.69 1.04 1.11 1.27 1.44 6.06 5.47 4.81 4.42 4.96 Small 0.71 -0.16 0.73 0.82 1.05 1.13 5.47 6.43 5.77 5.05 4.83 5.14 2 1.07 0.44 0.91 1.36 1.33 1.29 5.49 6.71 5.81 4.88 4.54 5.27 3 1.24 0.85 1.23 1.12 1.43 1.59 5.19 6.29 5.53 4.64 4.39 4.92 4 1.25 1.13 1.06 1.04 1.38 1.61 5.01 5.63 5.25 5.11 4.29 4.72 Big 1.28 1.17 1.28 1.19 1.18 1.58 4.67 5.07 5.00 4.41 4.10 4.77
t-statistics (return) Average number of firms 2.78 4.67 5.64 7.06 7.12 269 157 141 130 179 Small 3.19 -0.28 1.39 1.77 2.38 2.40 540 837 435 384 370 676 2 4.76 0.72 1.72 3.06 3.22 2.67 131 202 136 128 100 88 3 5.88 1.48 2.44 2.65 3.57 3.54 86 136 86 82 72 54 4 6.09 2.21 2.20 2.23 3.53 3.75 64 93 66 61 58 42 Big 6.72 2.53 2.81 2.96 3.16 3.64 55 79 60 52 50 34
Average size Average Book-to-Market 1,844 1,621 1,559 1,529 1,493 0.28 0.57 0.81 1.08 1.71 Small 29 29 32 31 30 22 0.94 0.24 0.57 0.81 1.08 2.00
2 175 170 173 180 179 171 0.90 0.27 0.57 0.82 1.07 1.79 3 455 394 453 459 483 483 0.88 0.28 0.57 0.81 1.07 1.64 4 1,193 1,093 1,193 1,198 1,258 1,221 0.87 0.29 0.57 0.81 1.08 1.61 Big 6,195 7,533 6,253 5,927 5,696 5,566 0.85 0.30 0.57 0.81 1.08 1.52
Panel C - 1993-2002
Book-to-Market
Size
Low 2 3 4 High Low 2 3 4 High
Return Standard Deviation
0.59 0.95 1.08 1.16 1.03 7.93 5.89 4.97 4.73 5.00 Small 1.16 0.17 1.13 1.41 1.63 1.43 7.14 10.02 8.15 6.01 5.17 5.10 2 0.88 0.45 0.81 1.03 1.19 0.93 6.06 8.63 5.96 4.79 4.86 5.27 3 0.87 0.49 0.80 0.96 0.90 1.21 5.57 7.92 5.29 4.63 4.54 4.78 4 0.97 0.86 1.05 1.05 1.01 0.89 5.31 7.23 4.84 4.74 4.45 4.90 Big 0.92 0.96 0.96 0.95 1.04 0.69 4.79 5.14 4.61 4.63 4.61 5.00
t-statistics (return) Average number of firms 1.76 3.86 5.18 5.84 4.91 297 189 188 203 243 Small 3.86 0.18 1.49 2.51 3.37 3.00 224 733 468 517 673 987 2 3.47 0.56 1.45 2.30 2.61 1.88 676 262 171 176 151 99 3 3.75 0.66 1.62 2.22 2.13 2.70 172 188 125 105 81 55 4 4.36 1.27 2.31 2.36 2.43 1.93 111 146 98 81 64 44 Big 4.59 1.99 2.23 2.18 2.41 1.48 86 155 82 61 48 29
Average size Average Book-to-Market 5,548 4,033 3,613 2,764 2,444 0.18 0.40 0.58 0.83 1.47 Small 66 71 75 73 64 46 0.74 0.18 0.40 0.59 0.84 1.69
2 353 346 356 359 358 345 0.71 0.18 0.40 0.59 0.82 1.54 3 851 752 868 874 862 897 0.68 0.18 0.40 0.58 0.82 1.43 4 2,239 2,143 2,254 2,265 2,278 2,256 0.68 0.18 0.40 0.58 0.83 1.42 Big 14,893 24,427 16,611 14,496 10,257 8,674 0.65 0.17 0.39 0.58 0.82 1.28
Table 4 – Descriptive statistics of the Fama-French portfolios -
The NYSE, AMEX and Nasdaq sub-sample data used covers the period from December 1982 to June 2002 and were arranged by Fama and French from Compustat and CRSP data. BE is the COMPUSTAT book value of stockholders’ equity, plus balance sheet deferred taxes and investment tax credit (if available), minus the book value of preferred stock. The book-to-market ratio (BE/ME) and market equity (ME) were then used to form the portfolios from July of t through June of Year t+1. All firms with non-positive book-equity have been excluded.
Within each year, all stocks were ranked in the sample based on their book-to-market ratio at the end of year t-1. Given these rankings the sample was divided into five quintiles. Next, the stocks were re-ranked in accordance with their market-equity value at the end of June of year t and divided into five new quintiles. This way, each stock belongs simultaneously to a certain BE/ME quintile and an ME quintile. The matching of these two sets of quintiles allowed the creation of 25 portfolios per year. For each portfolio the weighted-average return were computed. To calculate the return rate, we considered the adjusted price of the last day of the month.
Panel A - 1983 - 2002
Book-to-Market Size
Low Medium High Low Medium High
Return Standard Deviation
0.76 1.11 1.20 6.17 4.65 4.51
Small 0.98 0.49 1.15 1.28 5.70 7.12 4.92 4.74 Big 1.08 1.03 1.08 1.13 4.57 5.05 4.37 4.28
t-statistics (return) Average number of firms
19.09 19.81 20.53 933 821 737
Small 51.76 1.06 3.59 4.13 1352 1451 1301 1304 Big 60.94 3.13 3.77 4.03 308 415 340 169
Average size Average Book-to-Market 2,131 2,174 1,642 0.29 0.71 1.39
Small 119 139 136 81 0.83 0.28 0.72 1.49 Big 3,846 4,123 4,211 3,203 0.76 0.29 0.71 1.28
Panel B - 1983 - 1993
Book-to-Market Size
Low Medium High Low Medium High
Return Standard Deviation
0.84 1.16 1.36 5.69 4.61 4.52
Small 0.99 0.51 1.16 1.29 4.93 6.22 4.90 4.82 Big 1.25 1.17 1.17 1.42 4.26 5.11 4.32 4.22
t-statistics (return) Average number of firms
14.71 15.16 15.86 886 695 612
Small 70.06 0.90 2.59 2.94 1199 1454 1090 1053 Big 63.41 2.51 2.96 3.70 263 318 300 172
Average size Average Book-to-Market 1,608 1,429 1,259 0.35 0.84 1.53
Small 77 81 91 59 0.94 0.34 0.84 1.64 Big 2,787 3,135 2,767 2,459 0.87 0.36 0.84 1.41
Panel C - 1993 - 2002
Book-to-Market Size
Low Medium High Low Medium High
Return Standard Deviation
0.68 1.06 1.04 6.66 4.69 4.51 Small 0.96 0.48 1.14 1.26 4.70 8.00 4.96 4.68
Big 0.89 0.89 0.98 0.81 4.34 5.00 4.44 4.34
t-statistics (return) Average number of firms 13.98 15.62 14.98 983 953 868
Small 51.45 0.64 2.47 2.88 1514 1449 1524 1568 Big 56.87 1.89 2.36 2.00 355 516 382 167
Average size Average Book-to-Market 2,682 2,964 2,045 0.22 0.58 1.23
Small 162 200 183 104 0.71 0.23 0.59 1.33 Big 4,965 5,164 5,745 3,985 0.64 0.21 0.56 1.14
Table 5 – Annual correlations between size and BE/ME
The London Stock Exchange sub-sample data used covers the period from December 1982 to June 2002. It includes all firms that have been listed for at least two years in the Worldscope UK 2003 database and have prices available in both December of year t-1 and June of year t. The book-to-market ratio (BE/ME) and book-to-market equity (ME) were then used to form the portfolios from July of t through June of Year t+1. All firms with non-positive book-equity have been excluded. The market value is defined as the number of shares outstanding times the share price. The number of shares outstanding is updated when new stock is issued or when it changes (e.g. stock split). The book-equity value is calculated as the fixed assets less intangible assets minus total debt, minority interests and preferred stock. To compute correlation is used the natural logarithm of ME and BE/ME is used to better capture the underlying effects.
Time period
1983-2002 1983-1993 1993-2002 Variables
ln(BE/ME) ln(MV) ln(BE/ME) ln(MV) ln(BE/ME) ln(MV)
ln(mv) 1.000 1.000 1.000
ln(beme) -0.299 1.000 -0.275 1.000 -0.304 1.000
Table 6 – Annual correlations between size and BE/ME for the 25 portfolios
The London Stock Exchange sub-sample data used covers the period from December 1982 to June 2002. It includes all firms that have been listed for at least two years in the Worldscope UK 2003 database and have prices available in both December of year t-1 and June of year t. The book-to-market ratio (BE/ME) and book-to-market equity (ME) were then used to form the portfolios from July of t through June of Year t+1. All firms with non-positive book-equity have been excluded. The market value is defined as the number of shares outstanding times the share price. The number of shares outstanding is updated when new stock is issued or when it changes (e.g. stock split). The book-equity value is calculated as the fixed assets less intangible assets minus total debt, minority interests and preferred stock.
Within each year, we ranked all stocks in the sample based on their book-to-market ratio at the end of
year t-1. Given these rankings the sample was divided into five quintiles. Next, the stocks in
accordance with their market-equity value at the end of June of year t and divided into five new quintiles. This way, each stock belongs simultaneously to a certain BE/ME quintile and an ME quintile. The matching of these two sets of quintiles allowed the creation of 25 portfolios per year.
Book-to-Market Size
Low 2 3 4 High
Panel A - 1983-2002
Small -0.247 -0.330 -0.379 -0.312 -0.310 2 -0.319 -0.505 -0.413 -0.406 -0.273 3 -0.360 -0.522 -0.492 -0.375 -0.353 4 -0.326 -0.431 -0.380 -0.216 -0.344 Big -0.151 -0.177 -0.270 -0.285 -0.153
Panel B - 1983-1993
Small -0.174 -0.334 -0.378 -0.373 -0.423 2 -0.247 -0.463 -0.512 -0.521 -0.363 3 -0.332 -0.513 -0.511 -0.444 -0.467 4 -0.228 -0.464 -0.503 -0.293 -0.367 Big -0.128 -0.158 -0.234 -0.356 -0.146
Panel C - 1993-2002
Table 7 – Description of Fama-French model variables
The London Stock Exchange sub-sample data used covers the period from December 1982 to June 2002. It includes all firms that have been listed for at least two years in the Worldscope UK 2003 database and have prices available in both December of year t-1 and June of year t. The book-to-market ratio (BE/ME) and book-to-market equity (ME) were then used to form the portfolios from July of t through June of Year t+1. To calculate the return rate, we considered the adjusted price of the last day of the month. Then we compute the monthly market return as the weighted-average return of all firms listed in the considered month. The risk free return rate used is the English three-month T-Bill return Within each year, we ranked all stocks in the sample based on their book-to-market ratio at the end of
year t-1. Given these rankings the sample was divided into three book-to-market categories (High,
Medium and Low with breakpoints at 30% and 70%). Next, the stocks were re-ranked in accordance with their market-equity value at the end of June of year t and divided into two size categories (Small and Big with breakpoint at 50%). This way, each stock belongs simultaneously to a certain BE/ME group and an ME group. The matching of these two sets of groups allowed the creation of 6 portfolios per year. These portfolios are designated LS, MS, HS, LB, MB and HB. With these we form two new portfolios to capture the book-to-market and size effect. The first portfolio is the SMB (small minus big) that captures the size effect and is the difference between the return of large and small firms with similar book-to-market. It was calculated as the simple average of LS, MS and HS returns minus the simple average of LB, MB and HB returns. The second portfolio is the HML (high minus low) and captures the book-to-market effect. It is the difference between the average return of the higher BE/ME portfolios and the lower BE/ME portfolios.
Panel A - 1983 - 2002
Independent variables Correlations
Name Average Std Dev T-statistics Rm-Rf SMB HML
Rm 1.22% 4.22% 165.36 Rm-Rf 1
Rm-Rf 0.57% 4.22% 77.14 SMB -0.142* 1
SMB 1.16% 4.55% 146.73 HML -0.048* -0.596* 1 HML -0.46% 3.39% -78.73 *Correlation is significant at the 0.01 level (2-tailed)
Panel B - 1983 - 1993
Independent variables Correlations
Name Average Std Dev T-statistics Rm-Rf SMB HML
Rm 1.40% 5.09% 104.10 Rm-Rf 1
Rm-Rf 0.53% 5.11% 38.95 SMB -0.244* 1
SMB 0.74% 3.61% 77.23 HML 0.095* -0.002 1
HML 0.38% 1.84% 77.93 *Correlation is significant at the 0.01 level (2-tailed)
Panel C - 1993 - 2002
Independent variables Correlations
Name Average Std Dev T-statistics Rm-Rf SMB HML
Rm 1.07% 3.39% 136.58 Rm-Rf 1
Rm-Rf 0.60% 3.38% 76.99 SMB -0.080* 1
SMB 1.49% 5.13% 125.35 HML -0.134* -0.750* 1 HML -1.11% 4.91% -116.95 *Correlation is significant at the 0.01 level (2-tailed)
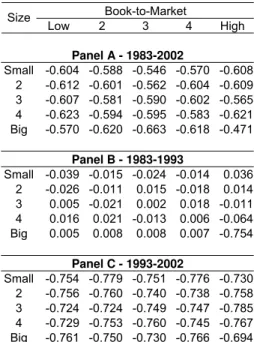
Table 8 – Correlation between HML and SMB for the 25 portfolios
The London Stock Exchange sub-sample data used covers the period from December 1982 to June 2002. It includes all firms that have been listed for at least two years in the Worldscope UK 2003 database and have prices available in both December of year t-1 and June of year t. The book-to-market ratio (BE/ME) and book-to-market equity (ME) were then used to form the portfolios from July of t through June of Year t+1. To calculate the return rate, we considered the adjusted price of the last day of the month. Then we computed the monthly market return as the weighted-average return of all firms listed in the considered month. The risk free return rate used is the English three-month T-Bill return
Within each year, we ranked all stocks in the sample based on their book-to-market ratio at the end of
year t-1. Given these rankings the sample was divided into three book-to-market categories (High,
Medium and Low with breakpoints at 30% and 70%). Next, the stocks were re-ranked in accordance with their market-equity value at the end of June of year t and divided into two size categories (Small and Big with breakpoint at 50%). This way, each stock belongs simultaneously to a certain BE/ME group and an ME group. The matching of these two sets of groups allowed the creation of 6 portfolios per year. These portfolios are designated LS, MS, HS, LB, MB and HB. With these we formed two new portfolios to capture the book-to-market and size effect. The first portfolio is the SMB (small minus big) that captures the size effect and is the difference between the return of large and small firms with similar book-to-market. It was calculated as the simple average of LS, MS and HS returns minus the simple average of LB, MB and HB returns. The second portfolio is the HML (high minus low) and captures the book-to-market effect. It is the difference between the average return of the higher BE/ME portfolios and the lower BE/ME portfolios.
After this, all stocks were ranked in the sample based on their book-to-market ratio at the end of year t-1. Given these rankings the sample was divided into five quintiles. Next, the stocks were re-ranked again in accordance with their market-equity value at the end of June of year t and divided into five new quintiles. This way, each stock belongs simultaneously to a certain BE/ME quintile and an ME quintile. The matching of these two sets of quintiles allowed the creation of 25 portfolios per year. The correlation between HML and SMB was computed for each portfolio.
Book-to-Market Size
Low 2 3 4 High
Panel A - 1983-2002
Small -0.604 -0.588 -0.546 -0.570 -0.608 2 -0.612 -0.601 -0.562 -0.604 -0.609 3 -0.607 -0.581 -0.590 -0.602 -0.565 4 -0.623 -0.594 -0.595 -0.583 -0.621 Big -0.570 -0.620 -0.663 -0.618 -0.471
Panel B - 1983-1993
Small -0.039 -0.015 -0.024 -0.014 0.036 2 -0.026 -0.011 0.015 -0.018 0.014 3 0.005 -0.021 0.002 0.018 -0.011 4 0.016 0.021 -0.013 0.006 -0.064 Big 0.005 0.008 0.008 0.007 -0.754
Panel C - 1993-2002