Statistical modeling of fatigue crack growth rate
in pre-strained 7475-T7351 aluminum alloy
Kassim S. Al-Rubaie
a, Emerson K.L. Barroso
b, Leonardo B. Godefroid
c,∗ aEMBRAER (Empresa Brasileira de Aeron´autica), Av. Brigadeiro Faria Lima 2170,12227-901 S˜ao Jos´e dos Campos, SP, Brazil
bCVRD (Companhia Vale do Rio Doce), Av. Dante Michelini, 5500, 29090-900 Vit´oria, ES, Brazil cUniversidade Federal de Ouro Preto, Escola de Minas, Deptartamento de Engenharia Metal´urgica e de Materiais,
Pra¸ca Tiradentes 20, 35400-000 Ouro Preto, MG, Brazil
Received 26 February 2007; received in revised form 16 September 2007; accepted 31 October 2007
Abstract
In this study, 7475-T7351 aluminum strips were subjected to two tensile pre-strain levels of 3% and 5%. Using compact tension C(T) specimens, fatigue crack growth tests were conducted under constant amplitude loading at stress ratios of 0.1 and 0.5 in air and at room temperature. Three fatigue crack growth rate (FCGR) models, namely, Collipriest, Priddle, and NASGRO were examined. To handle the effect of stress ratio on FCGR, Walker equivalent stress intensity factor model was used. Consequently, generalized Collipriest (GC), generalized Priddle (GP), and generalized NASGRO (GN) models were developed and fitted to the FCGR data. It was shown that both GC and GP models fit the FCGR data in a similar fashion. However, the GP model provided a better fit than the GC model. The GN model was found to be the most appropriate model for the data. Therefore, this model may be suggested for use in critical applications, such as aeronautical structural design.
© 2007 Elsevier B.V. All rights reserved.
Keywords: Modeling; Fatigue crack growth rate; Statistical analysis; 7475-T7351; Pre-strain
1. Introduction
High strength age-hardenable aluminum alloys, such as 2XXX and 7XXX, have been the most widely used structural materials in aeronautical industries due to their good mechanical properties and low densities[1–5].
The copper and magnesium bearing alloys (2XXX) are widely used for aircraft and space vehicles. The naturally aged and cold worked 2024-T3 is the most popular alloy of this group due to its good damage tolerance[1–4]. However, in the form of thick sheet, this alloy is susceptible to exfoliation corrosion [1,6].
The zinc and magnesium bearing alloys (7XXX), of which 7075 is the most widely used, have the highest strengths by far. In the conventional peak-aged temper (T6), the thick plates, forg-ings, and extrusions of 7XXX series alloys are susceptible to stress corrosion cracking (SCC)[1,6–8]. The over-aged temper (T7) has been developed to improve the SCC resistance;
how-∗Corresponding author. Tel.: +55 31 3551 3012/1586; fax: +55 12 3551 3012.
E-mail address:[email protected](L.B. Godefroid).
ever, this results in loss of strength compared with the T6 temper [9,10].
The need for high strength coupled with good fracture tough-ness and SCC resistance led to the development of the 7475 alloy [11]. This progress resulted from a considerable reduction in the levels of iron, silicon, and manganese, but also from improve-ments in thermo-mechanical and heat treatment practices[1,12]. In some cases, 7475-T7351 is being used after application of certain levels of strain. Regarding the influence of pre-straining on FCGR, few works [13–16]have been published. Hence, the objectives of this study are: (a) to show the effect of pre-strain on FCGR, and (b) to develop three generalized FCGR models and test them to determine which model provides the best-fit to the experimental data.
2. Material and experimental procedure
Aluminum alloy plate of 7475-T7351 with a thickness of 76.2 mm was used. The chemical composition is shown in Table 1. The alloy microstructure consists of a typical unre-crystallized pancake-like grain structure, as shown inFig. 1.
Table 1
Chemical composition of the 7475 aluminum alloy (wt.%)
Alloy Si Fe Cu Mn Mg Zn Cr Ti Al
7475 0.029 0.085 1.661 0.01 2.376 5.722 0.21 0.0266 Balance
Fig. 1. Microstructure of 7475-T7351 alloy: A typical pancake-like grain struc-ture is seen.
Strips of 5 mm thickness were machined from the original plate, and then subjected to two tensile pre-strain levels of 3% and 5%. Further, in accordance with ASTM E8[17], standard tensile test specimens were machined in the longitudinal direc-tion. The C(T) specimens used for fracture toughness and for fatigue crack growth tests were machined in L-T direction, according to ASTM E647[18]; the specimen dimensions are shown inFig. 2.
Fig. 2. Dimensional details of the C(T) specimen (dimensions in mm).
Fatigue crack growth tests were conducted on pre-cracked C(T) specimens in accordance with ASTM E 647[18]. The tests were done under a constant amplitude sinusoidal wave loading at stress ratios (R) of 0.1 and 0.5 using a 100 kN MTS servo-hydraulic machine, interfaced to a computer for machine control and data acquisition. The tests were conducted at a fre-quency of 30 Hz in air environment and at room temperature. The crack length was measured using a compliance method, in which a clip gauge is used to measure the elastic com-pliance of the specimen, which tends to increase with crack growth.
Moreover, fatigue crack growth threshold (Kth) was
evalu-ated using a constantRload reduction “load shedding” method proposed in ASTM E647 [18]. In this method, both maxi-mum and minimaxi-mum loads applied to a cracked specimen are reduced such that R ratio remains constant. Basically, the stress intensity factor range (K) is gradually reduced until the FCGR reaches a very small value. According to ASTM E647,
Kth is about the K corresponding to a FCGR (da/dN) of
10−10m/cycle.
Fracture toughness was evaluated by theKR-curve
determi-nation at room temperature and in air environment, in the MTS servo-hydraulic testing machine using the C(T) specimens, in accordance to ASTM E561[19]. The initial relative crack size,
ao/W= 0.45 was the same for all the specimens. Two tests were
conducted for each pre-strain level. Basically, cyclic loading is applied to introduce a fatigue crack. When the crack reaches the desired length, the fatigue cycling is stopped and the load is gradually increased until fracture occurs. The stress intensityKc
is the value ofKRat the instability condition determined from
the tangency point between the resistanceR-curve and one of the appliedK-curves.
Fracture surfaces were analyzed in a JEOL scanning electron microscope, model JSM 5510.
3. Results and discussions
3.1. Tensile properties
The results of tensile tests are presented inTable 2. Both 0.2% yield and ultimate tensile strength increase with an increase in the pre-strain level from 0% to 5%. On the other hand, the total
Table 2
Average room temperature tensile test properties of 7475-T7351
Pre-strain level Orient. σYS(MPa) σUTS(MPa) ε(%)
0% L 405.76 482.60 12.11
3% L 412.17 496.38 9.82
5% L 416 497.67 8.82
Table 3
Fracture toughness values of 7475-T7351
Pre-strain level Kc(MPa√m)
0% 95.5
3% 92.8
5% 79.3
strain to fracture decreases. These results are expected due to the effect of strain-hardening[20,21].
3.2. Fracture toughness
Table 3shows the results of the fracture toughness (Kc) tests
of 7475-T7351 for all cases of pre-strain studied.
The fracture toughness decreases with an increase in the pre-strain level[20–23]. A pre-straining of 5% causes a reduc-tion of 17% in Kc. This is expected and is attributed to the
effect of strain-hardening that leads to an increase in mate-rial strength. When the strength increases, the strain-hardening exponent decreases. This favors the formation and nucleation of microvoids with void sheet occurrence. This limits crack-tip opening displacement, thereby decreasing fracture toughness.
3.3. FCGR modeling
3.3.1. FCGR models
The reason for building models is to link theoretical ideas with the observed data to provide a good prediction of future observations. Modeling of FCGR data has enhanced the ability to create damage tolerant design philosophies.
Paris and Erdogan[24]proposed the most important and pop-ular work. They observed a linear relationship between FCGR (da/dN) and K when plotted on a log–log scale. Paris and Erdogan proposed the power law relationship:
da
dN =C K
n (1)
The Paris–Erdogan equation does not consider: (a) the effect ofR, (b) the existence ofKth, and (c) the accelerated FCGR
when the maximum stress intensity factor (Kmax) approaches the fracture toughness (Kc). It does not adequately describe FCGR regions I and III; it tends to overestimate region I and under-estimate region III. Although the Paris–Erdogan equation is a simplification of a very complex phenomenon, it is still very popular on account of significant engineering interest.
The typical curve of a log(da/dN)−log(K), at a prescribed condition (environment and stress ratio), is sigmoidal in shape. It comprises three regions and is bounded at its extremes by
KthandKc. In the intermediate region of the curve, there is
a linear relation between log(da/dN) and log(K), as proposed by Paris and Erdogan.
Based on Eq.(1), several FCGR models have been suggested to fit all or part of the sigmoidal curve. In this study, three models that fit all parts of FCGR curve are considered. These models are:
1. Collipriest model
Collipriest proposed the following inverse hyperbolic tan-gent function[25,26]:
da
dN =C(KcKth) n/2exp ln K c Kth n/2
×tanh−1ln(
K2/(KthKc(1−R)))
ln(Kc(1−R)/Kth)
(2)
where ln denotes the natural logarithm. 2. Priddle model
Priddle proposed the following function[27]:
da
dN =C
K
−Kth Kc−(K/(1−R))
n
(3)
3. NASGRO model
Forman and Mettu[28]developed at NASA the following equation:
da
dN =
CKn(1−(Kth/K))p
(1−(K/Kc(1−R)))q
(4)
Eqs.(2)–(4)may be used only to fit one FCGR data set for a givenRratio. If the data at hand are collected atR= 0.1, the fitting models(2)–(4)cannot be used to estimate FCGR at anotherR, for example, atR= 0.5.
To handle the effect ofRon FCGR, Walker[29]proposed the equivalent stress intensity factor model, which is widely accepted. It is given by:
Keq=Kmax(1−R)m (5)
mis a Walker exponent and its objective is to control the spread of the FCGR curves for different values ofR;Keqis an equivalent
zero-to-tension (R= 0) stress intensity factor range. Knowing thatK=Kmax(1−R), then:
Keq=K(1−R)m−1 (6)
In Eqs.(2)–(4), substitutingKwithKeq, puttingR= 0, and
replacingKthbyK0, the generalized Collipriest (GC),
gener-alized Priddle (GP), and genergener-alized NASGRO (GN) models respectively may be written as:
da
dN =C(KcK0) n/2exp ln K c K0 n/2
×tanh−1
ln(K2(1−R)2m−2/K0Kc) ln(Kc/K0)
(7)
da
dN =C
K(1−R)m−1−K0 Kc−K(1−R)m−1
n
(8)
da
dN=
C(K(1−R)m−1)n(1−(K0/(K(1−R)m−1)))p (1−(K(1−R)m−1/Kc))q (9)
Table 4a
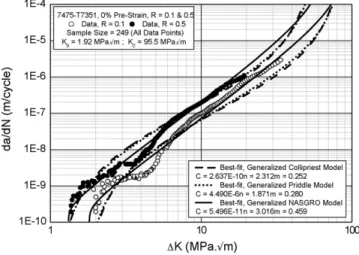
Estimated parameters of FCGR models, 7475-T7351, 0% pre-strain
Model Parameter Estimate S.E. t-Value p-Value 95% LCL 95% UCL
Generalized Collipriest (GC) C 2.637E−10 3.648E−11 7.227 <0.0001 1.918E−10 3.355E−10
n 2.312 5.272E−02 43.861 <0.0001 2.208 2.416
m 0.252 3.544E−02 7.097 <0.0001 0.182 0.321
Generalized Priddle (GP) C 4.490E−06 4.647E−07 9.663 <0.0001 3.575E−06 5.406E−06
n 1.871 3.679E−02 50.849 <0.0001 1.798 1.943
m 0.280 3.212E−02 8.721 <0.0001 0.217 0.343
Generalized NASGRO (GN) C 5.496E−11 4.132E−12 13.300 <0.0001 4.682E−11 6.310E−11
n 3.016 3.076E−02 98.066 <0.0001 2.956 3.077
m 0.459 2.145E−02 21.410 <0.0001 0.417 0.501
Table 4b
Statistical properties of FCGR models, 7475-T7351, 0% pre-strain
Model SSE S.E. MSE F R2 R2adj
Generalized Collipriest (GC) 25.0316 0.3189 0.1018 1253.9 0.9107 0.9099
General Priddle (GP) 19.7155 0.2831 0.0801 1625.2 0.9296 0.9291
General NASGRO (GN) 5.8494 0.1542 0.0238 5769.4 0.9791 0.9790
Table 5a
Estimated parameters of FCGR models, 7475-T7351, 3% pre-strain
Model Parameter Estimate S.E. t-Value p-Value 95% LCL 95% UCL
Generalized Collipriest (GC) C 2.727E−10 2.147E−11 12.704 <0.0001 2.306E−10 3.149E−10
n 2.499 2.908E−02 85.966 <0.0001 2.443 2.557
m 0.473 2.276E−02 20.772 <0.0001 0.428 0.517
Generalized Priddle (GP) C 9.368E−06 5.276E−07 17.755 <0.0001 8.331E−06 1.040E−05
n 2.037 2.004E−02 101.588 <0.0001 1.997 2.076
m 0.502 2.001E−02 25.086 <0.0001 0.463 0.541
Generalized NASGRO (GN) C 6.267E−11 2.951E−12 21.238 <0.0001 5.687E−11 6.847E−11
n 3.109 1.995E−02 155.914 <0.0001 3.071 3.149
m 0.582 1.423E−02 40.933 <0.0001 0.554 0.611
The influence ofR onKth can be described by the most
popular empirical equation proposed by Klesnil and Luk´aˇs[30]:
Kth,R=Kth,0(1−R)γ (10)
whereKth,Ris the threshold stress intensity factor range for a
givenR,Kth,0is the threshold value forR= 0, which equalsK0,
and theγvalue is between 0 and 1. The objective of Eq.(10)is to estimateK0being used as a fixed parameter in the generalized
fitting models.
In Eqs.(7)–(9),Ris an independent variable; it implies that two or more FCGR data sets collected at differentRratios can be joined for the statistical analysis. Hence, the generalized fitting
models(7)–(9)may be used to interpolate FCGR forRratios that were not considered in the testing program, thereby reducing both time and cost.
3.3.2. Model fitting
Eqs. (2)–(4) and (7)–(9) are nonlinear regression mod-els. A nonlinear model has at least one parameter (quantity to be estimated) that appears nonlinearly [31]. Nonlinear regression is an iterative procedure, and the basis used for estimating the unknown parameters is the criterion of least-squares. The fitting was carried out using a routine based on the Marquardt–Levenberg algorithm[32]. The fitting pro-cedure provides (i) parameters, (ii) error estimate on the
Table 5b
Statistical properties of FCGR models, 7475-T7351, 3% pre-strain
Model SSE S.E. MSE F R2 R2adj
Generalized Collipriest (GC) 28.7749 0.2431 0.0591 3997.9 0.9426 0.9424
General Priddle (GP) 21.4729 0.2099 0.0441 5440.3 0.9572 0.9570
Table 6a
Estimated parameters of FCGR models, 7475-T7351, 5% pre-strain
Model Parameter Estimate S.E. t-Value p-Value 95% LCL 95% UCL
Generalized Collipriest (GC) C 3.956E−10 5.173E−11 7.647 <0.0001 2.936E−10 4.976E−10
n 2.308 4.761E−02 48.467 <0.0001 2.214 2.402
m 0.388 5.601E−02 6.936 <0.0001 0.278 0.499
Generalized Priddle (GP) C 4.240E−06 4.407E−07 9.621 <0.0001 3.371E−06 5.109E−06
n 1.884 3.393E−02 55.538 <0.0001 1.817 1.951
m 0.424 4.953E−02 8.565 <0.0001 0.327 0.522
Generalized NASGRO (GN) C 8.879E−11 7.049E−12 12.597 <0.0001 7.490E−11 1.027E−10
n 2.905 3.437E−02 84.528 <0.0001 2.837 2.973
m 0.475 3.051E−02 15.557 <0.0001 0.415 0.535
Table 6b
Statistical properties of FCGR models, 7475-T7351, 5% pre-strain
Model SSE S.E. MSE F R2 R2adj
Generalized Collipriest (GC) 20.9811 0.3161 0.0999 1196.1 0.9193 0.9185
General Priddle (GP) 16.4431 0.2798 0.0783 1555.2 0.9367 0.9362
General NASGRO (GN) 6.2933 0.1731 0.0299 4232.7 0.9758 0.9756
SSE: sum of squares of error; S.E.: standard error of the residual; MSE: mean squared error;R2: coefficient of determination;R2
adj: adjusted coefficient of determination; LCL: lower confidence limit; UCL: upper confidence limit.
parameter, and (iii) a statistical measure of goodness of fit.
The least-squares criterion quantifies goodness of fit as the sum of squares of the vertical distances of the data points from the assumed model. That is, the best model for a particular data set is that with the smallest sum of squares. In fact, it is not sim-ple to compare models with different parameters. The problem is that a more complicated model (more parameters) gives more flexibility (more inflection points) for the curve being generated than the curve being defined by a simpler model (fewer parame-ters). Thereby, the sum of squares of a more complicated model tends to be lower.
To show the effect ofRon FCGR, Eqs.(7)–(9)were used for the nonlinear regression analysis. Both GC and GP models use three parameters (C,n,m), while the GN model contains five parameters (C,n,m,p,q). The objective ofpandqis to provide a better fit to data in near-threshold and accelerated regions, respectively. The parametersp and q may be fixed, reducing the model parameters to three. For metallic materials, since the values ofpandqare between 0 and 1, they were chosen by trial and error to be 0.20 and 0.80, respectively. Finally,C,n, and
mof the selected models may be estimated using a nonlinear regression analysis.
The estimated parameters and the statistical properties for FCGR models are presented inTables 4–6. The experimental data and the estimated curves are shown inFigs. 3–5.
For the cases of 0%, 3%, and 5% pre-strain, a visual exami-nation of the fitting curves reveals that the GC and GP models fit the FCGR data in a similar fashion; however, the latter fits relatively better than the former. The GN model offers the best approximation of the data (Figs. 3–5).
FromTables 4a–6a, at the 0.05 level of significance, it may be concluded that the estimated parameters (C,n,m) are statistically
Fig. 3. FCGR comparative curves of 7475-T7351, 0% pre-strain.
Fig. 5. FCGR comparative curves of 7475-T7351, 5% pre-strain.
significant, since their p-values are smaller than the level of significance. The estimated parameters of the GN model are the most significant parameters. This may be confirmed by an examination of the t-value of the estimate. The t-value is the ratio of the estimate to its standard error, the latter being used to compute confidence band of the estimate.
Generally, a hight-value indicates that the estimate is well determined in the model and the confidence band will be narrow.
Conversely, a lowt-value indicates that the estimate is poorly determined and the confidence band will be wide. An indication of high or lowt-value of an estimate depends on the related
p-value (probability) and significance level used. For a given significance level, an estimate is statistically significant when its t-value is high enough to provide a p-value less than the selected level of significance.
3.3.3. Model validation
There are many graphical and numerical tools to assist good-ness of fit of a model used with experimental data[33,34]. The most common approach is to examine the residual.
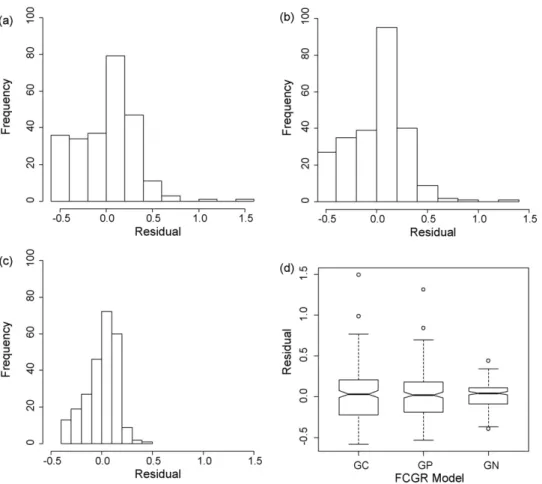
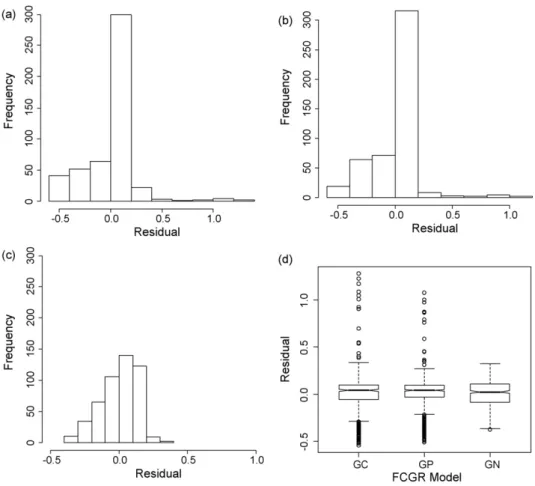
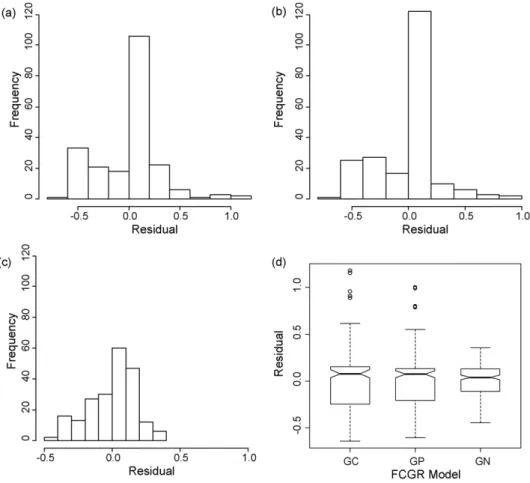
The histogram plots presented inFigs. 6–8suggest that the residuals (measured−predicted) of the GN model appear to be normally distributed. This desirable result indicates that the GN model is satisfactory.
Figs.6d–8d illustrate side-by-side box plots of the residual data of the FCGR models. For the case of 0% pre-strain, at the 0.05 level of significance, using Kruskal–Wallis one way analysis of variance on ranks[34], no a statistically significant difference was found in the median values of residuals for the FCGR models. The same is true for 3% and 5% pre-strain cases. However, the variability in the residual data obtained from the GC model appears much greater than that from the GP model. In addition, outliers (extreme values) as indicated by the (o) symbols were detected. Due to the small range of the whiskers
Fig. 7. Residual data of FCGR models, 7475-T7351, 3% pre-strain; (a) generalized Collipriest model (GC), (b) generalized Priddle model (GP), (c) generalized NASGRO model (GN), and (d) box plot.
and length of the box, it may be concluded that the GN model is the most approximating model to the data.
To assess the model goodness of fit, several statistical numer-ical measures may be checked such asR2,R2adj,F, S.E., MSE, Schwarz’s Bayesian Information Criterion (BIC), and Akaike’s Information Criterion (AIC)[35,36]. TheR2statistic is a poor measure for model validation because adding an extra variable to a model will always increaseR2even if the variable is completely unrelated to the response variable. TheR2adjstatistic adjustsR2
for the number of parameters in model. A model that maximizes
R2adjmay be chosen. Large value ofF, small values of S.E. and MSE indicate that the model explains the data well.Tables 4b–6b suggest that the GP model provides a better fit than the GC. On the other hand, the GN model seems to be the best approximating model to the data.
3.4. Effect of R ratio and pre-strain on FCGR
The GN model provides a better fit to the FCGR data when compared with the other two models. Hence, it is used to illus-trate the effects of pre-strain andRratio. Generally,Figs. 9 and 10 show that pre-straining relatively causes an increase in FCGR in the threshold region. However, an increase in pre-strain level has no appreciable influence in the Paris region, since this region is less sensitive to microstructural alterations as a result of the pre-strain applied. In the unstable region, an increase in pre-pre-strain
from 0% to 5% causes a reduction of 17% in material fracture toughness (Table 3) and consequently alters the FCGR.
Table 7 shows the results of the threshold stress intensity factor range (Kth) tests of 7475-T7351 for all cases of
pre-strain studied. At the same pre-pre-strain condition,Kthdecreases
with increasing the R ratio; for 0% pre-strain, a reduction of 28% inKthis observed with increasing theRratio from 0.1
to 0.5. AtR= 0.1,Kthdecreases with an increase in pre-strain
level; a pre-straining of 5% causes a reduction of 19% inKth. However, atR= 0.5, a clear relation was not found; the average of the threshold values for pre-straining conditions was determined as 1.38 MPa√m with a coefficient of variation of 0.07.
Several researchers have reported the influence ofRratio on near-threshold FCGR in many alloy systems[37–49]. It has been shown that the phenomenon of crack closure plays an important role in near-threshold crack growth. At low stress intensities, crack opening displacements (COD) are relatively small. Thus,
Table 7
Fatigue threshold values of 7475-T7351
Pre-strain level Kth(MPa√m)
R= 0.1 R= 0.5
0% 1.81 1.31
3% 1.65 1.45
Fig. 8. Residual data of FCGR models, 7475-T7351, 5% pre-strain; (a) generalized Collipriest model (GC), (b) generalized Priddle model (GP), (c) generalized NASGRO model (GN), and (d) box plot.
any oxide debris or microstructural feature (roughness) with a size comparable to the COD will promote early contact of the crack surfaces and result in crack closure. Moreover, the mode II displacements characteristic of near-threshold crack growth behavior enhances roughness-induced crack closure and accel-erates the formation of oxide debris. Consequently, any factor that contributes to minimize the premature contact between the mating crack faces (for example: highRratio) also contributes to decreaseKth.
Fig. 9. Effect of pre-strain on the FCGR in 7475-T7351,R= 0.1, GN model.
Different models have been proposed to explain the effect of pre-strain on near-threshold FCGR. One dislocation-based model [15] assumes that Kth is determined by the critical
stress at the crack tip necessary to operate the nearest dislo-cation source. The effect of pre-straining is then considered to be due to a decrease of the distance between the crack tip and the nearest active dislocation source. Other dislocation-based model[15]assumes that the crack growth process is a repeti-tion of microcrack nuclearepeti-tion within the slip bands at the crack
tip caused by accumulated fatigue damage. The initially higher dislocation density in the pre-strained materials would intensify the plastic activity in the plastic zone, speeding up the accu-mulation of fatigue damage in the slip bands. As a result, the internal resistance towards crack advance should diminish and a decrease inKthshould therefore occur.
Crack closure can also be used to explain the effect of pre-strain on near-threshold FCGR[50–53]. In this case, the crack closure values of pre-strained materials go down as compared to the corresponding non pre-strained materials. These behav-iors might be explained mainly by the change of the surface roughness of fatigue fractures. On the other hand, since crack closure is negligible at high values ofR,Kthis less affected by
pre-strain level at higher values ofR.
3.5. Fractography
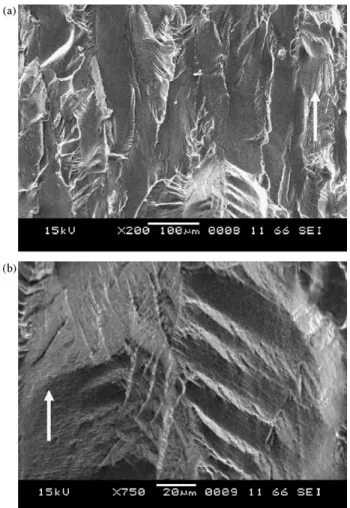
At near-threshold level and at R= 0.1, the scanning elec-tron microscope (SEM) micrographs of fatigue fracture surfaces for the specimen without pre-strain (Fig. 11) revealed a flat, faceted appearance that resembles cleavage. The crack appar-ently follows specific crystallographic planes, and changes directions when it encounters a barrier such as a grain boundary.
Fig. 11. SEM micrographs of the fracture surfaces at the near-threshold level, 7475-T7351,R= 0.1, 0% pre-strain, (a) 200×, and (b) 750×. Arrow indicates the direction of crack propagation.
Fig. 12. SEM micrographs of the fracture surfaces in the linear FCGR region, 7475-T7351,R= 0.1, 0% pre-strain, (a) 400×, and (b) 2000×. Arrow indicates the direction of crack propagation.
This mechanism confirms the operation of the phenomenon of roughness-induced closure in this particular region. On the other hand, in the higherKregion, the fracture surface was distinctly smoother than at near-threshold level, and ductile striations were the dominant features (Fig. 12). These two different mechanisms
Fig. 14. SEM micrograph of the fracture surface at the near-threshold level, 7475-T7351,R= 0.1, 5% pre-strain, 200×. Arrow indicates the direction of crack propagation.
of crack growth were also observed in the pre-strained specimens at bothRratios.
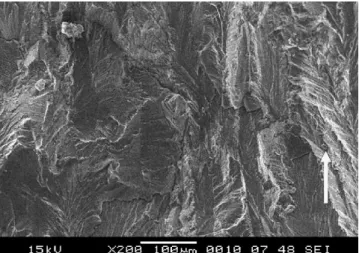
At near-threshold level and atR= 0.5, the SEM micrograph of fatigue fracture surface for the specimen without pre-strain is shown inFig. 13. IfFigs. 11 and 13are compared, it is possible to conclude that higherR ratio promotes a smoother fracture surface. This conclusion indicates a change in the crack closure mechanism. The same result is obtained when the effect of pre-strain is considered (Fig. 14).
4. Conclusions
Fatigue crack growth rate in pre-strained 7475-T7351 alu-minum alloy plate was evaluated in air and at room temperature under constant amplitude loading at stress ratios of 0.1 and 0.5, using compact tension specimens. To show the effect of stress ratio (R) on FCGR, Walker equivalent stress intensity factor model was used. Consequently, generalized Collipriest (GC), generalized Priddle (GP), and generalized NASGRO (GN) mod-els were developed and fitted to the FCGR data. The generalized fitting models may be used to interpolate FCGR forRratios that were not considered in the testing program, thereby reducing both time and cost. For model validation, different commonly used graphical plots and statistical numerical measures were presented. From the results obtained, the following conclusions can be drawn:
1. The effect of pre-strain may be seen in the unstable region, region III, where the increase of pre-strain leads to decrease material fracture toughness, thereby, increasing the FCGR. The pre-strain has no considerable influence in the Paris region. In the near-threshold region, atR= 0.1,Kth
decreases with an increase in pre-strain level. On the other hand, atR= 0.5, a clear relation was not found.
2. Both generalized Collipriest and generalized Priddle models fit the FCGR data in a similar fashion. However, the latter provides a better fit than the former.
3. The generalized NASGRO (GN) model provides the best fit to the FCGR data as compared with the generalized Colli-priest (GC) and generalized Priddle (GP) models. Therefore, this model may be suggested for use in critical applications, such as aeronautical structural design.
References
[1] I.J. Polmear, Light Alloys: Metallurgy of the Light Metals, second ed., Edward Arnold, 1989.
[2] H. Buhl (Ed.), Advanced Aerospace Materials, Springer, 1992.
[3] J.-P. Imarigeon, R.T. Holt, A.K. Koul, L. Zhao, W. Wallace, J.C. Beddoes, Mater. Charact. 35 (1994) 41–67.
[4] E.A. Starke Jr., J.T. Staley, Prog. Aerospace Sci. 32 (1996) 131– 172.
[5] J.C. Williams, E.A. Starke Jr., Acta Mater. 51 (2003) 5775–5799. [6] W. Wallace, D.W. Hoeppner, P.V. Kandachar, Aircraft corrosion: causes
and case histories, AGARD AG 278, vol. 1, 1985.
[7] G.H. Koch, Fatigue and Fracture, ASM Handbook, vol. 19, 1996, pp. 483–506.
[8] H. Vogt, M.O. Speidel, Corros. Sci. 40 (1998) 251–270. [9] B.W. Lifka, Aluminum 53 (1977) 750–752.
[10] D.O. Sprowls, E.H. Spuhler, Avoiding Stress-corrosion Cracking in High Strength Aluminum Alloy Structures, Alcoa Green Letter, Alcoa, January 1982.
[11] S.J. Cieslak, P.L. Mehr, Alcoa 7475 Sheet and Plate, fourth revised ed., Alcoa Green Letter, 1985.
[12] A. Smolej, M. Gnamus, E. Slacek, J. Mater. Process. Technol. 118 (2001) 397–402.
[13] V.M. Radhakrishnan, P.S. Baburamani, Mater. Sci. Eng. 17 (1975) 283–288.
[14] J. Schijve, Eng. Fracture Mech. 8 (1976) 575–581. [15] J. Was´en, B. Karlsson, Int. J. Fatigue 11 (1989) 395–405. [16] L. Nian, D. Bai-Ping, Int. J. Fatigue 14 (1992) 41–44. [17] ASTM E8, Annual Book of ASTM Standards, ASTM, 2001. [18] ASTM E647, Annual Book of ASTM Standards, ASTM, 2001. [19] ASTM E561, Annual Book of ASTM Standards, ASTM, 2001. [20] P.K. Liaw, J.D. Landes, Fracture Mechanics, Eighteenth Symposium, vol.
945, ASTM STP, 1988, pp. 622–646.
[21] I. Bar-On, F.R. Tuler, W.M. Howerton, Nonfracture Mechanics, Vol. II—Elastic-Plastic Fracture, vol. 995, ASTM STP, 1989, pp. 244–258. [22] W.A. Cassada, Proc. 3rd Intl. Conference Aluminum Alloys, SINTEF, vol.
1, 1992, pp. 243–248.
[23] S.D. Antolovich, Fatigue and Fracture, ASM Handbook, vol. 19, 1996, pp. 27–41.
[24] P.C. Paris, F. Erdogan, J. Basic Eng. Dec. (1963) 528–534. [25] J.E. Collipriest, ASME (1972) 43–61.
[26] J.E. Collipriest, R.M. Ehret, C. Thatcher, NASA Technology Utilization Report, MFS-24447, 1973.
[27] T.L. Anderson, Fracture Mechanics: Fundamentals and Applications, sec-ond ed., CRC Press, 1995.
[28] R.G. Forman, S.R. Mettu, Behavior of Surface and Corner Cracks Subjected to Tensile and Bending Loads in Ti-6Al-4V Alloy, vol. 1131, ASTM STP, 1992, pp. 519–546.
[29] E.K. Walker, The Effect of Stress Ratio During Crack Propagation and Fatigue for 2024-T3 and 7075-T6 Aluminum: Effect of Environment and Complex Load History on Fatigue Life, vol. 462, ASTM STP, 1970, pp. 1–14.
[30] M. Klesnil, P. Luk´aˇs, Fatigue of Metallic Materials, second revised ed., Elsevier Science, 1992, p. 120.
[31] D.M. Bates, D.G. Watts, Nonlinear Regression Analysis and its Applica-tions, John Wiley & Sons, 1988.
[32] D.W. Marquardt, J. Soc. Ind. Appl. Math. 11 (1963) 431–441.
[33] J.M. Chambers, W.S. Cleveland, B. Kleiner, P.A. Tukey, Graphical Methods for Data Analysis, Duxbury Press, 1983.
[35] K.P. Burnham, D.R. Anderson, Model Selection and Multimodel Inference: A Practical Information-theoretic Approach, second ed., Springer, 2002. [36] K.S. Al-Rubaie, L.B. Godefroid, J.A.M. Lopes, Int. J. Fatigue 29 (2007)
931–940.
[37] K.D. Unangst, T.T. Shih, R.P. Wei, Eng. Fracture Mech. 9 (1977) 725–734. [38] R.D. Brown, J. Weertman, Eng. Fracture Mech. 10 (1978) 757–771. [39] R.J. Stofanak, R.W. Hertzberg, G. Miller, R. Jaccard, K. Donald, Eng.
Fracture Mech. 17 (1983) 527–539.
[40] P.K. Liaw, T.R. Leax, W.A. Logsdon, Acta Metall. 31 (1983) 1581–1587. [41] V.B. Dutta, S. Suresh, R.O. Ritchie, Metall. Trans. 15A (1984) 1193–1207. [42] P.E. Bretz, J.I. Petit, A.K. Vasudevan, Fatigue Crack Growth Threshold
Concepts, The Metallurgical Society/AIME, 1984, pp. 163–183. [43] A.F. Blom, Fatigue Crack Growth Threshold Concepts, The Metallurgical
Society/AIME, 1984, pp. 263–279.
[44] E. Zaiken, R.O. Ritchie, Metall. Trans. 16A (1985) 1467–1477. [45] R.O. Ritchie, W. Yu, A.F. Blom, D.K. Holm, Fatigue Fracture Eng. Mater.
Struct. 10 (1987) 343–362.
[46] K. Tanaka, Mechanics and Micromechanics of Fatigue Crack Propagation, vol. 1020, ASTM STP, 1989, pp. 151–183.
[47] M.J. Couper, J.R. Griffiths, Fatigue Fracture Eng. Mater. Struct. 13 (1990) 615–624.
[48] A.J. McEvily, Fatigue and Fracture, ASM Handbook, vol. 19, 1996, pp. 134–152.
[49] S.A. Padula II., A. Shyam, R.O. Ritchie, W.W. Milligan, Int. J. Fatigue 21 (1999) 725–731.
[50] D.W. Chung, M.C. Chaturvedi, Mater. Sci. Eng. 48 (1981) 27–34. [51] K.S. Ravishandran, H.C.V. Rao, E.S. Dwarakadasa, C.G.K. Nair, Metall.
Trans. 18A (1987) 865–876.
[52] S.K. Putatunda, Eng. Fracture Mech. 30 (1988) 627–639.