Infrared and Raman spectroscopic characterization of the phosphate mineral
fairfieldite – Ca
2
(Mn
2+
,Fe
2+
)
2
(PO
4
)
2
2(H
2
O)
Ray L. Frost
a,⇑, Yunfei Xi
a, Ricardo Scholz
b, Fernanda Maria Belotti
c, Andres Lopez
aaSchool of Chemistry, Physics and Mechanical Engineering, Science and Engineering Faculty, Queensland University of Technology, GPO Box 2434, Brisbane, Queensland 4001, Australia bGeology Department, School of Mines, Federal University of Ouro Preto, Campus Morro do Cruzeiro, Ouro Preto, MG 35,400-00, Brazil
cFederal University of Itajubá, Campus Itabira, Itabira, MG 35,903-087, Brazil
h i g h l i g h t s
"We have studied fairfieldite from
Cigana mine of the Eastern Brazilian Pegmatite Province in Minas Gerais.
"The chemical formula was
determined using an electron probe.
"Vibrational spectroscopy was used
to determine the structure.
"Multiple bands in antisymmetric
stretching spectral region provide evidence of symmetry reduction of the phosphate anion.
g r a p h i c a l
a b s t r a c t
a r t i c l e
i n f o
Article history:
Received 28 November 2012 Accepted 8 January 2013 Available online 17 January 2013
Keywords: Raman spectroscopy Fairfieldite Infrared spectroscopy Phosphate
Pegmatite
a b s t r a c t
Raman spectroscopy complimented with infrared spectroscopy has been used to determine the molecu-lar structure of the phosphate mineral fairfieldite. The Raman phosphateðPO4Þ3stretching region shows
strong differences between the fairfieldite phosphate minerals which is attributed to the cation substitu-tion for calcium in the structure. In the infrared spectra complexity exists with multipleðPO4Þ2
antisym-metric stretching vibrations observed, indicating a reduction of the tetrahedral symmetry. This loss of degeneracy is also reflected in the bending modes. Strong Raman bands around 600 cm1are assigned
tom4phosphate bending modes. Multiple bands in the 400–450 cm1region assigned tom2phosphate
bending modes provide further evidence of symmetry reduction of the phosphate anion. Three broad-bands for fairfieldite are found at 3040, 3139 and 3271 cm1and are assigned to OH stretching bands.
By using a Libowitzky empirical equation hydrogen bond distances of 2.658 and 2.730 Å are estimated. Vibrational spectroscopy enables aspects of the molecular structure of the fairfieldite to be ascertained.
Ó2013 Elsevier B.V. All rights reserved.
Introduction
The fairfieldite mineral group are triclinic arsenates and phos-phates of the general formula Ca2B(XO4)22H2O where B is Co, Fe2+, Mg, Mn, Ni, Zn and X is either As or P[1–6]. The minerals form two subgroups based upon whether the anion is phosphate or arsenate. Minerals in this group include cassidyite [Ca2(Ni, Mg)
(PO4)22H2O], collinsite [Ca2(Mg,Fe2+)(PO4)2
2H2O], fairfieldite [Ca2(Mn,Fe2+)(PO4)22H2O], gaitite [Ca2Zn(AsO4)22H2O], messelite [Ca2(Mn2+,Fe2+)(PO4)2
2H2O], parabrandite [Ca2Mn2+(AsO4)2
2H2O], roselite-beta [Ca2Co(AsO4)22H2O], and talmessite [Ca2Mg(AsO4)2
2H2O]. The minerals form solid solutions for example the collinsite–fairfieldite series. Many of these minerals are found in Australia[7–9].
The structure of the fairfieldite group minerals is dominated by the chains of tetrahedra (XO4) and octahedra [B-O4(H2O)2] which parallel theCaxis. The fairfieldite group crystallizes in the triclinic
1386-1425/$ - see front matterÓ2013 Elsevier B.V. All rights reserved. http://dx.doi.org/10.1016/j.saa.2013.01.008
⇑Corresponding author. Tel.: +61 7 3138 2407; fax: +61 7 3138 1804. E-mail address:[email protected](R.L. Frost).
Contents lists available atSciVerse ScienceDirect
Spectrochimica Acta Part A: Molecular and
Biomolecular Spectroscopy
space groupP1: The cation octahedra are compressed resulting in disorder of the chains. This affects the hydrogen bonding of the water in the structure. The amount of published data on the Raman spectra of mineral phosphates is limited[10–14]. There has been limited published data on the fairfieldite mineral group[15–17]. The Raman spectra of the hydrated hydroxy phosphate minerals
have not been reported. In aqueous systems, Raman spectra of phosphate oxyanions show a symmetric stretching mode (
m
1) at 938 cm1, the antisymmetric stretching mode (m
3) at 1017 cm1, the symmetric bending mode (m
2) at 420 cm1and them
4mode at 567 cm1[12,13,18]. S.D. Ross in Farmer[19](p404) listed some well-known minerals containing phosphate which were either hy-drated or hydroxylated or both[19]. Farmer (p392) listed the band positions of collinsite, one of the fairfieldite minerals. The
m
1ðPO4Þ3 symmetric stretching vibration was listed as 945 and 920 cm1; the
m
3 ðPO4Þ3 symmetric stretching vibrations as 1112 and 1000 cm1, the
m
4 bending modes as 577 and 562 cm1. A band at 770 cm1was observed but not assigned. In comparison the value for the
m
1 symmetric stretching vibration of PO4units as determined by infrared spectroscopy was given as 930 cm1(augelite), 940 cm1(wavellite), 970 cm1 (rockbridge-ite), 995 cm1(dufrenite) and 965 cm1(beraunite). The position of the symmetric stretching vibration is mineral dependent and a function of the cation and crystal structure. The fact that the sym-metric stretching mode is observed in the infrared spectrum af-firms a reduction in symmetry of the PO4units.Fairfieldite is a common calcium and manganese hydrate phos-phate mineral in granitic pegmatites. The general chemical formula of fairfieldite is expressed by Ca(Mn2+,Fe2+)(PO4)2
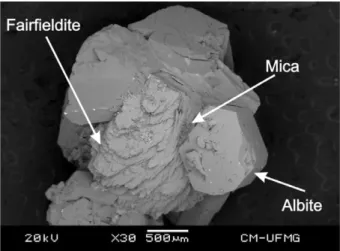
2(H2O)[20]. The mineral forms a series with collinsite, its Mg2+analogous, in substi-tution to manganese. Fairfieldite belongs to the homonymous group that includes a number of phosphates and arsenates such as talmessite, messelite, gaitite and collinsite among others. The Fig. 1.A backscattered electron image (BSI) of a fairfieldite single crystal up to
0.5 mm in length.
Fig. 2.EDS analysis of fairfieldite. Table 1
Chemical composition of fairfieldite from Cigana pegmatite, Minas Gerais. H2O calculated by stoichiometry on the basis of ideal formula.
Sample P2O5 CaO MnO FeO MgO Na2O Al2O3 SrO CuO ZrO H2O Total
SAA-099 38.64 30.53 10.93 2.19 3.69 0.03 0.01 0.02 0.02 0.02 9.97 96.09
Fairfieldite* 39.32 31.07 9.87 – – – – – – – 9.97 100.00
Collinsite* 42.96 33.95 – – 12.20 – – – – – 10.90 100.00
P Ca Mn Fe Mg Na Al Sr Cu Zr H Total
SAA-099 1.99 1.99 0.56 0.11 0.33 0.00 0.00 0.00 0.00 0.00 2.02 7.00
Fairfieldite* 2.00 2.00 1.00 0.00 0.00 0.00 0.00 0.00 0.00 0.00 2.00 7.00
Collinsite* 2.00 2.00 0.00 0.00 1.00 0.00 0.00 0.00 0.00 0.00 2.00 7.00
mineral was first described by Brush and Dana in 1879 from Fair-field County, Connecticut, USA[21]. Other occurrences were later described in the Cigana mine, Brazil [22]; Tanco mine, Canada [23]and Barroso-Alvão pegmatite, Portugal[24]. The crystal struc-ture of fairfieldite was refined by Fanfani et al.[3]. The mineral crystallizes in the triclinic crystal system, space group P1 with unit cell parameter a= 5.78Å, b= 6.57Å, c= 5.48Å,
a
= 102.08°, b= 108.71°andc
= 90.09°.Studies concerning the mineralogy of phosphates of the fairfiel-dite group minerals are rare in literature [25] and to the best knowledge of the authors, data about vibrational spectroscopic characterization are restricted to the database of the University of Arizona (rruff.info), however no interpretation is given. No Raman spectroscopic investigation of these phosphate phases re-lated to the leucophosphite group has been published. However, in recent years, the application of spectroscopic techniques to understand the structure of phosphates has been increasing[26– 28]. In this work, samples of fairfieldite from the Cigana pegmatite, located in the municipality of Conselheiro Pena, Brazil have been selected for study. These studies include chemistry with analysis
via electron microprobe (EMP) in the WDS mode and the spectro-scopic characterization of the structure with infrared and Raman.
Experimental
Samples description and preparation
The fairfieldite sample studied in this work was collected from the Cigana mine (also named as Jocão mine), a lithium-bearing pegmatite located in the Conselheiro Pena Pegmatite district (CPD), one of the eleven metallogenetic subdivisions of the Eastern Brazilian Pegmatite Province (EBP) in Minas Gerais[29]. The Cig-ana mine is an important source for rare and unusual phosphate and industrial minerals (microcline, triphylite and spodumene)
In the Cigana mine, white crystals of fairfieldite and aggregates up to 3.0 mm occur in association with pyrite, quartz, albite and muscovite. The collected sample was incorporated to the collection of the Geology Department of the Federal University of Ouro Preto, Minas Gerais, Brazil, with sample code SAA-099. The sample was gently crushed and the associated minerals were removed under
a stereomicroscope Leica MZ4. Scanning electron microscopy (SEM) was applied to support the chemical characterization and indicate the elements to be analyzed by EMP.
Scanning electron microscopy (SEM)
Experiments and analyses involving electron microscopy were performed in the Center of Microscopy of the Universidade Federal de Minas Gerais, Belo Horizonte, Minas Gerais, Brazil (http:// www.microscopia.ufmg.br).
Fairfieldite crystal aggregate was coated with a 5 nm layer of evaporated Au. Secondary Electron and Backscattering Electron images were obtained using a JEOL JSM-6360LV equipment. Qual-itative and semi-quantQual-itative chemical analysis in the EDS mode were performed with a ThermoNORAN spectrometer model Quest and was applied to support the mineral characterization.
Electron microprobe analysis (EMP)
The quantitative chemical analysis of fairfieldite single crystal was carried via EMP. The chemical analysis was carried out with a JEOL JXA-8230 spectrometer from the Laboratório de
Micross-onda Eletrônica, Instituto de Geociências, Universidade de Brasília (IG/UnB), Brasília. For each selected element was used the follow-ing standards: Fe and Mg – Olivin, Mn – Rodhonite, P and Ca – Apa-tite Artimex, Al – Corundum, Na – Albite, Sr – CelesApa-tite, Cu – Chalcopyrite and Zr – Baddeleyite. The epoxy embedded fairfieldite crystal was polished in the sequence of 9
l
m, 6l
m and 1l
mdia-mond paste MetaDIÒ
II Diamond Paste – Buhler, using water as a lubricant, with a semi-automatic MiniMetÒ1000 Grinder-Polisher
– Buehler. Finally, the epoxy embedded sample was coated with a thin layer of evaporated carbon. The electron probe microanalysis in the WDS (wavelength dispersive spectrometer) mode was ob-tained at 15 kV accelerating voltage and beam current of 10 nA. Chemical formula was calculated on the basis of seven oxygen atoms (O and H2O).
Raman microprobe spectroscopy
Crystals of fairfieldite were placed on a polished metal surface on the stage of an Olympus BHSM microscope, which is equipped with 10, 20, and 50objectives. The microscope is part of a Renishaw 1000 Raman microscope system, which also includes a
monochromator, a filter system and a CCD detector (1024 pixels). The Raman spectra were excited by a Spectra-Physics model 127 He–Ne laser producing highly polarized light at 633 nm and col-lected at a nominal resolution of 2 cm1 and a precision of ±1 cm1in the range between 200 and 4000 cm1. Repeated acqui-sitions on the crystals using the highest magnification (50) were accumulated to improve the signal to noise ratio of the spectra. Ra-man Spectra were calibrated using the 520.5 cm1line of a silicon wafer. The Raman spectrum of at least 10 crystals was collected to ensure the consistency of the spectra.
Infrared spectroscopy
Infrared spectra were obtained using a Nicolet Nexus 870 FTIR spectrometer with a smart endurance single bounce diamond ATR cell. Spectra over the 4000–525 cm1 range were obtained by the co-addition of 128 scans with a resolution of 4 cm1and a mirror velocity of 0.6329 cm/s. Spectra were co-added to improve the signal to noise ratio. The infrared spectra are given in the sup-plementary information.
Spectral manipulation such as baseline correction/adjustment and smoothing were performed using the Spectracalc software package GRAMS (Galactic Industries Corporation, NH, USA). Band component analysis was undertaken using the Jandel ‘Peakfit’ soft-ware package that enabled the type of fitting function to be se-lected and allows specific parameters to be fixed or varied accordingly. Band fitting was done using a Lorentzian–Gaussian cross-product function with the minimum number of component bands used for the fitting process. The Gaussian–Lorentzian ratio was maintained at values greater than 0.7 and fitting was under-taken until reproducible results were obtained with squared corre-lations ofr2greater than 0.995.
Results and discussion
Chemical characterization
The SEM image of fairfieldite sample studied in this work is shown inFig. 1. Fairfieldite crystal aggregates shows tabular form. The mineral occurs in association with albite and microcrystals of
mica. Qualitative chemical analysis shows Ca and Mn phosphate with minor amounts of Mg and Fe (Fig. 2). The quantitative chemical analysis of fairfieldite is presented in Table 1. H2O content was calculated by stoichiometry and the chemical formula was calculated on the basis of 7 O atoms (O and H2O). The chemical formula can be expressed as: (Ca)1.99(Mn0.56Mg0.33 Fe0.11)P1.00(PO4)1.992.02(H2O).
Vibrational spectroscopy
Factor group analysis
In the crystal structure of the fairfieldite-type minerals there are four phosphate units in the unit cell. These are of space group C2/m (Z = 2), therefore there exists one formula unit per primitive unit cell, thus 37 atoms in the primitive unit cell.
3n-3?3⁄37 – 3 = 108 normal modes of vibrations made up of
18 internal phosphate modes + 24 internal water modes + 69 lat-tice modes-3 translations equalling 108 modes of vibration. It is therefore predicted that there are 18 vibrationally active modes
for the PO4 internal modes of phosphate in the fairfieldite structure,
m
11 Raman (Ag), 1 IR(Bu)m
22 Raman (Ag, Bg), 2 IR(Au, Bu)m
33 Raman(2Ag, Bg), 3 IR(Au, 2Bu)m
43 Raman(2Ag, Bg), 3 IR(Au, 2Bu)For water, it is predicted that there are 24 vibrationally active internal modes of water, eight Raman active stretch (4Ag, 4Bg), eight IR active stretch (4Au, 4Bu), four Raman active bends (2Ag, 2Bg), four IR active bends (2Au, 2Bu). The irreducible representation for the entire structure of the lattice vibrations of the vivianite phosphates isC= 16Au+ 17Bu+ 15Ag+ 15Bgignoring translational modes.
Spectroscopy
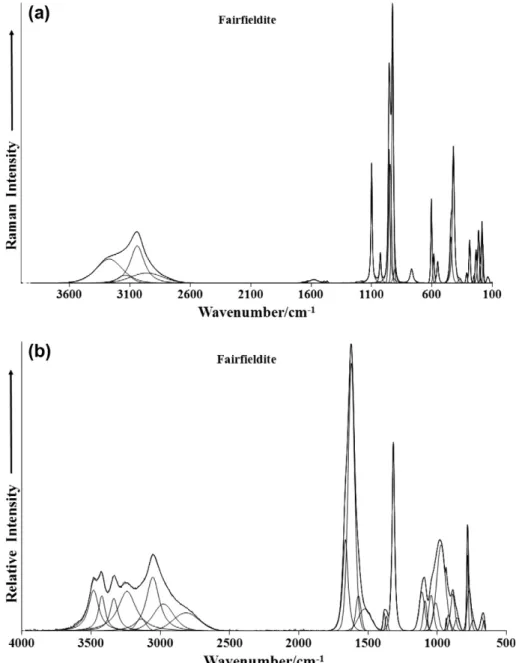
The spectra of fairfieldite over the complete wavenumber range in the Raman and infrared spectra are provided in Fig. 3. These
figures show the position and the relative intensities of the bands in the Raman and infrared spectrum of fairfieldite. The Raman spectrum over the 100–4000 cm1 spectral range is given in Fig. 3a. It is apparent that there are large parts of the spectrum where no intensity is observed. Therefore, the spectrum is subdi-vided into subsections depending upon the type of vibration being studied. The infrared spectrum over the 500–4000 cm1spectral range is displayed inFig. 3b.
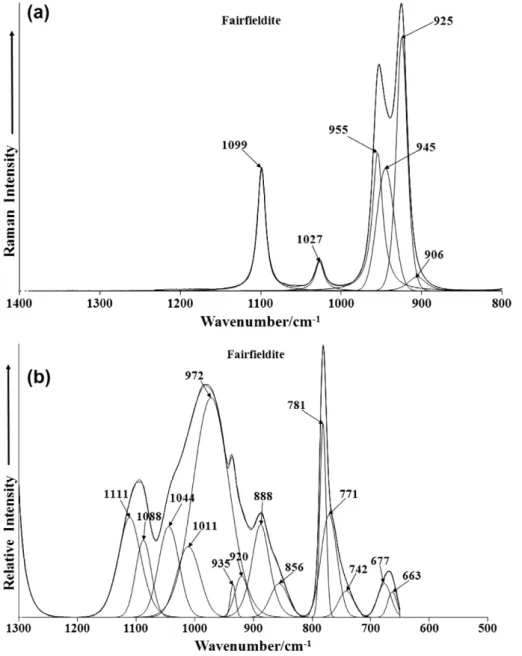
The Raman spectrum of fairfieldite over the 800–1400 cm1 spectral range is provided inFig. 4a. Intense Raman bands are ob-served at 925 and 955 cm1and are assigned to the PO3
4 symmet-ric stretching mode. The observation of two symmetsymmet-ric stretching modes supports the concept that the phosphate units in the fairf-ieldite structure are not equivalent.
The Raman bands at 1027 and 1099 cm1are assigned to the PO3
4 antisymmetric stretching mode.
The infrared spectrum in the 500–1300 cm1spectral range is reported inFig. 4a. The spectrum displays complexity with a num-ber of overlapping bands. Principal infrared bands in the PO3
4 stretching region are observed at 888, 920, 972, 1011, 1044, 1088
and 1111 cm1. The latter four bands may be attributed to the PO3
4 antisymmetric stretching modes whereas the low intensity bands at 920 and 930 cm1may be ascribed to the PO3
4 symmetric stretching mode.
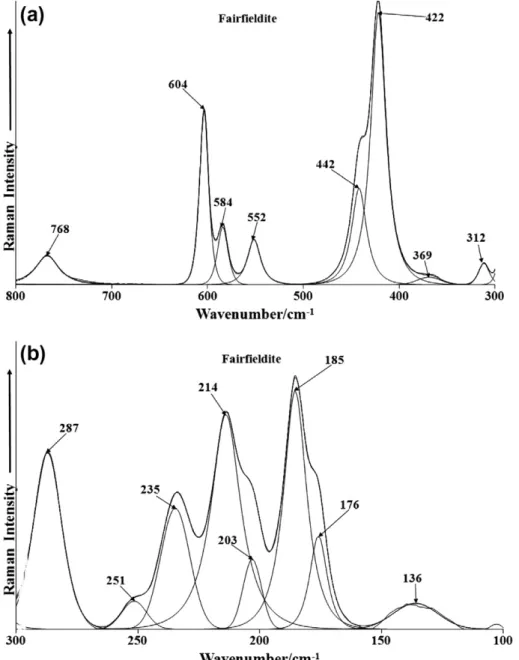
The Raman spectra of fairfieldite in the 300–800 cm1spectral; range and in the 100–300 cm1spectral range are shown inFig. 5. The Raman bands at 552, 584 and 604 cm1are assigned to the
m
4 PO3
4 bending modes whereas the Raman bands at 422 and 442 cm1 are assigned to the
m
2 PO34 bending modes. The low intensity infrared bands at 663 and 677 cm1are assigned to the PO3
4
m
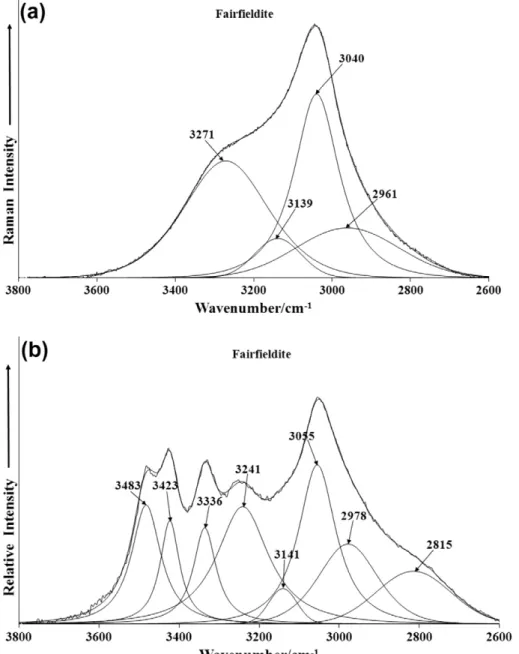
4 bending modes. The low intensity Raman band at 312 cm1is attributed to a M–O stretching vibration and the band at 768 cm1is assigned to a water librational mode. Such a band is of low intensity in the Raman spectrum but shows considerable more intensity in the infrared spectrum (Fig. 4b). Strong infrared bands are found at 771 and 781 cm1which are attributed to this vibrational mode. In the far low wavenumber region principal Ra-man bands are observed at 176, 185, 214, 235 and 287 cm1. These bands are due to external vibrations and may be simply described as lattice vibrations.The Raman spectrum and the infrared spectrum of fairfieldite in the 2600–3800 cm1spectral region is shown inFig. 6. The Raman spectrum displays principal bands at 3040 and 3271 cm1assigned to water stretching vibrations. The infrared spectrum shows great-er complexity with a sgreat-eries of ovgreat-erlapping bands. The main infra-red bands are observed at 3055, 3241, 3336, 3423 and 3483 cm1and are assigned to water stretching vibrations.
Studies have shown a strong correlation between OH stretching frequencies and both the O O bond distances and with the H O hydrogen bond distances[30–33]. The elegant work of Libowitzky showed that a regression function could be employed relating the above correlations with regression coefficients better than 0.96 [34]. The three Raman bands at 3040, 3149 and 3271 cm1enable calculations of the hydrogen bond distances of 2.658, 2.684 and 2.7303 Å. The six OH stretching vibrations in the infrared spec-tra of fairfieldite enable the calculation of predicted hydrogen bond distances of 2.6135 Å (2815 cm1), 2.6623 Å (3055 cm1), 2.7185 Å (3241 cm1), 2.760 Å (3336 cm1), 2.8151 Å (3423 cm1), 2.8730 Å (3483 cm1). It is noted that there is a wide range of hydrogen bond distances. This variation contributes to the stability of the mineral. For roselite, hydrogen bond distances of 2.75 and 2.67 Å were calculated. Two types of water molecules are identified in the structure and the known hydrogen bond distances used to predict the hydroxyl stretching frequencies. The data fundamen-tally distinguishes between two types of water according to the hydrogen bond distances, namely strongly hydrogen bonded water and weakly hydrogen bonded water. However the predicted values do not take into account factor group splitting, accidental degeneracy and in-phase and out-of-phase vibrations. The strong hydrogen bonding would suggest that the thermal decom-position of the minerals would take place at significantly high temperatures.
Some thermal studies were performed on collinsite, fairfieldite, and talmessite, and show the dehydration temperature increased with the strength of H bonds[35].
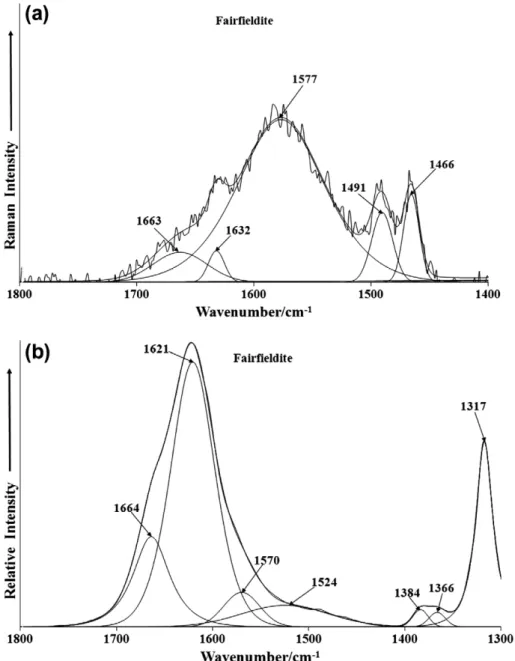
The variation in hydrogen bond distances as reflected in the po-sition of the bands assigned to water stretching vibrations is re-flected in the position of the water bending mode. The Raman spectrum in the 1400–1800 cm1spectral range (Fig. 7a) identifies water bending modes at 1632 and 1663 cm1. The Raman spec-trum shows a lack of signal, which is not unexpected as water is such a very poor Raman scatterer. In contrast, the infrared spec-trum (Fig. 7b) does show considerable intensity with infrared bands found at 1621 and 1664 cm1, confirming the variation of the hydrogen bond strength of water molecules bonded to the phosphate anion.
Conclusions
We have studied a sample of the phosphate mineral series fairf-ieldite-collinsite. The chemical formula can be expressed as: (Ca)1.99(Mn0.56Mg0.33Fe0.11)P1.00(PO4)1.992.02(H2O). The mineral is an intermediate member of the series with predominance of the fairfieldite member.
The mineral is a typical phosphate mineral with all of the usual vibrations observed in the Raman and infrared spectra. Phosphate bands are observed at 925, 945 and 955 cm1in the Raman spec-trum assigned to the phosphate symmetric stretching modes. The observation of multiple bands in this spectral region supports the concept of the non-equivalence of the phosphate units in the fairf-ieldite structure. This concept is supported by the complexity and overlap of the infrared bands in the phosphate antisymmetric stretching region. The symmetry of the phosphate anion is reduced through bonding to water molecules. This reduction in symmetry
is evidenced by the number of bands in the phosphate bending region.
Multiple bands are observed in both the Raman and infrared spectra in the OH stretching region. By using a Libowitzky type empirical equation which relates the wavenumber position of the OH stretching wavenumber in both the Raman and infrared spectra to the hydrogen bond distance, enables calculations of hydrogen bond distances for the structure of fiarfieldite. A range of hydrogen bond distances is obtained showing that water is at a range of dis-tances in relation to the phosphate unit. This range of hydrogen bond distances contributes to the stability of the mineral.
Acknowledgements
The financial and infra-structure support of the Discipline of Nanotechnology and Molecular Science, Science and Engineering Faculty of the Queensland University of Technology, is gratefully acknowledged. The Australian Research Council (ARC) is thanked for funding the instrumentation. The authors would like to acknowledge the Center of Microscopy at the Universidade Federal de Minas Gerais (http://www.microscopia.ufmg.br) for providing the equipment and technical support for experiments involving electron microscopy. R. Scholz thanks to FAPEMIG – Fundação de Amparo à Pesquisa do Estado de Minas Gerais (Grant No. CRA – APQ-03998-10).
References
[1] F.C. Hawthorne, R.B. Ferguson, Can. Min. 15 (Pt. 1) (1977) 36–42.
[2] P.D. Brotherton, E.N. Maslen, M.W. Pryce, A.H. White, Aust. J. Chem. 27 (1974) 653–656.
[3] L. Fanfani, A. Nunzi, P.F. Zanazzi, Acta Cryst. B26 (1970) 640–645. [4] W. Joswig, E.F. Paulus, B. Liebscher, Zeit. fuer Krist. 219 (2004) 341–342. [5] P. Keller, F. Lissner, T. Schleid, Euro. J. Min. 16 (2004) 353–359. [6] M. Wildner, D. Stoilova, Zeit. fuer Krist. 218 (2003) 201–209. [7] C.W. Johnston, R.J. Hill, Min. Rec. 9 (1978) 20–24.
[8] P.J. Bridge, M.W. Pryce, Min. Mag. 39 (1974) 577–579.
[9] R.L. Frost, J.T. Kloprogge, Spectrochim. Acta 59A (2003) 2797–2804. [10] R.L. Frost, L. Duong, W. Martens, Neues Jahrb. Fuer Min. (2003) 223–240. [11] R.L. Frost, W. Martens, P.A. Williams, J.T. Kloprogge, J. Raman Spectrosc. 34
(2003) 751–759.
[12] R.L. Frost, W. Martens, P.A. Williams, J.T. Kloprogge, Min. Mag. 66 (2002) 1063– 1073.
[13] R.L. Frost, P.A. Williams, W. Martens, J.T. Kloprogge, P. Leverett, J. Raman Spectrosc. 33 (2002) 260–263.
[14] R.L. Frost, P.A. Williams, W. Martens, J.T. Kloprogge, J. Raman Spectrosc. 33 (2002) 752–757.
[15] R.S.W. Braithwaite, Min. Rec. 12 (1981) 349–353.
[16] G.R. Hunt, J.W. Salisbury, C.J. Lenhoff, Mod. Geol. 3 (1972) 121–132. [17] X.-Y. Yang, Y.-F. Zheng, X.-M. Yang, X. Liu, K. Wang, Neues Jahrb. Fuer Min.
(2003) 97–112.
[18] R.L. Frost, W.N. Martens, T. Kloprogge, P.A. Williams, Neues Jahrb. Fuer Min (2002) 481–496.
[19] V.C. Farmer, Mineralogical Society Monograph 4: The Infrared Spectra of Minerals, The Mineralogical Society, London, 1974.
[20] M.E. Back, J.A. Mandarino, Fleischer’s Gloss. Min. Species (2008). [21] G.J. Brush, E.S. Dana, Am. J. Sci. Arts 17 (1879) 359–368. [22] T.P. Moore, Min. Rec. 36 (2005) 293.
[23] M.A. Cooper, F.C. Howthorne, N.A. Ball, R.R. A., A.C. Roberts, Can. Min. 47 (2009) 1225.
[24] T. Martins, A. Lima, W.B. Simmons, A.U. Falster, F. Noronha, Can. Min. 49 (2011) 77.
[25] G.M.d. Costa, R.R. Viana, Am. Min. 86 (2001) 1053–1056.
[26] L.N. Dias, M.V.B. Pinheiro, R.L. Moreira, K. Krambrock, K. Guedes, L.A.D.M. Filho, J. Karfunkel, J. Schnellrath, R. Scholz, Am. Min. 96 (2011) 42–52.
[27] R.L. Frost, S.J. Palmer, Y. Xi, Spectrochim. Acta A92 (2012) 377–381. [28] R.L. Frost, Y. Xi, J. Mol. Struct. 1010 (2012) 179–183.
[29] A.C. Pedrosa-Soares, C.M.d. Campos, C.M. Noce, L.C.D. Silva, T.A. Novo, J. Roncato, S.M. Medeiros, C. Castañeda, G.N. Queiroga, E. Dantas, I.A. Dussin, F. Alkmim, Geol. Soc. Spec. Pub. 350 (2011) 25–51.
[30] W. Mikenda, J. Mol. Struct. 147 (1986) 1–15. [31] A. Novak, Struct. Bonding 18 (1974) 177–216. [32] H. Lutz, Struct. Bonding 82 (1995) 85–103. [33] J. Emsley, Chem. Soc. Rev. 9 (1980) 91–124. [34] E. Libowitsky, Monat. Chem. 130 (1999) 1047–1049.