Infrared and Raman spectroscopic characterization of the borate mineral
hydroboracite CaMg[B
3
O
4
(OH)
3
]
2
3H
2
O – Implications for the molecular
structure
Ray L. Frost
a,⇑, Ricardo Scholz
b, Andrés López
a, Yunfei Xi
a, Leonardo Martins Graça
baSchool of Chemistry, Physics and Mechanical Engineering, Science and Engineering Faculty, Queensland University of Technology, GPO Box 2434, Brisbane Queensland 4001, Australia bGeology Department, School of Mines, Federal University of Ouro Preto, Campus Morro do Cruzeiro, Ouro Preto, MG 35,400-00, Brazil
h i g h l i g h t s
The vibrational spectroscopy of many borate minerals is ill determined. Included is hydroboracite CaMg[B3O4(OH)3]23H2O.
The basic repeat unit is the [B3O4(OH)3]2 group consisting of 2 tetrahedra and 1 triangle.
The mineral is characterized by a Raman band at 1039 cm 1.
a r t i c l e
i n f o
Article history: Received 24 June 2013
Received in revised form 4 November 2013 Accepted 5 November 2013
Available online 15 November 2013
Keywords: Hydroboracite Borate Boron
Raman spectroscopy Isotopic splitting
a b s t r a c t
We have studied the mineral hydroboracite CaMg[B3O4(OH)3]23H2O using electron microscopy and
vibrational spectroscopy. Both tetrahedral and trigonal boron units are observed. The nominal resolution of the Raman spectrometer is of the order of 2 cm 1and as such is sufficient enough to identify separate
bands for the stretching bands of the two boron isotopes. The Raman band at 1039 cm 1is assigned to BO
stretching vibration. Raman bands at 1144, 1157, 1229, 1318 cm 1are attributed to the BOH in-plane
bending modes. Raman bands at 825 and 925 cm 1are attributed to the antisymmetric stretching modes
of tetrahedral boron. The sharp Raman peak at 925 cm 1is from the 11-B component such a mode, then it
should have a smaller 10-B satellite near (1.03)(925) = 952 cm 1, and indeed a small peak at 955 is observed. Four sharp Raman bands observed at 3371, 3507, 3563 and 3632 cm 1are attributed to the
stretching vibrations of hydroxyl units. The broad Raman bands at 3076, 3138, 3255, 3384 and 3551 cm 1 are assigned to water stretching vibrations. Infrared bands at 3367, 3505, 3559 and
3631 cm 1are assigned to the stretching vibration of the hydroxyl units. Broad infrared bands at 3072
and 3254 cm 1 are assigned to water stretching vibrations. Infrared bands at 1318, 1349, 1371,
1383 cm 1are assigned to the antisymmetric stretching vibrations of trigonal boron.
Ó2013 Elsevier B.V. All rights reserved.
1. Introduction
Hydroboracite is a borate mineral of formula CaMg[B3O4 (OH)3]23H2O. The mineral was first discovered in 1834 in Atyrau Province, Kazakhstan. The mineral is known from many parts around the world[1–6]. The boron isotope ratio (11B/10B) is used to determine the geochemistry of boron minerals including hyd-roboracite[7–9]. This isotopic ratio may be reflected in the vibra-tional spectra providing the resolution of the spectrometers is sufficiently high.
Hydroboracite is monoclinic with point group 2/m[10,11]. The mineral has the cell data withSpace Group: P2/c,a= 11.769(2) Å,
b= 6.684(2) Å, c= 8.235(4) Å, b= 102.59(2) °, and Z= 2. The mineral is often found in ground waters through the alteration of colemanite.
According to Sabelli and Stoppioni[11], who refined the structure of hydroboracite as proposed by Ashirov et al.[10], the basic repeat unit of the hydroboracite structure is the [B3O4(OH)3]2 group con-sisting of 2 tetrahedra and 1 triangle. These borate polyanions are polymerized into undulating chains along thecaxis[11]. Chains of corner-shared Mg(OH)2(H2O)4 octahedra are linked to B–O chains giving sheets parallel to (100). Chains of edge-shared CaO4(OH)4 polyhedra also run parallel to thecaxis and connect the sheets to each other. A model of the crystal structure of hydroboracite is given in theSupplementary information.
Vibrational spectroscopy has been applied to borate glasses[12– 15]. There have been a number of studies of borate glasses doped
0022-2860/$ - see front matterÓ2013 Elsevier B.V. All rights reserved. http://dx.doi.org/10.1016/j.molstruc.2013.11.012
⇑Corresponding author. Tel.: +61 7 3138 2407; fax: +61 7 3138 1804. E-mail address:r.frost@qut.edu.au(R.L. Frost).
Contents lists available atScienceDirect
Journal of Molecular Structure
with a wide range of radioactive atoms[16,17]. Borate glasses are used as a means of containment of radioactive materials. There have been a number of studies looking at the effect of radiation on borate glasses[18,19]. If there is to be an understanding of bo-rate glasses and their role in radioactive element containment, then an understanding of the vibrational spectroscopy of borate minerals needs to be undertaken. The number of vibrational spectroscopic studies of borate minerals is quite few and far between[20–23]. The number of Raman studies of borate minerals is also very limited [24,25]. There have been a number of infrared studies of some nat-ural borates [26–29]. Most of these references are not new and there have been no recent studies on the vibrational spectroscopy of natural borates. Ross in Farmer’s treatise reported the infrared spectra of several borate minerals [30]. There have been only a few infrared studies of hydroboracite[26,29,31,32]and almost no studies of the Raman spectrum of hydroboracite[33]. There is some disagreement between researchers as to the position of some se-lected infrared bands. Moenke [34] and Vlasova and Valyashko [32]show a band at 675 cm 1which was not observed in the infra-red spectrum of Weier [29]. These authors simply reported the infrared data without any assignment of the bands.
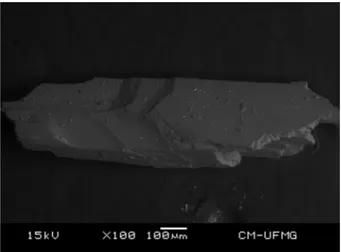
Fig. 1.Backscattered electron image (BSI) of a hydroboracite single crystal up to 1.0 mm in length.
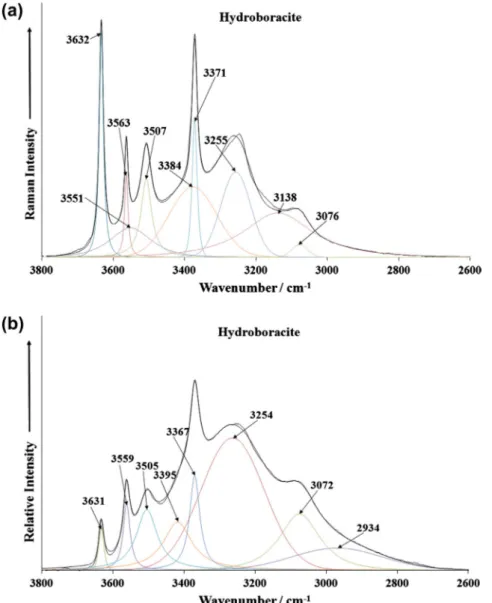
Fig. 2.(a) Raman spectrum of hydroboracite (upper spectrum) and (b) infrared spectrum of hydroboracite (lower spectrum).
The use of infrared spectroscopy is limited by the spatial reso-lution of the technique which is around 25 microns. In comparison, the spatial resolution using Raman spectroscopy is 1 micron. Thus, when studying a mineral using spectroscopic techniques it is advantageous to use Raman spectroscopy. The selection of the tar-get mineral is more easily made. With infrared spectroscopy, any impurities will be measured as well as the target mineral.
Raman spectroscopy has proven most useful for the study of min-eral structures. The objective of this research is to report the Raman and infrared spectra of hydroboracite and to relate the spectra to the molecular structure of the mineral. This is the first report of a sys-tematic study of hydroboracite from Brazil. It is important to under-stand the structure of hydroboracite in order to form nanomaterials based upon its structure. Vibrational spectroscopy enables a better understanding of the structure of hydroboracite.
2. Experimental
2.1. Samples description and preparation
The hydroboracite sample studied in this work was collected from the Kohnstein Quarry, Turingia, Germany [35]. The sample was incorporated to the collection of the Geology Department of
the Federal University of Ouro Preto, Minas Gerais, Brazil, with sample code SAC-008.
2.2. Scanning electron microscopy (SEM)
Experiments and analyses involving electron microscopy were performed in the Center of Microscopy of the Universidade Federal de Minas Gerais, Belo Horizonte, Minas Gerais, Brazil (http:// www.microscopia.ufmg.br). Hydroboracite crystal cleavage frag-ment was coated with a 5 nm layer of evaporated Au. Secondary Electron and Backscattering Electron images were obtained using a JEOL JSM-6360LV equipment.
2.3. Raman microprobe spectroscopy
Crystals of hydroboracite were placed on a polished metal sur-face on the stage of an Olympus BHSM microscope, which is equipped with 10, 20, and 50 objectives. The microscope is part of a Renishaw 1000 Raman microscope system, which also in-cludes a monochromator, a filter system and a CCD detector (1024 pixels). The Raman spectra were excited by a Spectra-Physics model 127 He–Ne laser producing highly polarized light at
Fig. 3.(a) Raman spectrum of hydroboracite (upper spectrum) in the 800–1500 cm 1spectral range and (b) infrared spectrum of hydroboracite (lower spectrum) in the 600–
633 nm and collected at a nominal resolution of 2 cm 1and a pre-cision of ±1 cm 1 in the range between 200 and 4000 cm 1. Re-peated acquisitions on the crystals using the highest magnification (50) were accumulated to improve the signal to noise ratio of the spectra. Raman Spectra were calibrated using the 520.5 cm 1line of a silicon wafer. The Raman spectra of at least 10 crystals were collected to ensure the consistency of the spectra. A Raman spectrum of hydroboracite is given in the Supplemen-tary information as Fig. S1. This spectrum was downloaded from the RRUFF data base (http://rruff.info/hydroboracite/R060713). Both polarized and depolarized spectra are provided. However the spectrum suffers from a lack of signal.
2.4. Infrared spectroscopy
Infrared spectra were obtained using a Nicolet Nexus 870 FTIR spectrometer with a smart endurance single bounce diamond ATR cell. Spectra over the 4000–525 cm 1 range were obtained by the co-addition of 128 scans with a resolution of 4 cm 1and a mirror velocity of 0.6329 cm/s. Spectra were co-added to improve the signal to noise ratio. The infrared spectra are given in the Supplementary information.
Spectral manipulation such as baseline correction/adjustment and smoothing were performed using the Spectracalc software
package GRAMS (Galactic Industries Corporation, NH, USA). Band component analysis was undertaken using the Jandel ‘Peakfit’ soft-ware package that enabled the type of fitting function to be se-lected and allows specific parameters to be fixed or varied accordingly. Band fitting was done using a Lorentzian–Gaussian cross-product function with the minimum number of component bands used for the fitting process. The Lorentzian–Gaussian ratio was maintained at values greater than 0.7 and fitting was under-taken until reproducible results were obtained with squared corre-lations ofR2greater than 0.995.
3. Results and discussion
The SEM image of hydroboracite sample studied in this work is shown inFig. 1. The image shows a cleavage fragment with pris-matic habitus. The sample shows to be a single phase and no zona-tion was observed. Due to structural instability of the mineral and possible loss of water, EDS spectra were not obtained.
3.1. Vibrational spectroscopy
The Raman spectrum of hydroboracite over the 100–4000 cm 1 spectral range is reported in Fig. 2a. The spectrum shows
Fig. 4.(a) Raman spectrum of hydroboracite (upper spectrum) in the 300–800 cm 1spectral range and (b) Raman spectrum of hydroboracite (lower spectrum) in the 100–
300 cm1spectral range.
complexity with many bands being observed. This figure shows the position and relative intensities of the Raman bands. It is notewor-thy that there are large parts of the spectrum where no intensity is observed. The Raman spectrum is therefore subdivided into sec-tions depending upon the type of vibration being analysed. The infrared spectrum of hydroboracite over the 500–4000 cm 1 spec-tral range is displayed inFig. 2b. The spectrum is not shown below 500 cm 1. The reason for this is that we are using a reflectance technique and the ATR cell absorbs all incident radiation. There are parts of this infrared spectrum where little or no intensity is observed. This spectrum may be thus subdivided into sections depending upon the type of vibration being analysed.
The Raman spectrum of hydroboracite over the 800–1500 cm 1 spectral range is illustrated inFig. 3a. The Raman spectrum in this spectral region is dominated by a sharp intense band at 1039 cm 1. On the high wavenumber side of this band, bands of significantly lesser intensity are observed at 1144, 1157, 1229, 1318, 1379, 1394 cm 1with a broad band at 1433 cm 1. The Raman band at 1009 cm 1is assigned to the BO stretching vibration of the B
7O13 units. It is probable that there at least 13 BO stretching vibrations based upon a B7O13unit. Whether all these vibrations are coinci-dent are not is not known but is likely. The width of the symmetric stretching vibration in the Raman spectrum suggests that these vibrational modes of the BO stretching vibrations are coincident.
Further, the existence of two isotopes, also complicates the situation.
The nominal resolution of the Raman spectrometer is of the or-der of 2 cm 1and as such is sufficient enough to identify separate bands for the stretching bands of the two boron isotopes. The two reduced masses for a pure B-O stretching mode would be (1016)/(10 + 16) = 6.154 for 10-B and (1116)/(11 + 16) = 6.518 for 11-B. The wavenumber is inversely proportional to square root of reduced mass; so the isotopic wavenumber ratio should be the sqrt(6.518/6.154) = 1.03. 10-B is about 20% of natural boron, so a mode that is mostly B–O stretching and that includes significant motion of the B atom (not a breathing mode of a BO3 tri-gonal planar unit or a BO4tetrahedral unit) should show a large peak for 11-B and a smaller peak at higher wavenumber for 10-B. For example if the sharp Raman peak at 925 inFig. 3a is from the 11-B component such a mode, then it should have a smaller 10-B satellite near (1.03)(925) = 952 cm 1, and indeed a small peak at 955 is observed in the figure. Similar small, higher wave-number bands are also shown in this figure associated with large peaks at 825 and 1039 cm 1.
The Raman bands at 1144, 1157, 1229, 1318 cm 1are attrib-uted to the BOH in-plane bending modes. It is not known to what the very broad band at 1433 cm 1is attributed. Iliev et al. deter-mined the Raman spectrum of a synthetic cobalt boracite [36].
Fig. 5.(a) Raman spectrum of hydroboracite (upper spectrum) in the 2600–3800 cm 1spectral range and (b) infrared spectrum of hydroboracite (lower spectrum) in the
The symmetry species of some vibrational modes were deter-mined. These researchers[37] used Raman imaging to show the ferroelectric properties of boracite type compounds. These workers [37]showed that boracites exhibit a sequence of transitions from the high temperature paraelectric cubic phase to ferroelectric orthorhombic, monoclinic, trigonal phases, and finally to a mono-clinic phase at low temperatures where both ferroelectric and magnetic orders coexist. Kim and Somoano determined the impro-per ferroelectric transition using Raman spectroscopy[38]. On the low wavenumber side of the 1039 cm 1peak, Raman bands with significant intensity are observed at 825 and 925 cm 1. These bands may be attributed to the antisymmetric stretching modes of tetrahedral boron.
The detailed infrared spectrum over the 600–1200 cm 1 spec-tral range is provided inFig. 3b. This spectrum displays complexity with many bands being observed. The series of infrared bands at 903, 949, 961 and 980 cm 1are attributed to the trigonal borate antisymmetric stretching modes. The infrared band at 1035 cm 1 is assigned to the BO stretching mode, the equivalent to the Raman band at 1039 cm 1. The series of infrared bands from 683 through to 753 cm 1 are related to trigonal borate bending modes. The infrared bands at 1077, 1134, 1154 and 1188 cm 1 are assigned to BOH deformation modes. The infrared bands at around 833 cm 1are assigned to water librational modes[39–41].
The Raman spectra in the 300–800 cm 1 and in the 100– 300 cm 1spectral ranges are shown inFig. 4. Four sharp Raman bands are observed at 556, 560, 582, 730 and 753 cm 1. These bands are simply defined as trigonal and tetrahedral borate bend-ing modes. A series of infrared bands at 683, 722, 733, 742 and 753 cm 1(Fig. 3b) are due to these bending modes. Strong Raman bands are found in the far wavenumber region at 135, 168, 212, 229 and 243 cm 1(Fig. 4b). These bands may be simply described as lattice vibrations.
The Raman spectrum of hydroboracite in the 2600–3800 cm 1 spectral range is reported inFig. 5a. The infrared spectrum of hyd-roboracite in the 2500–3800 cm 1 spectral range is reported in
Fig. 5b. The formula of hydroboracite CaMg[B3O4(OH)3]23H2O is such that both water and hydroxyl stretching bands would be ex-pected in both the Raman and infrared spectra. The difficulty is which band is attributable to which vibration. In the normal course of events, the hydroxyl stretching vibrations occur at higher wave-numbers than the water stretching wavewave-numbers[42–45]. Further, the widths of the hydroxyl stretching vibrations are narrow com-pared with the width of the water bands. Four sharp Raman bands observed at 3371, 3507, 3563 and 3632 cm 1 are superimposed upon some broad bands at 3076, 3138, 3255, 3384 and 3551 cm 1. It is probable that these latter five bands are attribut-able to water stretching vibrations. The first four bands are
Fig. 6.Raman spectrum of hydroboracite (upper spectrum) in the 1500–1800 cm 1spectral range and (b) infrared spectrum of hydroboracite (lower spectrum) in the 1200–
1800 cm1spectral range.
attributed to the stretching vibrations of hydroxyl units. The obser-vation of multiple bands proves that there are non-equivalent hy-droxyl and water units in the hydroboracite structure. The four sharp Raman bands observed in the Raman spectrum are also ob-served in the infrared spectrum at 3367, 3505, 3559 and 3631 cm 1. These infrared bands are ascribed to the stretching vibration of the hydroxyl units. The broad infrared bands at 3072 and 3254 cm 1are assigned to water stretching vibrations.
The Raman spectrum of hydroboracite in the 1500–1800 cm 1 spectral range is reported inFig. 6a. A single broad Raman band at 1685 cm 1is observed. This band is attributed to the bending mode of water, and its position is indicative of very strongly hydro-gen bonded water[42–45]. The position of the Raman band is in harmony with the infrared bands observed in the infrared spec-trum at 1627 and 1673 cm 1 (Fig. 6b). The 1627 cm 1 infrared band is due to the bending mode of weakly hydrogen bonded water molecules, whereas the 1673 cm 1infrared band is attrib-uted to very strongly hydrogen bonded water. A series of infrared bands are observed inFig. 6b between 1300 and 1500 cm 1. Infra-red bands are found at 1318, 1349, 1371, 1383 cm 1. These bands are assigned to the antisymmetric stretching vibrations of trigonal boron[30](please see Table 11.VIII of this reference). Other infra-red bands with lesser intensity are noted at 1431, 1455 and 1472 cm 1. These bands are also attributed to the antisymmetric stretching vibrations of trigonal boron[30]. A low intensity infra-red band is observed at 1214 cm 1. This band is assigned to in plane bending of BOH units[30]. These bands are not observed in the Raman spectrum.
4. Conclusions
The hydroboracite sample studied in this work is from the Kohnstein Quarry, Turingia, Germany. A combination of Raman spectroscopy at ambient temperatures complimented with infra-red spectroscopy has been used to characterize the mineral. Tenta-tive assignments are made based upon the position and intensity of the infrared and Raman bands. Two boron isotopes are known namely 10-B and 11-B. The 10-B is around 20% in concentration compared with 11-B. The Raman spectrum shows a large peak for 11-B and a smaller peak at higher frequency for 10-B. The sharp Raman peak at 925 cm 1is from the 11-B component such a mode, then it should have a smaller 10-B satellite near (1.03)(924) = 952 cm 1, and indeed a low intensity peak at 955 cm 1is observed.
There are many borate containing minerals which have yet to have their vibrational spectra measured and the molecular struc-ture assessed in terms of their vibrational spectra. In this work we have measured the Raman and infrared spectrum of hydrobora-cite, a borate containing mineral. The importance of the mineral hydroboracite rests with the chemistry of the compound and the potential to synthesize nanomaterials based upon polymerization of borate units. Such compounds have the potential to make espe-cially selected ferroelectric, pyroelectric and piezoelectric proper-ties. Hydroboracite is a precursor for the synthesis of such nanomaterials.
Acknowledgments
The financial and infra-structure support of the Discipline of Nanotechnology and Molecular Science, Science and Engineering Faculty of the Queensland University of Technology, is gratefully acknowledged. The Australian Research Council (ARC) is thanked
for funding the instrumentation. The authors would like to acknowledge the Center of Microscopy at the Universidade Federal de Minas Gerais (http://www.microscopia.ufmg.br) for providing the equipment and technical support for experiments involving electron microscopy. R. Scholz thanks to CNPq – Conselho Nacional de Desenvolvimento Científico e Tecnológico (Grant No. 306287/ 2012-9).
Appendix A. Supplementary material
Supplementary data associated with this article can be found, in the online version, athttp://dx.doi.org/10.1016/j.molstruc.2013.11. 012.
References
[1]A. Demircioglu, Bull. Mineral Res. Explor. Inst. Turkey 80 (1973) 104–117. [2]M. Godlevskii, Abteilung A: Mineralogie, Petrographie I (1938) 674–675. [3]C. Helvaci, R.N. Alonso, Turkish J. Earth Sci. 9 (2000) 1–27.
[4]A.M. Ivanov, Izvest. Vysshikh Ucheb. Zavedenii, Geol. i Razvedka (1958) 84–91. [5]V.V. Lobanova, Doklady Akademii Nauk SSSR 118 (1958) 1180–1182. [6]D. Sun, Y. Wang, H. Qi, Y. Xiao, Chinese Sci. Bull. 34 (1989) 320–324. [7]S.V. Malinko, A.E. Lisitsyn, L.V. Sumin, Doklady Akademii Nauk SSSR 267 (1982)
453–456 [Geochem].
[8]S.V. Malinko, A.E. Lisitsyn, L.V. Sumin, Soviet Geol. (1987) 89–97. [9]M.R. Palmer, C. Helvaci, Geochim. Cosmochim. Acta 61 (1997) 3161–3169. [10]A. Ashirov, I.M. Rumanova, N.V. Belov, Doklady Akademii Nauk SSSR 147
(1962) 1079–1082.
[11]C. Sabelli, A. Stoppioni, Can. Mineral. 16 (1978) 75–80.
[12]I. Ardelean, S. Cora, J. Mater. Sci.: Mater. Electron. 19 (2008) 584–588. [13]I. Ardelean, S. Cora, J. Optoelectronics Adv. Mater. 12 (2010) 239–243. [14]I. Ardelean, L. Griguta, J. Optoelectronics Adv. Mater. 9 (2007) 2068–2070. [15]I. Ardelean, V. Timar, J. Optoelectronics Adv. Mater. 10 (2008) 246–250. [16]F.H. El Batal, M.A. Azooz, A.A. El-Kheshen, Trans. Indian Ceram. Soc. 68 (2009)
81–90.
[17]F.H. ElBatal, Y.M. Hamdy, Trans. Indian Ceram. Soc. 67 (2008) 193–202. [18]C. Rajyasree, P.M. Vinaya Teja, K.V.R. Murthy, D. Krishna Rao, Phys B: Condens.
Matter (Amsterdam, Netherlands) 406 (2011) 4366–4372.
[19]B. Sumalatha, I. Omkaram, T.R. Rao, C.L. Raju, J. Non-Cryst. Solids 357 (2011) 3143–3152.
[20]M. Mir, J. Janczak, Y.P. Mascarenhas, J. Appl. Crystallogr. 39 (2006) 42–45. [21]I. Mitov, Z. Cherkezova-Zheleva, V. Mitrov, J. Balkan Tribological Assoc. 4
(1998) 191–200.
[22]A.S. Povarennykh, E.I. Nefedov, Geologicheskii Zhurnal (Russian Ed.) 31 (1971) 13–27.
[23]V.S. Suknev, E.N. Diman, Zh. Prikl. Spektrosk. 10 (1969) 326–328. [24]V.F. Ross, J.O. Edwards, Chem. Boron Compd. (1967) 15–207. [25]R.L. Frost, J. Raman Spectrosc. 42 (2011) 540–543. [26]M.V. Akhmanova, Zh. Strukt. Khim. 3 (1962) 28–34.
[27]D.A. Long, R.T. Bailey, Spectrochim. Acta 19 (1963) 1607–1610. [28]A. Vasko, I. Srb, Czech J. Phys. 17 (1967) 1110–1123.
[29]C.E. Weir, J. Res. Nat. Bur. Standards, Sect. A: Phys. Chem. 70 (1966) 153–164. [30]V.C. Farmer, Mineralogical society monograph 4: the infrared spectra of
minerals (1974).
[31]M.G. Valyashko, E.V. Vlasova, Jena Rev. 14 (1969) 3–11.
[32]E.V. Vlasova, M.G. Valyashko, Zh. Neorg. Khim. 11 (1966) 1539–1547. [33]X. Xie, F. Zha, Kuangwu Xuebao 13 (1993) 130–136.
[34]H. Moenke, Silikattechnik 13 (1962) 287–288. [35]J. Siemroth, Der Aufschluss 59 (2008) 353–366.
[36]M.N. Iliev, V.G. Hadjiev, M.E. Mendoza, J. Pascual, Phys. Rev. B: Condensed Matter Mater. Phys. 76 (2007) 214112/214111–214112/214115.
[37]M.N. Iliev, V.G. Hadjiev, J. Iniguez, J. Pascual, Acta Phys. Pol., A 116 (2009) 19–24.
[38]Q. Kim, R.B. Somoano, Ferroelectrics 36 (1981) 431–434.
[39]D.W. James, R.F. Armishaw, R.L. Frost, Aust. J. Chem. 31 (1978) 1401–1410. [40]D.W. James, R.L. Frost, J. Chem. Soc., Faraday Trans. 1: Phys. Chem. Condensed
Phases 74 (1978) 583–596.
[41]D.W. James, R.F. Armishaw, R.L. Frost, J. Phys. Chem. 80 (1976) 1346–1350. [42]L. Frost Ray, Y. Xi, Spectrochim. Acta A Mol. Biomol. Spectrosc. 103 (2013)
151–155.
[43]R.L. Frost, A. Lopez, Y. Xi, R. Scholz, G.M.d. Costa, F.M. Belotti, R.M.F. Lima, Spectrochim. Acta, Part A 114 (2013) 27–32.
[44]R.L. Frost, Y. Xi, R. Scholz, F.M. Belotti, M. Candido Filho, J. Mol. Struct. 1037 (2013) 23–28.