Brazilian Journal of Physics, vol. 39, no. 2, June, 2009 297
Structural and Dielectric Properties of
ZrO
2Added
(
Na
1/2Bi
1/2)
TiO
3Ceramic
K. Kumari and K. Prasad∗
Materials Research Laboratory, University Department of Physics, T. M. Bhagalpur University, Bhagalpur – 812007, India
K.L. Yadav
Department of Physics, Indian Institute of Technology, Roorkee – 247667, India
S. Sen
Materials Science and Technology Division, National Metallurgical Laboratory Jamshedpur – 831007, India
(Received on 26 January, 2009)
Polycrystalline samples ofZrO2added(Na1/2Bi1/2)TiO3were prepared using high-temperature solid-state
reaction method at 1050oC and subsequent sintering at 1090oC in air atmosphere. Rietveld analyses of XRD
data indicated the formation of a single-phase hexagonal structure withR3csymmetry. Dielectric studies
re-vealed the relaxor behaviour. The addition ofZrO2to(Na1/2Bi1/2)TiO3shifted phase transition temperature
as well as depolarization temperature to higher side which is desirable for piezoelectric applications. The fre-quency dependence of the temperature of the permittivity maximum was modeled using Vogel-Fulcher relation. The dielectric relaxation in the system is found to be analogous to the magnetic relaxation in spin-glass system.
Keywords: Lead free compound; Perovskite; Dielectric properties; Relaxor.
I. INTRODUCTION
Perovskite ABO3-type oxides exhibit interesting proper-ties providing potential applications in piezoelectric trans-ducers, pyroelectric detectors, electrostrictive actuators, MEMs, etc. The materials used for these applications are mainly lead bearing compoundse.g. PbTiO3,Pb(Zr,Ti)O3,
Pb(Mg1/3Nb2/3)O3, etc. However, volatilization of toxic
PbO during high-temperature sintering not only causes en-vironmental pollution but also generate instability of compo-sition and electrical properties of the products. Also, prod-ucts containingPb-based gadgets are not recyclable. Taking these aspects into consideration, search of eco-friendly lead-free compounds having either comparable or superior elec-trical properties for such applications are the main trends of research nowadays [1].
Sodium bismuth titanate,(Na1/2Bi1/2)TiO3(NBT) is con-sidered to be an excellent candidate as a key material of lead-free piezoelectric ceramic, which shows strong ferro-electric properties having a phase transition temperature at 320oC with relaxor behaviour [2-6]. Further, the electronic structure of different components of(Na1/2Bi1/2)TiO3and
Pb(Zr,Ti)O3 are: Na(Z = 11) [(Ne)3s1]; Bi(Z = 83) [(X e)6s24f145d106p3]; Ti(Z = 22)[(Ar)4s23d2]; O(Z =
8)[(He)2s22p4]; Pb(Z = 82)[(X e)6s24f145d106p2] and Zr(Z =40)[(Kr)5s24d2]. The covalency between unoccu-pied states of theA-site ion in the perovskite structure, such as Pb 6d-states and Bi 6d-states, and O p-states favoured ferroelectric ground states [7, 10]. Also Bi3+ions are iso-electronic with Pb2+, both showing a lone pair effect, en-couraged further studies of NBT as alternative toPZT ce-ramics. In addition, NBT exhibits an anomaly in its dielec-tric properties as a result of low temperature phase transi-tion from the ferroelectric to the anti-ferroelectric phase at
∗Electronic address:[email protected]
about 200oC, which is termed as depolarization tempera-tureTd. ThisTd is an important factor forNBT andNBT -based ceramics in view of their practical uses, because the piezoelectric response disappears aboveTd. It has been re-ported that the additives likeMnCO3[11],La2O3[12, 13],
CeO2[13],Bi2O3−Sc2O3[14],LiTaO3[15],NaNbO3[16],
etc. showed improvement in the electrical properties ofNBT while the Td was greatly reduced. Recently, it has been observed thatW O3addedNBT system showed relaxor be-haviour and bothTd (∼300oC at 1 kHz) as well as Tm (= 438oC at 1 kHz) shifted towards higher temperature side [1, 17]. In view of these, in the present work, structural, mi-crostructural and dielectric studies of(1−x)NBT−xZrO2; (0≤x≤0.1)(abbreviated hereafterNBT−ZrO2) ceramics are reported.
II. EXPERIMENTAL PROCEDURE
struc-298 K. Kumari et al.
ture, profile matching,etc.The refinements were carried out using the program FULLPROF 2000 [19] under Windows XP together with WinPLOTR. The microstructure of the sin-teredNBT−ZrO2samples were taken on the fractured sur-face using a computer controlled scanning electron micro-scope (JEOL-JSM840A). The temperature dependence of di-electric constant (ε), phase angle (θ) and loss tangent (tanδ) were measured at different frequencies using a computer-interfaced LCR Hi-Tester (HIOKI 3532-50), Japan on a sym-metrical cell of type Ag|ceramic|Ag, where Ag is a conduc-tive paint coated on both the flat faces of pellets.
III. RESULTS AND DISCUSSION
Int
e
nsi
ty
(a
rb
.
uni
t)
Bragg angle, 2θ ( ° )
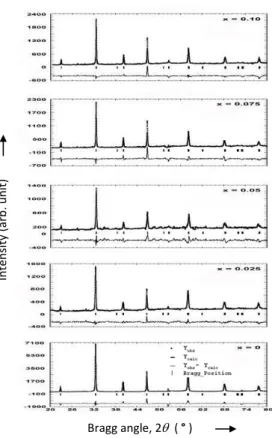
FIG. 1: Rietveld refined patterns of (1−x)(Na1/2Bi1/2)TiO3−
xZrO2; x=0, 0.025, 0.05, 0.075 and 0.10 systems in the space
group R3c. Symbols represent the observed data points and the
solid lines their Rietveld fit.
Fig. 1 depicts the observed, calculated and difference pro-files for each compositions ofNBT−ZrO2after final cycle of refinement. Rietveld refinements were done onNBT− ZrO2system, selecting the space groupR3cin Glazers no-tation [20, 21]. The fractional coordinates for the hexagonal setting of rhombohedral perovskites with space groupR3cin terms of independent refinable parameters used for the anal-yses were originally developed by Megaw and Darlington [22]. It can be seen that the profiles for observed and cal-culated one are perfectly matching. The value ofχ2comes out to be of the order of 3, which is considered to be very good for estimations. The profile fitting procedure adopted was minimizing theχ2 function [18]. Also, XRD analyses
indicated thatZrO2added NBT system do not change their basic structure i.e. rhombohedral symmetry: a= 3.890(6)
˚
A andα = 89.71◦ [6]; however, some shifting in the peak positions and changes in intensities of the peaks could be observed. All the compounds were found to have single-phase hexagonal crystal structure. The refined structural pa-rameters for the all the compositions along with their unit cell volume are illustrated in Fig. 2. It is observed that the value ofaincreases (from 5.4812 ˚A forx=0 to 5.4897 ˚A for x=0.10) while that ofcdecreases (from 13.4832 ˚A forx=0 to 13.4774 ˚A forx=0.10) with the increasingZrO2content. Also an increase in the unit cell volume has been observed with the increment in additive percentage. Further, it can be seen that the changes in unit cell edges are at the third place of decimal (the overall volume increase was less than 0.3%). The average crystallite size ofNBT−ZrO2system was esti-mated from some strong reflections of low 2θvalues of X-ray profile using Scherrer’s equation: Lhkl =0.89λ/β1/2cosθ, whereβ1/2is the full width at half maximum. The average particle size was estimated to be of the order of 50 nm.
0 2 4 6 8 10
5.475 5.480 5.485 5.490 5.495 13.470 13.475 13.480 13.485 13.490
c
a
a
,
c
( Å
)
ZrO2 , x ( wt% )
350.6 350.8 351.0 351.2 351.4 351.6 351.8
Uni
t c
e
ll volume
(
Å
3 )
FIG. 2: Variation of lattice parameters and unit cell volume with
ZrO2content at room temperature for(1−x)(Na1/2Bi1/2)TiO3−
xZrO2(x=0, 0.025, 0.050, 0.075 and 0.10).
Brazilian Journal of Physics, vol. 39, no. 2, June, 2009 299
(b) (c)
(d) (e)
(a) _
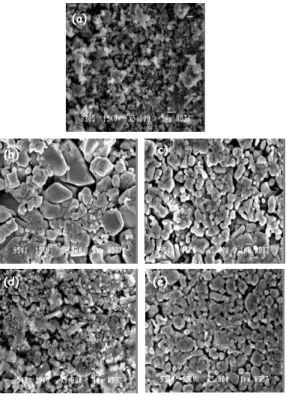
FIG. 3: SEM micrographs of(1−x)(Na1/2Bi1/2)TiO3−xZrO2; (a)
x=0, (b)x=0.025, (c)x=0.05, (d)x=0.075 and (e)x=0.10.
The scale of the pictures is 1µm.
be advantageous when improved detectivity is required. The variation of tanδwith temperature follows similar asε-T be-haviour for all the compounds. Also, a decrease in the value tanδat room temperature (from 0.097 forx=0.025 to 0.077 for x=0.10) has been observed with the increase inZrO2 content (x).
0 100 200 300 400 500 200 400 600 800 1000 1200 0.0 0.5 1.0 1.5 2.0 2.5 3.0
468101214
1.42 1.44 1.46 1.48 1.50 1.52 1 000 / Tm ( K -1)
ln f ( kHz )
Temperature ( oC )
1 kHz 100 kHz ε tanδ Dielec tr ic con s ta nt Die le c tr ic lo ss (b)
0 100 200 300 400 500 0 500 1000 1500 2000 2500 3000
46810 12 14
1.46 1.47 1.48 1.49 1.50 1.51 1.52 1.53 1.54 1 0 00 / Tm ( K
-1 )
ln f ( Hz )
ε tanδ
1 kHz
100 kHz
Temperature ( oC )
D iel ec tr ic con s ta nt (a) 0.0 0.5 1.0 1.5 2.0 2.5 3.0 3.5 D iel ec tr ic l o ss
0 100 200 300 400 500 0 500 1000 1500 2000 2500
Temperature ( oC )
D iel ec tri c c o n s ta n t 0 2 4 6 8 10
468101214
1.40 1.42 1.44 1.46 1.48 1.50 10 0 0 / Tm ( K -1)
ln f ( kHz ) ε tanδ 100 kHz 1 kHz D ie lect ri c l os s (c)
0 100 200 300 400 500 200 400 600 800 1000 1200
468101214
1.38 1.40 1.42 1.44 1.46 1.48 1.50 100 0 / Tm ( K -1)
ln f ( kHz )
ε
tanδ
Temperature ( oC )
Die lec tr ic co ns tan t (d) 0.0 0.5 1.0 1.5 2.0 2.5 100 kHz 1 kHz D ie lect ri c l o ss
f ( kHz )
f ( kHz )
f ( kHz )
f ( kHz )
FIG. 4: Variation of dielectric constant (solid curves) and loss tan-gent (dot-dashed curves) with temperature at different frequencies
for(1−x)(Na1/2Bi1/2)TiO3−xZrO2ceramics (a)x=0.025; (b)
x=0.05; (c)x=0.075 and (d)x=0.10. Inset: 1/Tmas a function
of measuring frequency. The points correspond to the experimental data while the dotted line to fitting of Vogel-Fulcher relationship.
Here the region around the dielectric peak is broadened, which is one of the important characteristics of disordered perovskite type structure with DPT and does not follow the Curie-Weiss law, exhibiting the following type of tempera-ture dependence:
1/ε−1/εm=A(T−Tm)γ (1)
whereγis a critical exponent which lies in the range 1<γ≤ 2. γ=1 represents ideal Curie-Weiss behaviour while be-tween 1 and 2 indicate diffuse behaviour [23, 24]. The value of exponentγwas estimated using linear least square fitting of experimental data to expression (1) [25]. We findγ>1 for all the cases. The value ofγ>1 imply diffuse phase tran-sition which may be due to compotran-sitional fluctuations where the local curie points of different microregions are statisti-cally distributed around the mean Curie temperature.
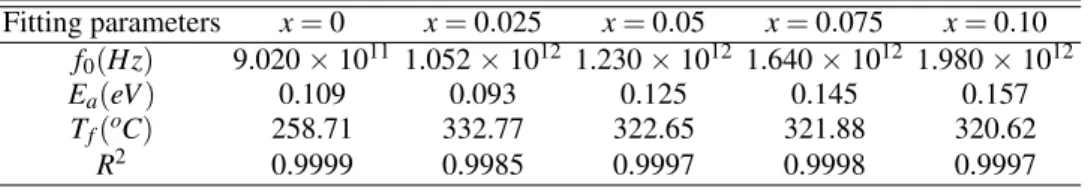
It is known that the frequency dependence ofTmin relaxor ferroelectrics cannot be described by simple Arrhenius law, which is to be expected for Debye-type relaxation process, but instead this dependence obeys the Vogel-Fulcher law [1]. In order to analyse relaxation features of NBT−ZrO2 ce-ramics, the experimental data of lnf vs. 1/Tmwere modeled using the Vogel-Fulcher relationship:
f =f0exp[−Ea/kB(Tm−Tf)] (2)
300 K. Kumari et al.
TABLE I: Vogel-Fulcher parameters for(1−x)NBT−xZrO2;x=0, 0.025, 0.05, 0.075 and 0.10 ceramics. Fitting parameters x=0 x=0.025 x=0.05 x=0.075 x=0.10
f0(Hz) 9.020×10¹¹ 1.052×10¹² 1.230×10¹² 1.640×10¹² 1.980×10¹²
Ea(eV) 0.109 0.093 0.125 0.145 0.157
Tf(oC) 258.71 332.77 322.65 321.88 320.62
R2 0.9999 0.9985 0.9997 0.9998 0.9997
IV. SUMMARY
Polycrystalline samples ofNBT−ZrO2, prepared through a high-temperature solid-state reaction technique, were found to have single-phase perovskite type hexagonal struc-ture showed the relaxor behavior. The addition ofZrO2to NBT shiftsTmas well asTdto higher temperature side and
decreases the dielectric loss which is desirable for piezoelec-tric applications. Modeling of frequency dependent dielec-tric data using Vogel-Fulcher relationship gives a strong ev-idence for the static freezing temperature of thermally acti-vated polarization fluctuations in the system. Therefore, the dielectric relaxation in the system may be considered analo-gous to the magnetic relaxation in spin-glass system.
[1] K. Prasad, K. Kumari, Lily, K.P. Chandra, K.L. Yadav, and S.
Sen, State Commun.14442 (2007).
[3] J. Kreisel, and A.M. Glazer, Phys. Rev. B63174106 (2001).
[3] I.G. Siny, C.S. Tu and V.H. Schmidt, Phys. Rev. B515659
(1995).
[4] B.J. Chu, D.R. Chen, G.R. Li and Q.R. Yin, J. Euro. Ceram.
Soc.222115 (2002).
[5] C.S. Tu, I.G. Siny and V.H. Schmidt, Phys. Rev. B4911550
(1994).
[6] K. Prasad, K. Kumari, Lily, K.P. Chandra, K.L. Yadav and S.
Sen, Adv. Appl. Ceram.106241 (2007).
[7] R.E. Cohen, Nature358136 (1992).
[8] K. Miura, and M. Tanaka, Jpn. J. Appl. Phys.302719 (1996).
[9] D.J. Singh, M. Ghita, S.V. Halilov, and M. Fornari, J. Phys. IV
Fr.12847 (2005).
[10] S. Zhao, G. Li, T. Wang, and Q. Yin, J.Phys. D: Appl. Phys.
392277 (2006).
[11] H. Nagata, and T. Takenaka, J. Euro. Ceram. Soc.21 1299
(2001).
[12] A. Herabut, and A. Safari, J. Amer. Ceram. Soc. 80 2954
(1997).
[13] X.X. Wang, H.L.W. Chan, and C.L. Choy, Appl. Phys. A80
333 (2005).
[14] T. Takenaka, and H. Nagata, Jpn. J. Appl. Phys. 30 2236
(1991).
[15] Y. Guo, K-I. Kakimoto, and H. Ohsato, Mater. Lett.59 241
(2005).
[16] Y.M. Li, W. Chen, J. Zhou, Q. Xu, X.Y. Gu, and R.H. Liao,
Physica B36576 (2005).
[17] K. Prasad, K. Kumari, K.P. Chandra, K.L. Yadav and S. Sen,
Mater.Sci.-Poland (2009) in press.
[18] L.B. McCusker, R.B. Von Dreele, D.E. Cox, D. Lour, and P.
Scardi, J. Appl. Cryst.3236 (1999).
[19] Juan Rodriguez-Carvajal, FULLPROF: A Rietveld
Re-finement and Pattern Matching Analysis Program, (Ver-sion: July 2001), Laboratoire Lon Brillouin (CEA-CNRS), placecountry-regionFrance.
[20] A.M. Glazer, Acta Crystallogr. B283384 (1972).
[21] A.M. Glazer, Acta Crystallogr. A31756 (1975).
[22] H.D. Megaw, and C.N.W. Darlingtan, Acta Crystallogr. A31
161 (1975).
[23] R. Clarke and J.C. Burfoot, Ferroelectrics8505 (1974).
[24] R.L. Moreira and R.P.S.M. Lobo, J. Phys. Soc. Japan611992
(1992).
[25] K. Prasad, R.N.P. Choudhary S.N. Choudhary, and R. Sati,
Bull. Mater. Sci.19505 (1996).
[26] P. Bonneau, O. Garnier, G. Calvarin, E. Husson, J.R. Gavarri,
A.W. Hewat, and A. Morrel, J. Solid State Chem. 91 350
(1991).
[27] E. Courtens, Phys. Rev. Lett.5269 (1984).