VUV Spectral Line Emission Measurements in the TCABR Tokamak
M.Machida
Instituto de F´ısica, Universidade Estadual de Campinas-UNICAMP, Campinas, SP, 13083-970, Brazil
A.M.Daltrini
Centro de Excelˆencia em Tecnologia Eletrˆonica Avanc¸ada - CEITEC, Porto Alegre, RS, Brazil
J.H.F.Severo, I.C.Nascimento, E.K.Sanada, J.I.Elizondo, Y.K.Kuznetsov
Instituto de F´ısica, Universidade de S˜ao Paulo, S˜ao Paulo, SP, 05508-900, Brazil (Received on 15 December, 2008)
The study of tokamak plasma light emissions in the vacuum ultraviolet (VUV) region is an important sub-ject since many impurity spectral emissions are present in this region. These spectral emissions can be used to determine the plasma ion temperature and density from different species and spatial positions inside plasma ac-cording to their temperatures. We have analyzed VUV spectra from 500 ˚Ato 3200 ˚Awavelength in the TCABR tokamak plasma including higher diffraction order emissions. There have been identified 37 first diffraction or-der emissions, resulting in 28 second diffraction oror-der, 24 third diffraction oror-der, and 7 fourth diffraction oror-der lines. The emissions are from impurity species such as OII, OIII, OIV, OV, OVI, OVII, CII, CIII, CIV, NIII, NIV, and NV. All the spectra beyond 1900 ˚Aare from higher diffraction order emissions, and possess much better spectral resolution. Each strong and isolated spectral line, as well as its higher diffraction order emissions suitable for plasma diagnostic is identified and discussed. Finally, an example of ion temperature determination using different diffraction order is presented.
Keywords: VUV spectrometry, higher diffraction order spectra, tokamak, ion temperature, multi-channel detector
I. INTRODUCTION
The line emissions from impurity particles in tokamak plasmas are routinely used in many analyses as radiation power loss, transport/rotation phenomena, and ion tempera-ture measurements in different region of plasma [1-3]. In addition, many impurity emissions met in divertor or edge regions of large tokamak [4, 5] can be comparable to impu-rity emissions produced by plasmas in smaller tokamaks as TCABR [6].
The traditional forms to support these studies are the mea-surements in the VUV (vacuum ultraviolet) region of ion line Doppler broadening and/or shifting [7, 8], and effective charge calculations using calibrated absolute intensity mea-surements. However, in VUV region, the Doppler broadening is smaller than in the visible region (due to its wavelength), the absolute calibration is much more arduous, and measur-able spectral range are smaller compared to the visible region [9].
Despite of many works in VUV region of tokamak plas-mas, usually is difficult to find a list of most common spectral emissions, nearby emissions, and presence of higher diffrac-tion order emissions. However, such as reported in a previous work [10], higher diffraction order emissions, which usually are ignored, can provide better measurement results, due to the direct relationship of diffraction order number with reso-lution power and angular dispersion. In this article, spectral lines from 500 ˚A to 1900 ˚Ameasured in TCABR tokamak plasmas are presented. First diffraction order spectra were detected up to 1900 ˚A, but several second, third, and fourth diffraction order emissions were also identified up to 3200 ˚A. An open micro channel plate (MCP) with charge coupled de-vice (CCD) detector coupled to one-meter focal length VUV McPherson spectrometer has been used. The most important emissions, with their respective higher order lines, are listed and the usefulness of higher diffraction order emissions is
an-alyzed.
II. EXPERIMENTAL SETUP
The VUV spectrometer is a 225 McPherson, which has one-meter focal length and 82.5
0 incidence (˜150 between the beam incident on the grating and a diffracted beam that will pass through the exit slit). It is provided with a 1200 groves/mm concave grating with Al and MgF2coating, and blazed at 2000 ˚A. The spectrometer has the linear dispersion of 8,3 ˚A/mm and can cover the spectral region from 500 ˚Ato 3500 ˚A.
The multi-channel detector consists of an open 40 mm diameter MCP plate (BrightView XUV2010 G, XSI Instru-ments) coupled to a CCD device (Marconi CCD30-11, Andor Technology) with 1024 by 256 pixels, and each pixel has 26 micrometers by 26 micrometers. This device has been spe-cially mounted for our spectrometer by McPherson Inc. [11]. The MCP plate is coated by CsI (to convert VUV photons in electrons), and has a phosphor screen to convert the electrons in photons. The MCP channels, separated by 12 microm-eters, have 10 micrometers diameter. A reducing coherent glass fiber array was used to couple the MCP to the CCD; more detail can be found in the ref. [10].
The spectrometer is pumped below 1x10⁻⁶Torr by a 250
L/s turbomolecular pump. It is connected to the tokamak chamber by a 3.6 cm diameter, 4.80 meter long stainless steel tube with differential pumping, and is aligned to observe the equatorial plane of the tokamak.
The main parameters of TCABR tokamak are [6]: major radius of R = 0.615 m, minor radius of r = 0.18 m, maxi-mum toroidal magnetic field of BT = 1.1 T, maximum plasma current of Ip= 110 kA, and typical electron density and tem-perature of 2×10¹⁹m−3and 400 eV respectively.
gas puff injection during the discharge. All measurements were taken at 60 ms of the discharge, which corresponds to the plasma current of 90 kA and line averaged central electron density of 1.2×10
19m−3as can be seen in Fig. 1.
FIG. 1: Discharge signals from TCABR tokamak. From the top, electron density, loop voltage and plasma current. All the spectral measurements have been taken at discharge time of 60 ms
The integration time for the spectral measurements, defined by MCP gate pulse, was taken as 5 ms. The entrance slit of VUV spectrometer was kept at 80 microns.
Figure 2 shows the detector spectral response versus wave-length. The wavelengths were calibrated by different methods [9, 12], in order to cover a longer wavelength range. One can observe that wavelengths below 550 ˚Aand above 2300 ˚Aare much attenuated due to the detector sensitivity. Nevertheless, higher diffraction order emissions from the interval of 550 ˚A to 1550 ˚Astill can be detected at higher wavelength positions since they kept the original wavelength.
FIG. 2: Calibration points for the VUV spectrometer with multi-channel detector using different calibration methods
III. EXPERIMENTAL RESULTS AND DATA ANALYSIS
The wavelength interval measured at each run is defined by 1024 pixels of the CCD. This corresponds to the wavelength interval of about 370 ˚Afor each tokamak discharge. From this interval, only central region of about 200 ˚Ahas been used for our data analysis in order to avoid signal intensity decrease at the CCD edge pixels [10]. The measured spectrum was then plotted in Figs. 3 to 7. For each figure, three (with ex-ception of Fig. 6) TCABR tokamak discharges (indicated by the upper numbers in the central part of figures) were used in order to obtain an interval of about 500 ˚A. The number between parentheses for each spectral line is the same num-ber as indicated in Table 1. The diffraction order numnum-ber is indicated by number of asterisks with the specie element (as-terisks were not used for first diffraction order lines). Since the measurement conditions were kept constant, by changing only the spectrometer wavelength interval, the relative inten-sity counts comparison between spectra is possible taking into account the spectrometer calibration curve seen in Fig. 2.
In Fig. 3 is presented the spectral emissions from 500 ˚A to 1000 ˚A. Two strongest emissions are from OV at 629.73
˚
A(4) and CIII at 977.02 ˚A(20), with 8296 and 9377 inten-sity counts respectively. The spectra FVII (15) and (16), at 882.74 ˚Aand 890.32 ˚A, respectively, are from fluorine, as had been noted in Ref. [13]. This is due to the Teflon material used in multi-channel microwave interferometer. However, it could be also from BII at 882.54 ˚A, due to boron nitride used in Langmuir probe, and FeII at 890.76 ˚A (vacuum vessel). However, since no other Fe emissions were detected, these emissions are probably from the FVII ion. Other superposed lines are the CIII spectra at 2296.0 ˚A, which is covered by strong NIV*** (71) line, this indicate a leak problem on the TCABR tokamak.
Emissions such as (15) and (16), and also the OIV doublet (11) and (12) are very interesting for spectroscopy purposes, since they have a relative high intensity and are well isolated from other spectral emissions. Moreover, note that identifi-cation of spectral emissions with different ionization degrees allows the probing of different regions in the plasma (since more ionized ions are mainly localized inward the plasma). In the wavelength interval presented in Fig. 3, one can iden-tify ions with low ionization potential (localized at colder re-gions), such as hydrogen (Lyman gamma) with 13.60 eV, and CII with 24.38 eV, or ions with higher ionization potential, such as OV with 113.87 eV, and FVII with 185.18 eV [14].
All these emissions will be seen at higher wavelength as second, third and forth diffraction order emissions with much better spectral resolution, and sometimes superposed with other first line emissions. The appearance of the hydrogen Lyman gamma emission (19) can also be observed in Fig. 3, with a relatively good intensity, but it is affected by the tail of very strong emission CIII (20). Also is important to notice that some spectral emissions as OIV (1) at 554.07 ˚A, OV (9) at 760.35 ˚Aand OIII (13) at 833.51 ˚Aare sum of many mul-tiplet lines as will be clear when looking at higher diffraction order lines.
emis-500 550 600 650 700 750 800 850 900 950 1000 0 1000 2000 3000 4000 5000 6000 7000 8000 9000 10000 (22) NIII (21) NIII (20) CIII (19) Lyg (18) NIV (17) CII (16) FVII (15) FVII (14) OIII (13) OIII (12) OIV (11) OIV (10) NIV (9) OV (8) OII (7) OIII (6) OIII (5) NIII (4) OV (3) OIV (2) OIII (1) OIV c o u n ts wavelength (Angstron) #21992; #21994; #21995
FIG. 3: TCABR VUV spectra from 500 ˚Ato 1000 ˚Awith 22 first diffraction order lines. Important emission lines are: (1), (4), (11), (12), (15), (16), and (20) due to their intensity profile and spectral localization.
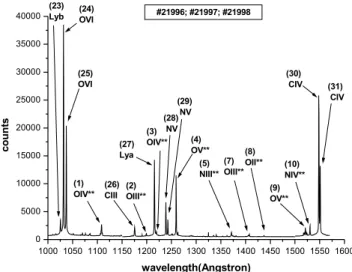
sions, one is from a well-isolated single CIII emission, two are from hydrogen (Lyman alpha and beta) and three are dou-blets (OVI, NV, CIV). The interesting spectral lines are the CIV and NV doublets at 1550.0 ˚Aand 1242.0 ˚Adue to their high spectral intensity and the absence of closer emissions. The OVI doublet at 1032.0 ˚Ais the strongest emission with 38488 counts; however, some care should be taken due to the Lyman beta emission nearby. The Lyman alpha at 1215.0 ˚A, as expected, is the strongest among hydrogen emissions, but notice the presence of a nearby weak OIV second diffraction order line.
1000 1050 1100 1150 1200 1250 1300 1350 1400 1450 1500 1550 1600 0 5000 10000 15000 20000 25000 30000 35000 40000 (31) CIV (30) CIV (10) NIV** (9) OV** (8) OII** (7) OIII** (5) NIII** (4) OV** (29) NV (28) NV (3) OIV** (27) Lya (2) OIII** (26) CIII (1) OIV** (25) OVI (24) OVI (23) Lyb c o u n ts wavelength(Angstron) #21996; #21997; #21998
FIG. 4: TCABR VUV spectra from 1000 ˚Ato 1600 ˚Awith 9 first diffraction order and 9 second diffraction order spectra. Emissions from OVI (24, 25), Lyman alpha (27), NV (28, 29) and CIV (30, 31) are the strongest first diffraction order in the spectrum.
Above 1500 ˚A, most emissions are from higher diffraction order spectra. Nevertheless, we still can find some interesting first diffraction order emissions up to 1900 ˚A, as can be seen in Fig. 5. In the emissions from 1550 ˚Ato 2100 ˚Anew 6 first
diffraction order lines, 13 second and 2 third diffraction order lines can be observed. In Fig. 5, the doublet emissions from CIV at 1550 ˚Aof Fig. 4 have been omitted in order to be able to work with low intensity emission lines.
1550 1600 1650 1700 1750 1800 1850 1900 1950 2000 2050 2100 400 600 800 1000 1200 1400 1600 1800 2000 (14) OIII** (35) OIII ( 1 ) OIV*** (25) OVI** (24) OVI** (23) Lyb** (20) CIII** (19) Lyg** (37) U1 (4) OV*** (18) NIV** (17) CII** (16) FVII** (15) FVII** (36) NIV (13) OIII** (34) OVII (33) OVII (32) OVII (12) OIV** (11) OIV** c o u n ts wavelength (Angstron) #21999; #22000; #22001
FIG. 5: Emissions from 1550 ˚Ato 2100 ˚Awith 6 first, 13 second and 2 third diffraction order spectra. The U1 (37) line is the last first diffraction order spectra
The OVII (32) emission at 1624.05 ˚A is a strong line, well isolated, and with high ionization potential (739.11 eV), which makes it interesting for diagnostics. The doublet spec-trum of OVII at 1638.74 ˚A and 1640.18 ˚A also possesses no nearby lines. The U1 emission (37) at 1896.85 ˚A has good intensity, is well isolated, but no reference line was found for this emission. In addition, the U1 spectrum is the last first diffraction order emission observed in the measure-ments. Furthermore, in this interval, some third diffraction order lines are starting to be seen.
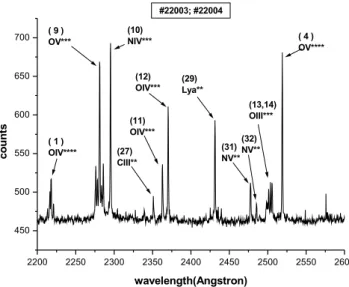
In the wavelength interval from 2200 ˚Ato 2600 ˚Apresented in Fig. 6, very low intensity lines are observed, with 4 sec-ond, 6 third, and 2 fourth diffraction order emissions. Notice that the highest intensity is lower than 700 counts. The OV line (4) at 2518.95 ˚Ais a well-isolated fourth diffraction order spectrum that can be very useful for the diagnostics. An inter-esting feature in this interval is that some multiplet emissions can be seen separated with some detail. The OV (1) spec-trum, originally at 554.07 ˚A, appears at 2216.27 ˚Aas fourth diffraction order. However, the emission that seemed to be an isolated spectral line in the first diffraction order now splits in three more emissions at 2213.38 ˚A, 2218.08 ˚Aand 2220.97
˚
A. The same behavior is seen for the OV (9) line at 760.35 ˚A which corresponds to 2281.34 ˚Aat fourth order, with the ob-servation of four other lines at 2275.92 ˚A, 2278.45 ˚A, 2283.51
˚
A, and 2286.04 ˚A. Additionally, OIII (13) at 2501.19 ˚Aalso presents multiplet behavior with 2498.30 ˚A, 2500.11 ˚A, and 2503.34 ˚A.
2200 2250 2300 2350 2400 2450 2500 2550 2600 450
500 550 600 650
700 ( 4 )
OV****
(13,14) OIII***
(32) NV** (31) NV** (29) Lya** (12)
OIV***
(11) OIV*** (27) CIII**
(10) NIV*** ( 9 )
OV***
( 1 ) OIV****
c
o
u
n
ts
wavelength(Angstron)
#22003; #22004
FIG. 6: Emissions from 2200 ˚Ato 2600 ˚Awith 4 second, 6 third, and 2 fourth diffraction order emissions, which corresponds to 13 third and 5 fourth diffraction order multiplet emissions
third order OVI (24) and second order CIV (39), and their strong intensities, overlapping is observed. Finally, the fifth order OV (4) line emission can also be interesting due to its high diffraction order (but care is need to be taken since it seen to be too high intensity compared to fourth diffraction order emission).
2600 2700 2800 2900 3000 3100 3200
0 1000 2000 3000 4000 5000 6000 7000
(4) OV***** (25) OVI*** (40) CIV** (24,39)
OVI*** CIV**
(23) Lyb*** (10) NIV**** (9) OV**** (22) NIII*** (20) CIII*** (18)
NIV*** (17) CII*** (16) FVII***
(15) FVII***
c
o
u
n
ts
wavelength (Angstron) #22007; #22008; #22009
FIG. 7: Emissions from 2600 ˚Ato 3200 ˚Awith 2 second order, 9 third order, 2 fourth order, and one fifth diffraction order emissions
Table 1 lists main emissions presented in Figs. 3 to 7 (in-cluding the different diffraction orders observed). All the wavelengths given by λNIST are from reference [14], and λmeasured is the wavelength read directly after the conversion
from CCD pixel number. In addition, the last column presents references where similar emissions have been observed [4, 13, 15-17].
The use of higher diffraction order lines can be very inter-esting. As an example, line number 9 in Table 1, OV at 760.35
˚
A, seen up to fourth diffraction order, is present also in many other larger devices. With configuration 1s22s2p−1s22p2, in principle could be a good line for the diagnostic. In Fig.
N Spectra λλλλmeasured
(Å) λλλλ(Å) NIST
Detected Higher Order number
Observed also at reference
1 OIV 554.07 554.07 2nd, 3rd, 4th [4,13,15]
2 OIII 599.40 599.60 2nd
3 OIV 609.75 609.83 2nd
4 OV 629.73 629.73 2nd, 3rd, 4th, 5th [4,13,15,16,17]
5 NIII 685.76 685.82 2nd
6 OIII 702.53 702.33 [4]
7 OIII 703.61 703.85 2nd [4]
8 OII 718.24 718.50 2nd
9 OV 760.35 760.45 2nd, 3rd,4th [13,15,16,17]
10 NIV 764.99 765.15 2nd, 3rd,4th [17]
11 OIV 787.47 787.71 2nd, 3rd,4th [16]
12 OIV 789.97 790.11 2nd, 3rd [16]
13 OIII 833.51 833.74 2nd, 3rd [16,17]
14 OIII 835.29 835.29 2nd, 3rd [16,17]
15 FVII 882.74 883.10 2nd, 3rd [13]
16 FVII 890.23 890.76 2nd, 3rd [13]
17 CII 903.79 903.62 2nd, 3rd [4,16]
18 NIV 922.70 922.52 2nd, 3rd [17]
19 Lgama 971.96 972.54 2nd
20 CIII 976.24 977.03 2nd, 3rd [4,13,16]
21 NIII 989.09 989.79 [17]
22 NIII 990.87 991.51 2nd, 3rd [17]
23 Lbeta 1025.46 1025.72 2nd, 3rd
24 OVI 1031.66 1031.91 2nd, 3rd [4,13,15,17]
25 OVI 1037.28 1037.61 2nd, 3rd [4,13,15,17]
26 CIII 1175.49 1175.26 2nd [4,13]
27 Lalpha 1215.68 1215.67 2nd [4,17]
28 NV 1238.65 1238.82 2nd [17]
29 NV 1242.59 1242.80 2nd [17]
30 CIV 1548.19 1548.19 2nd [4,17]
31 CIV 1550.70 1550.77 2nd [4,17]
32 OVII 1624.05 1623.64
33 OVII 1638.74 1638.27
34 OVII 1640.18 1639.88
35 OIII 1669.21 1669.31
36 NIV 1718.66 1718.55
37 U1 1896.85 Unknown
Table 1: List of most intense line emissions observed from 55 nm to 320 nm, including the measured species, measured wavelengths, wavelengths from Ref [14], detected diffraction order numbers, and
other references in the literature
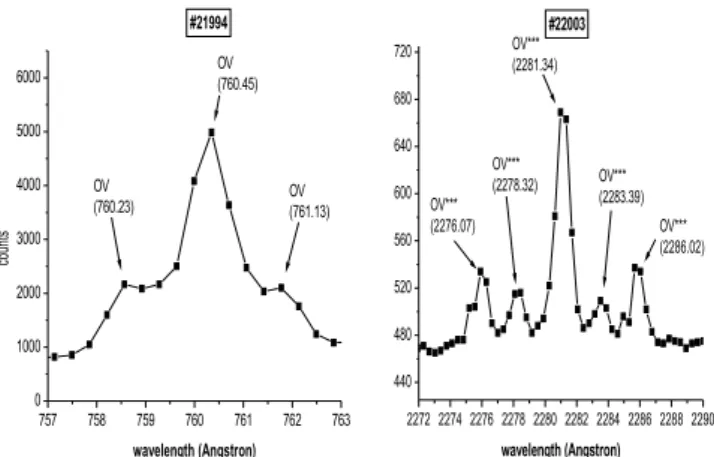
8a, the first diffraction order is seen, with other emissions on neighborhood but no clear separation. When third diffraction order is observed, as in Fig 8b, it is clear that there are five spectral lines. According to Ref. [14] these lines corresponds to main central line at 760.446 ˚A, one doublet at 759.442
˚
A and 761.128 ˚A, and another doublet lines at 758.677 ˚A and 762.004 ˚A. So, the correct separation of these spectral lines can only be seen in the present experiment if the higher diffraction order lines are used.
Another very important issue is the care that must be taken about CCD pixel distribution on the spectral profiles during the measurements. The first, fourth and fifth diffraction order of the well known OV line (4) at 629.73 ˚Aare shown in Fig. 9.
757 758 759 760 761 762 763 0
1000 2000 3000 4000 5000 6000
OV
(760.23) OV(761.13) OV (760.45)
co
un
ts
wavelength (Angstron) #21994
2272 2274 2276 2278 2280 2282 2284 2286 2288 2290 440
480 520 560 600 640 680 720
OV*** (2276.07)
OV*** (2278.32)
OV*** (2281.34)
OV*** (2283.39)
OV*** (2286.02)
wavelength (Angstron) #22003
FIG. 8: a) Line OV at 760.45 ˚Aseen at first order. b) OV seen at third order at 2281.34 ˚A
628 629 630 631 632 2000
4000 6000 8000
Co
un
ts
Wavelength (Angstron) OV First Order
2517,0 2518,5 2520,0 2521,5 500
600 700
Wavelength (Angstron) OV Fourth Order
3146 3148 3150 500
1000 1500
Wavelength (Angstron) OV Fifth Order
FIG. 9: OV (a) first, (b) fourth and (c) fifth diffraction order emission at 62.973 nm, 251.895 nm, and at 314.881 nm respectively, with their Gaussian fittings
hand, the Lαline at 1215.58 ˚Ameasurement lead to ion
tem-perature of 23 eV, since this emission is originated from the outer plasma region. Therefore, the value obtained from fifth diffraction order is too low to be true, this is due to non-symmetrical pixel distribution on this line compared to the other two lines [18]. So, the ion temperature measurement using different line emissions (from similar ionization stage) helps to check the accuracy of each diffraction order used.
IV. CONCLUSION
We show that the VUV region of tokamak plasma light emission is very rich of impurity spectral light emissions. Very broad impurity ionization stages are met, such as OII to OVII. We obtained and catalogued 37 first diffraction or-der lines, which resulted in 28 second, 24 third and 7 fourth diffraction order lines in the interval of 500 ˚Ato 3200 ˚AVUV region. Most of these detected emissions are observed in other high temperature tokamak plasmas, showing the useful-ness of this catalogue. The higher diffraction order lines have shown to be much better to analyze the multiplet structure of the line emissions. Also, the ion temperature measurements are much more accurate if higher diffraction order lines are used, due to the larger Gaussian FWHM value. Moreover, the effect of differences on pixel distribution throughout Gaus-sian profile showed to produce errors on the ion temperature determination.
V. ACKNOWLEDGMENTS
This work has been supported by FAPESP, CNPq, CNEN and FAEPEX/UNICAMP.
[1] A. Manini et al., and the ASDEX Upgrade Team, Nucl. Fusion
46, 1047 (2006).
[2] P. C. de Vries et al., Plasma Phys. Control. Fusion48,1693 (2006).
[3] R. Katai et al., Rev. Sci. Instrum.77, 10F307 (2006). [4] H. Kubo et. al., Nucl. Fusion33, 427, 1993.
[5] J. Gafert et al., and ASDEX Upgrade Team, Plasma Phys. Con-trol. Fusion39, 1981 (1997).
[6] I.C. Nascimento et al., Nucl. Fusion45, 796, (2005). [7] H.Sakakita et al., Rev. Sci. Instrum.74, 2111, (2003). [8] R.B. Gomes et. Al., Rev. Sci. Instrum.74, 2071 (2003). [9] A.M. Daltrini and M. Machida, IEEE Trans. Plasma Science
33, 1961 (2005).
[10] A.M. Daltrini and M. Machida, Rev. Sci. Instrum.78, 066101, (2007).
[11] A.M. Daltrini et al., Braz. J, Phys.31, 496, (2001).
[12] A.M. Daltrini and M. Machida, Rev. Sci. Instrum.76, 053508, (2005).
[13] R.C. Isler, Fusion Enginnering and Design34-35, 115, (1997). [14] http://www.physics.nist.gov/cgi-bin/ASD/
[15] W. Biel, G. Bertschinger, and the TEXTOR Team, Rev. Sci. Instrum. 57, 2471, (2004).
[16] A.R. Field et al., Rev. Sci. Instrum.66, 5433, (1995).
[17] V. Piffl and V. Weinzettl, 29th EPS Conference on Plasma Phys. and Contr. Fusion,26B, P-4.123, (2002).
![Figure 2 shows the detector spectral response versus wave- wave-length. The wavelengths were calibrated by different methods [9, 12], in order to cover a longer wavelength range](https://thumb-eu.123doks.com/thumbv2/123dok_br/18983217.457844/2.892.75.429.772.1036/figure-detector-spectral-response-wavelengths-calibrated-different-wavelength.webp)