Paramagnetic shimming for high- eld MRI
D. Tomasi and R.L. Wang
Medical Department, Brookhaven National Laboratory, Upton, NY 11973, USA.
(Received on 20 January, 2009)
The diamagnetism of biological tissues reduces the homogeneity of the magnetic field and may limit the num-ber of samples in multi-sample gradient-recalled echo (GRE) experiments. This study aims to 1) evaluate the magnetic field distortions and signal loss artifacts in GRE images of proximal water samples, and 2) develop a passive shimming device to overcome this limitation. The magnetic field distribution produced by a diamagnetic H2O sphere and a paramagnetic CuSO4disk in a secondary phantom were mapped using GRE experiments and the phase reference method, and compared to the corresponding magnetostatics models. The water sphere pro-duced a pronounced signal loss artifact in amplitude images. This artifact was significantly repro-duced when the paramagnetic disk was placed symmetrically between the water sphere and the secondary spherical phantom. The present study suggests that the use of paramagnetic shimming devices can help to minimize susceptibility-related MRI signal losses and to increase the number of samples in multi-sample MRI experiments. The volume susceptibility and the shape of paramagnetic shimming devices could be optimized for particular setups and samples accordingly.
Keywords: susceptibility, passive shimming, signal loss
I. INTRODUCTION
The quality of magnetic resonance imaging (MRI) relies upon the presence of a highly homogeneous (and intense) magnetic field over the entire imaging sample. The homo-geneity of the magnetic field is reduced by differences in magnetic susceptibility at air/tissue interfaces (1-3), which cause geometric distortion (2) and signal-loss artifacts (4) that are usually more pronounced for gradient-recalled echo (GRE) imaging modalities. These local field distortions can hardly be corrected by ordinary dynamic adjustment of elec-tric currents in the active shimming coils of the MRI scanner largely due to the power limitations of the high-order shim-ming channels (5). Alternatively, magnetic materials can be used to correct local distortions of the static magnetic field, but the shape and size of the materials have to be customized for each particular sample (5). For instance, recent studies showed that a small amount of the strongly diamagnetic py-rolytic graphite placed underneath the roof of the mouth can significantly correct field inhomogeneities caused by the si-nus cavity in the human orbitofrontal cortex (6,7).
Because diamagnetic biological tissues (4) alter the mag-netic field in the surrounding space of the sample (2,3) and there is a growing interest for performing parallel image ac-quisition of multiple small-animals in clinical MRI scanners (8,9), it is important to evaluate the effect of between-sample proximity on image quality and to develop shimming meth-ods to minimize the associated artifacts while maximizing the number of animals to be simultaneously scanned. Thus we aimed to evaluate the magnetic field distortions and the asso-ciated signal loss artifacts in GRE images of proximal water samples, and to develop a paramagnetic passive shimming de-vice to correct these artifacts.
Electronic address:[email protected]
METHODS
MRI acquisition
All studies were performed on a 4-Tesla Varian/Siemens MRI scanner using a fast low angle shot (10) pulse sequence (FLASH; 5 sagital slices; 4 mm thickness; 21 mm gap; in-plane resolution = 1.17 × 0.70 mm2; acquisition matrix = 256×256; TR = 0.3 s; TE = 5 and 50 ms; phase encoding gradient step = 0.17 mT/m; slice selection gradient = 5.25 mT/m; readout gradient = 4.03 mT/m; acquisition bandwidth = 51.6 kHz; ip angle = 45o).
All available active shimming channels (first and second order) were used to optimize the homogeneity of the magnetic field in the imaging volume. The constant field contours of the z-component of the magnetic field produced in the phan-tom volume by proximal diamagnetic or paramagnetic objects were measured using the phase reference method (11).
Paramagnetic shimming disk
A passive shimming disk was developed to minimize the extra magnetic field produced in the imaged phantom by the presence of the neighbor diamagnetic spherical phantom. A mix of 15-g of paramagnetic CuSO4-5H2O salt crystal (Mallinckrodt Baker, Inc., Phillipsburg, NJ) and 32 g of Car-penter’s wood glue (Elmer’s Products, Inc., Columbus, HO) was deposited on a substrate (standard paper) and shaped as a disk with 4.25-cm outer diameter and 0.5-cm thickness. The disk was allowed to fully dry for 24 hours at room temper-ature. Finally, the paper substrate attached to the shimming disk was removed from it.
MRI Experiment
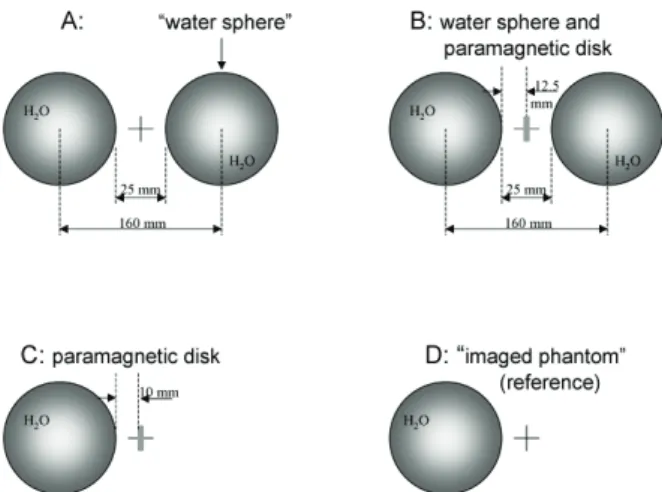
each echo time: A) 16-cm apart (center-to-center), symmetri-cally placed with respect to the scanner isocenter, of an iden-tical water phantom; B) same as A but with the paramagnetic disk at the scanner isocenter; C) with the paramagnetic disk at the scanner isocenter only; and D) the phantom alone as schematically shown in Fig. 1.
FIG. 1: Schematic representation of the four GRE experiments done with TE = 5, and 50 ms. A) Two identical spherical water phantoms [”imaged phantom” (left) and “water sphere” (right)] where sym-metrically placed with respect to the scanner isocenter (cross). The “water sphere” reduces the field homogeneity in the “imaged phan-tom”. B) The paramagnetic CuSO4 disk is placed at the scanner isocenter between the “imaged phantom” and the “water sphere”. The paramagnetic disk partially cancels out the field inhomogeneity produced by the water sphere in the “imaged phantom”. C) The “im-aged phantom” and the CuSO4-disk remain in the scanner. The para-magnetic disk reduces the field homogeneity in the ”imaged phan-tom”. D) Only the left “imaged phantom” remains in the scanner for the reference image.
Phase reference imaging
In a GRE experiment the spins atr= (x,y,z) are partially refocused at the echo-time, TE, and accumulate a phase:
φ(r) =γBz(r)T E, (1) HereBz(r)is the offset of the static magnetic field atr, and γ=267.522×10⁶rad/(sTesla) is the gyromagnetic ratio of protons. The complex MR signal at each imaging voxel can be written as
S(r) =|S(r)|exp(iφ), (2) and the accumulated phase can be calculated as
φ(r) =tg−1[S(r)]. (3) The magnetic field distribution produced by a magnetic ob-ject,P, in the vicinity of the imaging region can be calculated as the complex ratio of the MRI signals with,S(r)P, and with-out ,S(r)0, the object (11)
∆φ(r) =tg−1[S(r)P/S(r)0] =
γ∆Bz(r)T E (4)
This phase reference measure of the phase of the voxel magnetization eliminates the spurious effects ofBO-field in-homogeneities (11,12), which are invariant across all condi-tions.
Fitting models
The magnetic volume susceptibilities of the diamagnetic water solution in the spherical phantom and the paramagnetic mix in the shimming disk were calculated using the theoreti-cal expressions for the z-component of the magnetic field pro-duced along thez-axis by a sphere and a disk with a uniform magnetization aligned with the external fieldB0(13):
∆Bspherez (0,0,z) =2χB0a 3
3
1 z
3 ;
∆Bdiskz (0,0,z) =χB0R 2l 2
1 z
3
. (5)
Here χ is the magnetic susceptibility per unit volume, B0=4 Tesla is the static magnetic field of the scanner,ais the radius of the spherical water phantom, andRandlare the ra-dius and the thickness of the paramagnetic disk, respectively. A non-linear curve-fitting algorithm was used to calculateχ from axial measurements of∆Bz(0,0,z)for the water sphere and the paramagnetic disk.
The z-component of the induced magnetic field gra-dient along the z-axis was calculated from field differ-ences between adjacent voxels Gz(0,0,z) = [∆Bz(0,0,zi)−
∆Bz(0,0,zi−1)]/(zi−zi−1)).
A custom reconstruction program was written in IDL (Re-search Systems, Boulder, CO) to calculate the phase differ-ence image,∆φ(r), and the distribution of the magnetic field and the magnetic field gradient from the ratio of two complex images, and to fitχphantom andχdisk from the experimental magnetic field values using Eq. [5].
II. RESULTS
The separate experiments with the paramagnetic disk or the diamagnetic water sphere in the vicinity of the imaged phan-tom showed a pronounced signal loss artifact in the corre-sponding amplitude images (left Fig. 2, top and center panel, TE = 50-ms). However this artifact was significantly reduced in the experiment with both objects in the vicinity of the im-aged phantom (left Fig. 2, bottom panel). The phase differ-ence between the referdiffer-ence experiment (Fig. 1D) and exper-iments A and C (Fig. 1; TE = 5-ms) also showed the local-ized field inhomogeneity produced by either the phantom or the disk. The phase difference between experiments C and D demonstrates the partial cancellation of the field inhomo-geneity produced separately by the diamagnetic phantom or the paramagnetic disk.
FIG. 2: Sagital views(x=0)of the MRI signal amplitude (left) and phase (right) in the “imaged phantom” for GRE experiments with long (50-ms) and short (5-ms) TE. The amplitude images with the paramagnetic CuSO4disk (bottom) or the diamagnetic H2O sphere (top) show the signal loss (left) and phase wrapping (right) artifacts produced by the inhomogeneous magnetic field resulting from by these non-magnetic(χ<<1)objects. The amplitude and phase im-ages with the diamagnetic sphere and the paramagnetic disk show reduced artifacts (middle). The yellow dashed lines depict thez -axis.
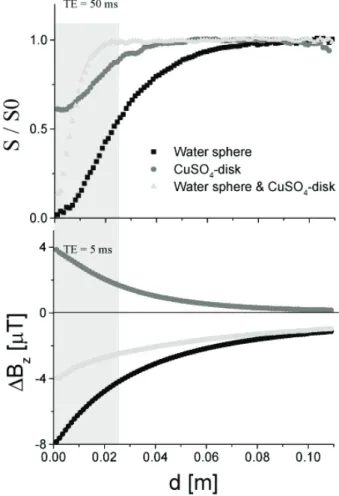
an extended region near the phantom’s edge (2.5 cm) due to intra-voxel spin dephasing. This artifact is significantly at-tenuated in the experiment with both objects (phantom and disk; 1B) because of their opposite magnetic properties. Fig-ure 3 bottom shows that the magnetic field offset due to the water sphere in the imaged phantom was negative and de-creased for closer distances, d, to the phantom wall. The magnetic field contribution of the disk, however, was posi-tive, and the combined field contribution of the disk and the phantom varied slower withd. The maximum absolute mag-netic field offset caused by the objects (A, B, and C) was lower than 8 mTesla. As shown in Fig. 4, the simple theo-retical models in Eq. [5] explain the data with better preci-sion than 95%. Note that the fitted susceptibility of the water solution in the phantom, χ(phantom) =−9.1±0.4×10⁻⁶, matches that of the pure water(14)χ(H2O) =−9.05×10⁻⁶.
The fitted susceptibility of the paramagnetic shimming disk wasχ(disk) =28±2×10⁻⁶.
FIG. 3: Relative GRE signals for TE = 50-ms that quantify the signal-loss artifacts (top), and the induced magnetic field (bottom) as a function of distance,d, to the edge of the “imaged phantom” for all three experiments with non-magnetic objects (Figs. 1A-C).
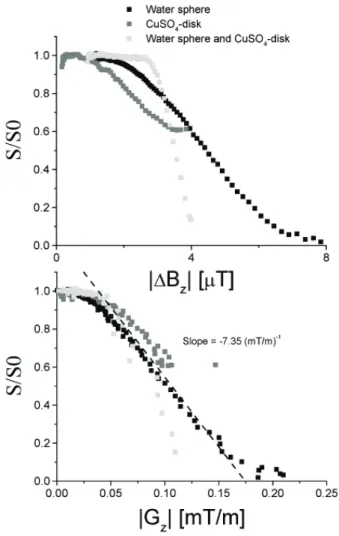
Increased signal drop was associated to increased magnetic field offset and induced magnetic field gradients for all three different conditions (Fig.5). Note that for TE = 50-ms and the voxel size used in this study, higher induced magnetic field gradients than 0.175 mT/m caused near complete signal loss due to loss of coherence of spins within the voxel.
III. DISCUSSION
Here we showed that the induced magnetic field gradients resulting from the diamagnetism of a water sphere caused GRE-MRI signal losses larger than 50% for imaging voxels in the phantom that were closer than one radius to the nearby water sphere (Fig. 3 top). We further demonstrated that a paramagnetic shimming disk significantly corrects this signal loss artifact.
FIG. 4: Induced magnetic field produced by the water sphere and the CuSO4-disk (symbols) as a function of distance,d, to the right edge of the “imaged phantom” and the corresponding fitting curves based in Eq. [5].
FIG. 5: Relative GRE signals for TE= 50-ms as a function of the amplitude of the induced magnetic field (top) or the induced mag-netic field gradient (bottom) along thez-axis (Fig. 2; yellow dashed line) in the “imaged phantom” for all three experiments with non-magnetic objects (Figs. 1A-C).
in a 4 Tesla MRI scanner with a 32-cm diameter homoge-nous magnetic field volume (same pulse sequence parame-ters). This limitation would worsen with increased magnetic field strength.
The paramagnetic passive shimming disk significantly cor-rected the MRI signal loss artifact caused by the nearby wa-ter sphere (Figs. 2 and 3). Previous MRI studies in hu-mans at 3 Tesla have placed diamagnetic pyrolytic graphite, which has a volume susceptibilityχv=−4.00×10⁻⁴in one plane, underneath the roof of the mouth to reduce signal losses in the orbitofrontal cortex near the sinus cavity (6,7), and both bismuth, the most strongly diamagnetic material in nature(χv=−1.66×10⁻⁴), and paramagnetic zirconium (χv= +0.92×10⁻⁴)were used as passive shimming materi-als to homogenize the magnetic field in the mouse brain at 9.4 Tesla (5). The present study suggests that the use of paramag-netic shimming devices can help to minimize susceptibility-related MRI signal losses and to increase the number of sam-ples in multi-sample MRI experiments. Bismuth and zirco-nium have stronger absolute magnetic susceptibility than our paramagnetic shimming disk(χ= +0.28×10⁻⁴); therefore, smaller amounts of these passive shimming materials could be needed to shim the magnetic field. However, because bis-muth and zirconium are metals they can perturb the homo-geneity of the radio frequency field and affect the MRI signal-to-noise ratio as well as produce eddy current artifacts during MRI when they are close to the sample. Differently, our para-magnetic shimming disk does not produce signal loss or eddy current artifacts because it is not metallic. Our paramagnetic shimming disk was made using a mix of non-expensive avail-able materials (CuSO4and carpenter glue) that can be easily shaped to shim arbitrary complex samples.
The magnetic field measurements in this work, which have a resolution of 1.5×10⁻⁸Tesla (0.00375 ppm), are based on a variant of the phase reference imaging method (11,12) that depicts the constant magnetic field contours. In the present work and similarly to our previous study on macrovascular contributions in functional MRI studies (15), the differen-tial phase accumulation between conditions was calculated from the complex ratio of two imaging experiments (Eq. [4]). These field measurements do not have contributions fromB0 -inhomogeneities because the complex image ratio eliminates the common field contributions that are present in the two ex-periments.
[1] Truong T, Clymer B, Chakeres D, Schmalbrock P, Three-dimensional numerical simulations of susceptibility-induced magnetic field inhomogeneities in the human head Magn Re-son Imaging 20 (2002) 759-770.
[2] Li S, Williams GD, Frisk TA, Arnold BW, Smith MB, A com-puter simulation of the static magnetic field distribution in the human head Magn Reson Med 34 (1995) 268-275.
[3] Li S, Dardzinski BJ, Collins CM, Yang QX, Smith MB, Three-dimensional mapping of the static magnetic field inside the hu-man head Magn Reson Med 36 (1996) 705-714.
[4] Schenck J, The role of magnetic susceptibility in magnetic res-onance imaging: MRI magnetic compatibility of the first and second kinds Med Phys 23 (1996) 815-850.
[5] Koch K, Brown P, Rothman D, de Graaf R, Sample-specific diamagnetic and paramagnetic passive shimming J Magn Re-son 182 (2006) 66-74.
[6] Wilson J, Jenkinson M, Jezzard P, Optimization of static field homogeneity in human brain using diamagnetic passive shims Magn Reson Med 48 (2002) 906-914.
[7] Wilson J, Jenkinson M, Jezzard P, Protocol to determine the op-timal intraoral passive shim for minimisation of susceptibility artifact in human inferior frontal cortex Neuroimage 19 (2003)
1802-1811.
[8] Bock N, Konyer N, Henkelman R, Multiple-mouse MRI Magn Reson Med 49 (2003) 158-167.
[9] Dazai J, Bock N, Nieman B, Davidson L, Henkelman R, Chen X, Multiple mouse biological loading and monitoring system for MRI Magn Reson Med 52 (2004) 709-715.
[10] Haase A, Frahm J, Hanicke W, Merboldt KD, FLASH imaging. Rapid NMR imaging using low ip angle pulses J Magn Reson 67 (1986) 257-266.
[11] Tomasi D, Panepucci H, Vidoto EL, Azevedo ER, Use of a phase reference for field mapping with amplitude images at low field J Magn Reson 131 (1998) 310–314.
[12] Tomasi D, Panepucci H, Magnetic field mapping with the phase reference method Magn Reson Imag 17 (1999) 157-160. [13] Jackson JD. Classical Electrodynamics. New York: John Wiley
and Sons; 1965.
[14] Schenck J, Safety of strong, static magnetic fields J Magn Res Imaging 12 (2000) 2-19.