Results Of Localized Alfv´en Wave Heating In TCABR
A. G. Elfimov, E. A. Lerche, R. M. O. Galv˜ao, L. F. Ruchko,
A. M. M. Fonseca, R. P. da Silva, and V. Bellintani
Departamento de F´ısica Aplicada, Instituto de F´ısica, Universidade de S˜ao Paulo, 05315-970, S˜ao Paulo, SP, Brazil
Received on 2 March, 2004; revised version received on 24 April, 2004
Using two dimensional numerical codes, we show that the direct electron heating found with electron cyclotron emission (ECE) radiometry is related to local Alfv´en wave resonances in Tokamak Chauffage Alfv´en Br´esilean (TCABR) plasmas. Them/N =1/2, 0/2 and 0/3 modes are dominant in the observed wave heating, due to Alfv´en wave continuum absorption. In particular, the resonant absorption of them= 0 sideband harmonic plays an important role in the central core and peripheral heating. The increase of the electron temperature during the radio frequency pulse was accompanied by a local density rise that produced a cut-off of the ECE emission. The observed heating profile is also consistent with the reflectometer measurements of the density fluctuations induced by radio frequency fields in the local Alfv´en wave resonance of them/N =-1/-2, 1/-3 modes in TCABR.
1
Introduction
In early studies, Alfv´en waves (AW) were proposed (see, for example, [1]) as an alternative to cyclotron heating in the ion cyclotron range of frequencies (ICRF) and current drive by fast waves in large tokamaks because of the avai-lability of high power radio-frequency (RF) generators, the simplicity of wave launching structures and the lack of the plasma density limit for current drive (in comparison with lower-hybrid waves). Recently, improvement of the energy confinement was achieved with internal transport barriers (ITB) created by neutral beam injection (NBI) and by wave heating in the ion cyclotron range of frequencies (ICRF) in all large tokamaks like Doublet-III-D, Joint European Torus (JET) and others (see, for example, review [2]). According to the theory, ITB appear in tokamaks because of the current profile modification (negative shear) or strongly sheared po-loidal rotation [3]. In this line of study, AW are currently being considered as a tool to control current profile and to drive the locally sheared plasma flow in tokamaks [4] be-cause they can deposit energy mainly at the local Alfv´en resonance. The idea of heating magnetically confined plas-mas by the resonant absorption of RF fields using the local AW resonance began with the theoretical work carried out by Dolgopolov and Stepanov [5], Grossmann and Tataronis [6], and Hasegawa and Chen [7]. AW heating is based upon mode conversion of an externally driven RF field below the ion-cyclotron frequency,ωci, into the kinetic or electrostatic
Alfv´en wave (shear AW) at the Alfv´en resonance layer. In the standard cylindrical model for wave excitation in toka-mak plasmas, the oscillating RF field is represented as a sum of helical harmonics exp[i(mθ+N z/R0−ωt)], wheremis
the poloidal andNis the toroidal (axial) wave numbers that
are excited in the plasma by an antenna current sheet,
jθ,φ=
X
M,N
Jθ,φ(M, N)δ(r−b) exp[i(M θ+N z/R0−ωt)]
Here, we note that, due to toroidal effects, the poloidal wave numbersmin the plasma may be different from those exci-ted by the antenna. The local AW resonance appears at the radiusr where the frequency of the RF field driven by an external antenna with axialNand poloidalmwavenumbers matches with AW frequency corresponding to the equation,
k2
||=
ω2
c2ǫ⊥ ⇒ k 2
||=
ω2
c2
AH
· n
i/ne 1−ω2/ω2
i
+ Aznz/ne 1−ω2/ω2
z
¸
(1) wherek||= (N/R0)(1 +m/N q)Bζ/Bis the parallel
com-ponent of the wavevector,q = (r/R0)Bζ/Bθ is tokamak
safety factor,cAH(r) =B/p4πmHne(r)is the Alfv´en
ve-locity in the hydrogen plasma,Bθ,ζare the poloidal and
to-roidal components of the magnetic fieldB, and R0 is the
major radius of the toroidal plasma column of minor radius
a. We note that the impurities with the same mass/charge ratio and the mass numberAzand densitynzare included
into AW continuum dispersion in eq.(1). This dispersion re-lation gives the local AW velocitycA =pAH/AefcAH in
low frequency limit whereAef =PiAini/ne. The
conti-nuous spectrum of these local resonance frequencies (1) is well known as the Alfv´en wave continuum [6].
In the AW continuum, when the electron thermal velo-city is larger then the local AW velovelo-city (vT e > cA), the
kinetic Alfv´en wave (KAW) is excited at the mode conver-sion surface, propagating towards the plasma center [7], and its Landau and/or collisional damping leads to electron he-ating. WhenvT e < cA, a slow quasi-electrostatic Alfv´en
and propagates towards the plasma boundary. The detai-led picture of resonant absorption was established by subse-quent theoretical work carried out by different investigators (see, for example, [8]-[13]) and experimentally confirmed in tokamaks [14]-[17] and stellarator [1, 18].
Furthermore, it was shown by Ross et al [9] and Appert et al [10] that AW can also be excited in a plasma column as global modes, i.e., their wave fields have a global structure corresponding to the discrete eigenfunctions of the proper boundary value problem. The eigenfrequencies of these glo-bal Alfv´en waves (GAW) lie just below the corresponding Alfv´en continua. Their existence was experimentally confir-med in the Tokamak Chauffage Alfv´en (TCA), PRETEXT and Phaedrus-T tokamaks [15, 16, 17]. Easy identification of GAW resonance with magnetic probes and its close po-sition to the AW threshold minimum (∆ωGW ≪ ωA,min)
calculated from eq.(1) was explored, as diagnostic tools (named Magneto-Hydro-Dynamic diagnostics) for defini-tion of the effective ion mass numberAef = PiAini/ne
and q-profiles in TCA, TEXTOR, JET tokamak experiments [22, 23, 24]. However, the strong dependance of∆ωGW on
toroidal wave number and current and density profile produ-ced substantial difficulties in the interpretation of the expe-rimental data.
The other difficulty of AW theory is toroidal effects, which can substantially modify the picture of Alfv´en wave absorption in tokamaks. In toroidal geometry, the theory predicts [10, 13, 20] that a set of different poloidal modes
m =M ±1,±2...(different from antenna modesM) can be exited because of the poloidal inhomogeneity of the to-roidal magnetic fieldB in the tokamak plasmas. Although the absorption peaks of GAW are well predicted by the cy-lindrical model, each global mode can now appear inside the continua of other toroidally coupled modes, bringing in toroidicity induced continuum damping, with damping rate much higher than predicted by kinetic cylindrical codes, and the power deposition profiles calculated with the kinetic to-roidal model [20] becomes much broader than in the cylin-drical case. To calculate the position of local AW resonances and the absorbtion profile in tokamaks, a multi (electron and ion) fluid toroidal code (ALTOK) was developed [21], where collisional dissipation is taken into account, which can also be useful in the conditions of cold plasmas (vT e < cA).
The toroidal effects were already verified in previous TCA experiments in Lausanne, where density fluctuations in the local AW resonance of the sideband harmonics exited by the GAW were detected by laser interferometry [19].
The TCA tokamak was transferred to the Plasma Labo-ratory of the University of S˜ao Paulo and renamed Toka-mak Chauffage Alfv´en Br´esilien (TCABR). A complete new antenna was designed and installed in the device [25], and some results (with and without Faraday screen) of AW he-ating and current drive (without any profile measurements) were reported [26, 27, 28]. Therefore, it is mandatory to investigate theoretically and experimentally the AW power deposition and RF field profiles for the plasma parameters of TCABR with the new antenna. Recently, using electron cy-clotron emission (ECE) radiometry, a direct demonstration of local AW electron heating with the modernized antenna was achieved in TCABR tokamak plasmas [29]. In
appro-ximately the same conditions, direct density fluctuations at the local AW resonance were detected using a simple reflec-tometer [30].
In this paper, we present results of the calculations with two dimensional codes [20, 21] related to the last results of localized AW heating [29, 30]. We show that combination of small AW power deposition in local AW resonances swa-ped by density variation (or scanned with AW frequency), in combination with detection of density fluctuations by reflec-tometer in the local AW resonance, can serve as diagnostic tools for identification of the effective ion mass numberAef
and q-profile in tokamaks. The idea is based upon the si-multaneous detection of the position ofm= 0andm=±1
local AW resonances that are excited byM/N = 1/2,1/3
antenna modes. According to eq. (1), them= 0resonance depends only on the effective ion mass number and does not depend on profile. Then, using this data we can define q-value at the position ofm=±1local AW resonances. The proposed method is most efficient in the low frequency band
ω≪ωci.
2
Parameters of TCABR and Plasma
Model
The calculations with codes [20, 21] have been carried out assuming circular cross-section tokamak geometry. To ob-tain good accuracy, five poloidal harmonics (m = M ±
1,±2) are used in the kinetic code and 263x59 mesh points are used in ALTOK code calculations. Here, we analyze the AW heating experiments [29, 30] in TCABR tokamak (minor radius a=0.18m, major radiusR0=0.615m, toroidal
magnetic field B = 1.15T) using the following basic plasma parameters: currentIP = 72 - 92 kA, with respective edge
safety factorq(a)≃3.2 - 3.8; line averaged plasma density
¯
n= (1−2)×1019m−3; central electron and ion
tempera-tures500eV and150eV, respectively; the working gas was hydrogen. The RF power delivered by the antenna was limi-ted toPRF ≤50kW and the generator frequency was fixed
atf = 4.0 MHz. The antenna module has two groups of
RF current carrying straps. These groups are positioned in two toroidal cross-sections separated toroidally by an angle about 220creating mainly the spectrum of the poloidalM=
±1 and toroidalN=±1,±2,±3modes.
To model the plasma conditions of TCABR in the calcu-lations of the RF fields with the kinetic code [20], we assume simple cylindrical fitting of plasma parameter profiles; para-bolic temperature profileTe,i =Te,i0[1−(r/a)
2]2+T
e,ia
with the pedestal electron and ion temperaturesTea= 20eV
andTia = 15eV, respectively. The electron density
pro-file is given by ne = n0[(1−(1−na/n0)(r/a)2)] with
n0 = 1.7−2.5×10¹⁹ m−3 andna = 2×10¹⁸m−3.
The ion density ni is taken to satisfy the requirement of
charge neutrality, P
iZini = ne. Using experimental
data that will be discussed in the sequel for IP = 89 kA
(qa = 3.4), with safety factorq0 = 0.97as indicated by
saw teeth oscillations, we chose the respective current pro-filej =j0[1−(r/a)2]2.4. The plasma profiles used in
AL-TOK code aren=n0(1−Ψ0.7)andj=j0(1−Ψ0.85)1.4,
different from those of the cylindrical plasma model. This difference appears because of the Shafranov shift and toroi-dicity effects. To explain better the experimental data [29], we assume that average effective mass numberAef is 1.2 in
accordance with Zef ≈ 1.6 found from ASTRA transport
code calculations. It means that the AW frequencies should be diminished by 10% in comparison with the ones obtai-ned for pure hydrogen plasmas. In Fig. 1a,b,c, we show the distribution of the q-parameter and equilibrium density, the m = 0,1, N = 2AW continuum frequency, and the respective distribution of absorbed power obtained with the kinetic and fluid codes. The RF fields are excited by the
M/N= -1/-2 antenna with 4 MHz frequency in AW conti-nuum (q0 = 0.97, n0 = 2.1×10¹⁹ m−3). Low electron
temperature (Te = 400eV) is used to show QESAW
exci-tation at the plasma boundary. In Fig. 1c, we can observe very good similarity in the distribution of absorbed power for both code calculations.
0.00 0.02 0.04 0.06 0.08 0.10 0.12 0.14 0.16 0.18 0.0
0.2 0.4 0.6 0.8 1.0
kinetic fluid code
radius (m)
a
b
s
o
rb
ed p
ow
e
r
den
s
it
y (
a
u
)
3 4 5
M/N=1/2 M/N=0/2 fA
(
M
H
z
)
0 1 2 3
c) b)
a) qtor
qcyl
ne,tor ne,cyl
q
, n
e
(
10
-19
m
-3 )
Figure 1. Plot of the density and q-profiles (a), Alfv´en wave con-tinuum frequency for m/N =-1/-2 and 0/-3 modes (b), and res-pective distribution of absorbed power calculated with kinetic and fluid codes (c).
3
Alfv´en wave Absorbtion and Fields
in TCABR
To begin the discussion of AW absorbtion in TCABR, we calculate the antenna impedance using the kinetic code for poloidal M= -1 and toroidal N = −2,−3 modes for the central density variation in the interval (1.75-2.1)×1019
m−3, giving line averaged densities (1.2-1.4)×1019m−3in
the TCABR experiments [29]. We calculate the antenna im-pedance [9]Za=W/Ian2 , whereW is total value of the AW
absorbed power andIanis antenna current. In Fig. 2, we
show the antenna impedance form/N=-1/-2, 0/-3 plasma modes excited with 4 MHz frequency. We can observe that AW continuum absorbtion begins fromn0 ≈ 1.95×10¹⁹
m−3 when the density grows. We stress our attention on this point because a density rise usually happens during AW heating [15, 29].
3.6 3.7 3.8 3.9 4.0 4.1 4.2 4.3
0 5 10 15 20 25 30 35 40 45 50 55 60
im
p
e
d
anc
e (
m
Ω
)
frequency (MHz)
Figure 2. The impedance for theM/N=-1/-2 antenna (dashed line
n0 = 1.75×10¹⁹m−3, solid linen
0 = 1.95×10¹⁹m−3, dash-dot linen0= 2.1×10¹⁹m−3), and for -1/-3 antenna (dash-dot-dot linen0= 1.95×10¹⁹m−3, doted linen
0= 2.1×10¹⁹m−3) cal-culated with kinetic code (Aef=1.2).
0.00 0.02 0.04 0.06 0.08 0.10 0.12 0.14 0.16 0.18
0.0 0.5 1.0 1.5 2.0 2.5 3.0 3.5
ne=2.0*1019m-3
n
e=2.1*10 19
m-3
ne=1.75*1019m-3, GAW
abs
or
bed po
w
e
r
den
s
it
y (
a
u
)
radius (m)
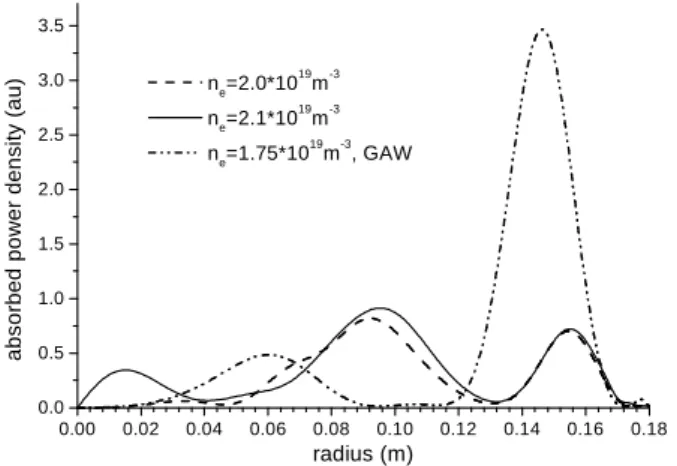
Figure 3. Plot of the power deposition profile for 4 MHz fre-quency andM/N =-1/-2 antenna forn0 = 1.75×10¹⁹ m−3,
n0 = 2×10¹⁹m−3,n0 = 2.15×10¹⁹m−3 (the other plasma
parameters are the same as in Fig. 2).
In Fig. 3, we present the power deposition profiles for th-ree central densities (n0= 1.75×10¹⁹m−3,n0= 2×10¹⁹
m−3,n0 = 2.15×10¹⁹m−3), respectively, in GAW
local AW resonance region. Analyzing the power distribu-tion in Fig. 3, we find that the best results for the plasma core heating is expected for the conditions of deep AW continua when, together withm/N = 1/2continuum, it appears the
m/N = 0/−3continuum absorbtion, as it shown in Fig. 2. In this case, them/N = 0/−3local AW resonance is ex-cited byM/N = 1/−3antenna in the plasma core.
4
Discussion of Experimental Results
In this section, we discuss the experimental measurements of radiative electron temperature [29] in TCABR with Elec-tron CycloElec-tron Emission radiometry (ELVA-1) (see reviews about ECE diagnostics in Ref.[31, 32]). Since the basic des-cription of the radiometry used in the experiments was ab-sent in the initial reference [29], we briefly describe ECE radiometry in Appendix.
4.1
Results of Alfv´en wave heating
experi-ments
The AW heating experiments were carried out in TCABR keeping the value of the plasma density rather low but above runaway density limitne0>1.5×10¹⁹m−3, to allow
rea-sonable accessibility of the second-harmonic electron cyclo-tron emissionne0<2.3×10¹⁹m−3, and to operate in a
win-dow of the AW continuum for which the resonant absorp-tion is not spoiled by cyclotron absorpabsorp-tion of impurity ions, such as O+3and O+4 (or C+3) at the plasma edge. Here,
we use the data from a typical time evolution plot of the plasma parameters (loop voltage, current, central line avera-ged density, bolometry and soft X-ray signals) for TCABR shot 9796 presented in [29]. The RF pulse of 50 kW power delivered by antenna begins att=75 ms with the pulse dura-tion about 10 ms during flat current (Ip=88kA) stage when
the monotonic density rise about 10-15%is observed. To get good time resolution of the relative electron tem-perature increase during the RF pulse, the electron tempera-ture is measured in only one radial position, displacing it on a shot-to-shot basis. Results of ECE time traces for different radial positions (with other TCABR parameters similar of those to shot 9796) are presented in Fig. 4, where the me-asured radiative temperature,Te, is normalized to its value < Te >averaged over 5 ms before the application of the
RF pulse. Sawtooth oscillations can be seen in some of the ECE traces. These oscillations have a period τsaw =0.44
ms, and the inversion radius (q = 1) occurs nearR =0.66 m, approximately 4cm from the magnetic axis. This infor-mation together with the boundary valueqa = 3.4, allows
a reasonable fitting of theq(r)profile to use in the simula-tions of the AW absorption, discussed in Sect.3. During the RF pulse, the temperature increased in all radial positions shown in Fig. 4, except in the layer betweenR =0.65 m andR=0.68 m, where the temperature dropped. This layer corresponds to the already referred ECE cut-off region that is just barely touched for a densityne0≈2.2×10¹⁹m−3,
and not fully achieved over the whole bandwidth of the ECE radiometer.
0 .9 1 .0 1 .1
R = 0.627m
0.9 1.0 1.1
R = 0.635m
RF
0.9 1.0 1.1
R = 0.6 51 m
0.8 0.9 1.0 1.1
R = 0.6 61 m
0.8 0.9 1.0 1.1
R = 0.673m
0.9 1.0 1.1
R = 0.6 83m
0.9 1.0 1.1 1.2
R = 0.6 93m
1.0 1.1 1.2 1.3
R = 0.7 01m
0 .9 1 .0
1 .1 R = 0.735m
70 7 5 80 85 90 95
1
1 .5 R = 0.755m
t (ms )
Figure 4. Time traces of the radiative electron temperature measu-red by the ECE radiometer over different chords, which are norma-lized to respective temperatures before RF pulse (Te/ < Te>) in
TCABR.
To get a better picture of the power deposition pro-file, in Fig. 5a, we plot the relative temperature increase
∆Te/ < Te>, as a function of the normalized minor radius (R−R0)/R0. The agreement between the relative
to-roidicity induced 0/-2 local AW resonance is responsible for most of the undesired power deposition near the plasma bor-der. Comparing the discussed power deposition with calcu-lated one for the GAW resonance shown in Fig. 3, we can conclude that the GAW power deposition is not consistent with the electron temperature variations except in the region near plasma border (m/N=0/-2 local AW resonance).
0.02 0.04 0.06 0.08 0.10 0.12 0.14 0.16 0.18
-20 -10 0 10 20 30 40 50
ECE cut-off
∆
Te
/T
e
(
%
);
abs
or
b
ed pow
e
r (
au)
radius (m)
0.62 0.66 0.7 0.74 0.78
0 200 400 600 800
R(m)
pR
F
(
k
W
/ m
3)
(0/-3) (-1/-2)
total b)
a)
Figure 5. Plot of the distribution of the normalized radiative elec-tron temperature taken from Fig. 4 at the beginning of the RF pulse and the respective distribution of absorbed AW power calculated with kinetic code forM =-1 andN=-3,-2 antenna (a); the absor-bed AW power distribution (black circles) calculated from the ex-perimental data in Fig. 4a in the comparison with the kinetic code calculations (b).
To check the consistency of the observed temperature variation with AW heating, we have estimated the total hea-ting power delivered by the antenna and compared the result with the measured RF absorbed power. The average heating power was estimated using the equation PRF =< ne >< ∆Te/τRF >. In this expression, < ne >is the average
plasma density in the layer of volume δ V and∆Teis the
mean electron temperature variation caused by the wave ab-sorbtion. Evaluating the average characteristic RF heating time from the initial temperature rise shown in Fig. 4, we obtained τRF ≈ 200µs. The values of the estimated
hea-ting powers shown in Fig. 5b are in a good agreement with code calculated absorption in these regions (3, 19 and 12 kW, respectively). For the three regions shown in Fig. 5, the total calculated power is about 34 kW, which is smal-ler than the total delivered power (50 kW). However, since
the power coupled into the radial layer with ECE cut-off and that coupled parasitically to the plasma edge were not accounted for, this estimate is at least consistent with the claim of direct AW heating. The loop voltage variation was similar (or slightly higher) to ohmic discharges without RF heating, i.e., there was no loop voltage decrease correspon-ding to heating and current drive [17]. To make the results of transport simulations carried out with the ASTRA code consistent with the observed heating and time evolution of the loop voltage, we have to increase the value of the ef-fective charge numberZef=1.6 by10−15%, produced by
fully ionized carbon or oxygen impurities, what corresponds to a variation of the effective mass numberAef from 1.2 to
1.3. We note that the experimental error is about 2-3 cm in the position of the radiative temperature maxima found with ECE radiometer, which is too large to help in identification of q-values in the local AW resonances.
4.2
Identification of Local AW Resonance
with Reflectometer
As was shown by Ruchko and co-authors [30], the density fluctuation rise in the AW power deposition regions can be detected by a reflectometer with the fixed frequency (32.4 GHz). The detection principle is based on the reflection of theO-mode field from the cut off layer density defined by the condition nctf = πfref2 me/e
2. For a small
den-sity perturbation presented in the one dimensional form,
δnecos [kr(r−rc)](rcis the location of the cutoff layer), a
simple expression for the perturbed phaseδφcan be used,
δφ≈2k0
p
Ln/krδne/ne, Lnkr>1
whereLnis the density scale length at the cutoff layer,kris
the wave number of the density perturbation in the direction of wave propagation. In hot plasmascA< vT e, using the
re-sults of Ref. [9] the amplitude of the density fluctuations in the local AW resonance is defined by the simple equations,
|δne| ne =
e|E˜k|
mekkvT e2
, |E˜k|= 2 v u u t
√
8πk3
kv
3
T e πω2
peω2ref
˜ p (2)
wherep˜is the absorbed power density. In Fig. 6, we show the time traces (70-100 ms) of the loop voltage, line ave-raged density, toroidal current, and respective amplitude of oscillating phase measured with the reflectometer in dis-charge#10668, with AW heating [30]. The perturbed den-sity trace during RF pulse is restored from bolometry sig-nal∼ Z4
effn 2
e/T
3/2
e , assuming that there is smallZeff rise
from 1.6 to 1.8, as found from ASTRA calculations using the small loop voltage increase (∼Zeff/T
3/2
e ) at the
75 80 85 90 95
-1.0 -0.5 0.0 0.5 1.0 1.5
amplitude phase
time (ms)
δδδδ
ne,
4M
Hz
(au),
φφφφ
77 78 79 80
current (kA
)
1.0 1.5 2.0
Uohm,10669
c)
b)
a)
RF pulsene
URF,10668
lin
e
d
e
n
s
ity
(1
0
19 m -3 ),
l
oop (
V
)
Figure 6. The time traces (70-100 ms) of the loop voltage and line averaged density (a), toroidal current (b) and respective amplitude of oscillating phase measured with reflectometer (c) in the TCABR discharge with AW heating (#10668).
Generally, the RF power deposition and respective den-sity oscillation regions are defined by the local AW reso-nance (1), which depends on the generator frequencyfRF = ω/2π, poloidal and toroidal wavenumbers (m/N), the cen-tral plasma density, the safety parameter q and effective mass numberAef. It is convenient to rewrite eq.(1) in the
form of the definition for the AW resonance density,
nA=n0
c2
AH(0)k||2(r)
ω2
· n
i/ne 1−ω2/ω2
i
+ Aznz/ne 1−ω2/ω2
z
¸−1
(3) The cross section of thenAvalue with the electron plasma
density gives us the local AW resonance position. From eq.(3), we find that the scanning of the local AW resonance density in relation to the cut off density is possible only with growth of the impurity densitynzor with q-parameter
vari-ations. In Fig. 7a, using the parameters of this shot we show the Alfv´ennA(form/N =−1/−2,1/−3) andneelectron
density distributions over radius and the position the cut off densitynctf = 1.29×10¹⁹m−3. The respective amplitudes
of the density fluctuations for 4 MHz frequency, m/N =
−1/−2,1/−3, n0= 1.9×10¹⁹m−3, nz/ne= 1.6%and m/N = −1/−2, n0 = 2.1×10¹⁹m−3, nz/ne = 2.4%
are shown in Fig. 7b. Here, we can observe that the lo-cal AW resonance (m/N=1/-3) can be excited at the cut off density at the beginning of RF pulse and the local AW reso-nance (m/N=-1/-2) is excited at the end of RF pulse related to Fig. 6.
0.00 0.02 0.04 0.06 0.08 0.10 0.12 0.14 0.16 0.18 0.0
0.2 0.4 0.6 0.8 1.0
|ñ
| (
1
0
16 m -3 )
radius (m) 0.0
0.5 1.0 1.5 2.0
d
e
n
s
it
y n
e
a
n
d n
A
(
1
0
19 m -3 )
Figure 7. Plot of (a) Alfv´en density distributions for Aef=1.17,
q=1.03,m/N =−1/−2(dash-dot line) andm/N =-1/3
(dash-dot-dot line) modes, and forAef=1.25, q=1.07 (solid line) over
radius, the electron density distributions (n0 = 1.9×10¹⁹m−3 dashed and n0 = 2.1×10¹⁹m−3 short dashed lines), the cut off density is marked by dotted line; (b) the amplitudes of the AW density fluctuations for 4 MHz frequency, respective to (a),
m/N=-1/-2 (dash-dot linen0 = 1.9×10¹⁹m−3 and solid line
n0 = 2.1×10¹⁹m−3), m/N=1/-3, (dash-dot-dot line n 0 =
1.9×10¹⁹m−3).
5
Conclusion
Theoretical analysis show that RF heating detected with electron cyclotron emission (ECE) radiometry is related to local AW electron power deposition in TCABR tokamak plasmas. The increase of the electron temperature during the radio frequency pulse was accompanied with the local density and Zeff rise that produces an cut-off of the ECE
emission. The observed heating profile is consistent with the numerical calculations of the power deposition profile due to continuum Alfv´en wave absorption. Them/N=-1/-2 and 0/-3 AW continuum modes are dominant in the plasma core heating. In particular, the resonant absorption of the
Using the reflectometer with fixed frequency (32.3 GHz), local density fluctuations with 4 MHz frequency are found at local AW resonance. Theoretical analysis shows that the maxima of the detected phase shift are produced due to the local AW resonances ofm/N=-1/-2 and 1/-3 modes. Finally, we can conclude that combination of AW ex-citation system with the ECE radiometry and the swap fre-quency reflectometer can be very power diagnostic tools to localize the AW power deposition, and to find effective mass numberAeff and q-profiles in tokamak experiments.
Acknowledgments
We are thankful to our colleagues, participating in RF heating experiments in TCABR: J. I. Elizondo, A. N. Fa-gundes, Yu. K. Kuznetsov, I. C. Nascimento, E. M. Ozono, W. P. de S´a, E. A.O. Saettone, E. K. Sanada, J. H.F. Se-vero, O. C. Usuriaga, and A. Vannucci, and G.Amarante for collaboration. This work has been supported by the Natio-nal Research Council (CNPq) of Brazil and the State of S˜ao Paulo Research Foundation (FAPESP).
Appendix.
Electron Cyclotron
Emis-sion Radiometer
A millimeter microwave detection system used for electron cyclotron emission measurements in the TCABR is a he-terodyne sweeping radiometer based on a Backward Wave Oscillator (BWO), which operates in the frequency range of 52-85 GHz. The system can operate in two modes: fixed frequency (time resolution of 10µs) and sweeping mode (50
µs per step). The radiometer is calibrated in frequency and in radiation intensity. The frequency calibration is made by means of an precision harmonic oscillator (54, 60, 66, 72, 78 and 86GHz). The absolute calibration was carried out using a blackbody (microwave absorber) immersed in liquid nitro-gen (77K) and also put in an oven with adjustable tempera-ture up to 1470K. Two other components are also used for periodic intensity calibration check: a Cryogenic Matched Load and a Noise Source (time stability of .001dB/0C and flatness +/-1.5dB). A mechanical waveguide switch and a 20 dB directional coupler are used to commute the radiome-ter from the measurement mode (coupled to the plasma) to the calibration mode. A Gaussian antenna is used for better space resolution measurements. Between the antenna and the radiometer, oversized waveguide are used to reduce the signal attenuation. The antenna axis is posed in the equa-torial plane of the machine and perpendicular to the plasma column axis.
To use of ECE radiation for temperature measurements, the accessibility and absorption conditions must be taken into account. For a magnetic field of BT0= 1.15 T, it
was calculated and verified with density rise experiments in TCABR that the maximum permissible density to access the second harmonic in the X mode isne0 = 2.3×10¹⁹m−3.
For the absorption condition of the black body radiation the most important parameter is the optical thickness. Using the optical thickness (τ) equation taken from Ref.[31], we cal-culate that the optical thickness conditionτ ≥1is satisfied in the TCABR plasma core, -0.1m≤R−R0≤0.1m.
References
[1] A.G. Elfimov, A.G. Kirov, and V.P. Sidorov, In High Fre-quency of Plasma Heating, edited by Litvak A G (Transl. Series, AIP, New York, 1992) p. 239.
[2] K. H. Burrell, Phys. Plasmas 4, 1499 (1997).
[3] H. Biglari, P. H. Diamond, and P. W. Terry, Phys. Fluids, B
2, 1 (1990).
[4] A.G. Elfimov, R.M.O. Galv˜ao, I.C. Nascimento, and G. Amarante-Segundo, Plasma Phys. Controll. Fusion, 40, 451 (1998).
[5] V. V. Dolgopov and K. N. Stepanov, Nucl. Fusion5, 276 (1965).
[6] W. Grossmann and J. A. Tataronis, Z. Phys. 261, 217 (1973).
[7] A. Hasegawa and L. Chen, Phys. Rev. Lett. 35, 370 (1975).
[8] A. G. Elfimov, in: 2nd Joint Grenoble-Varenna Int. Symp. on Heating in Toroidal Plasmas, Como, Italy, 683, (1980).
[9] D. W. Ross, G. L. Chen, and S. M. Mahajan Phys. Fluids,
25, 652 (1982).
[10] K. Appert, R. Gruber, F. Troyon, and J. Vaclavik, Plasma Phys. 24, 1147 (1982).
[11] K. Itoh and S. I. Itoh, Plasma Phys. 25, 1037 (1983).
[12] I. J. Donnelly, B. E. Clang, and N. F. Craner, J. Plasma Phy-sics 35, 75 (1986).
[13] J. Vaclavik and K. Appert, Nucl. Fusion, 31, 1945 (1991).
[14] B. Joye, A. Lietti, J. B. Lister, J.M. Moret, and W. Simm Phys. Rev. Lett. 56, 2481 (1986).
[15] G. A. Collins, F. Hofmann, B. Joye, R. Keller, A. Lietti, J.B. Lister, and A. Pochelon Phys. Fluids, 29, 2260 (1986).
[16] T.E. Evans, P.M. Valanju, J.F. Benesch, R. Bengston, Y. Li, S. Mahajan, M. Oaks, D. Ross, X. Wang, and J. Watkins Phys. Rev. Let., 53, 1743 (1984).
[17] T. Intrator, P. Probert, M. Vukovic, S. Wukitch, A.G. Elfimov, R. Durst, R.A. Breun, D. Brouchous, D. Diebold, M. Doszy, R. Fonk, N. Hershkowitz, M. Kishinevsky, C. Litwin, R. Ma-jesky, and P. Nonn G. Winz Phys. Plasmas, 3, 1331 (1996).
[18] O. M. Shevts, I. A. Dikij, S. S. Kalinichenko, A. I. Lysojvan, N. I. Nazarov, T. Yu. Ranyuk, D. L. Grekov, K. N. Stepanov, and V. T. Tolok, Nucl. Fusion 26, 23 (1986).
[19] R. Bhen, G.A. Collins, J. B. Lister, and H. Weisen Plasma Phys. Contr. Fusion 29, 75 (1987).
[20] G. Amarante-Segundo, A. G. Elfimov, D. W. Ross, R. M.O. Galvo, and I. C. Nascimento, Phys. Plasmas, 6, 2437 (1999).
[21] S. A. Galkin, A. A. Ivanov, S. Yu. Medvedev, and A. G. Elfi-mov Comp. Phys. Communications, 143, 29-47, (2002).
[22] G.A. Collins, A.A. Howling, J. B. Lister, and Ph Marmillod, Plasma Phys. Contr. Fusion 29, 323 (1987).
[23] P. Descamps, G. Van Wassenhove, R. Koch, A.M. Messiaen, and P.E. Vandenplas Phys. Let. A 143, 311 (1990).
[24] J. B. Lister, L. Villard, and G. de Rider,: Plasma Phys. Contr. Fusion 40, 1635 (1998).
[26] E.A. Lerche, E. Ozono, L.F. Ruchko, R. M. O. Galv˜ao, A.G. Elfimov, Yu. K. Kuznetsov, I.C. Nascimento, A. N. Fagundes, W.P. de S´a, E. Sanada, J.I. Elizondo, D.O. Campos, R. Va-lencia, A. Vannucci, M.V.P. Heller, I.L. Caldas, V.P. Tsypin, A.A. Ferreira, E.A.Saetone, J.H.F. Severo, and V. Bellintani “Preliminary Results on Alfv´en wave Heating in the TCABR Tokamak”, AIP Conference Proc. 563, 191 (2001).
[27] A. G. Elfimov Phys. of Plasmas, 8, 2050 (2001).
[28] L. F. Ruchko, E. Lerche, R. M. O. Galv˜ao, A.G. Elfimov, I.C. Nascimento, W.P. de S´a, E. Sanada, J.I. Elizondo, A.A. Ferreira, E.A. Saetone, J.H.F. Severo, V. Bellintani, and O.N. Usuranga Braz. J. Phys., 32, 57 (2002).
[29] R. M. O. Galv˜ao, V. Bellintani, Jr., A. G. Elfimov, A. N. Fa-gundes, A. M.M. Fonseca, Yu. K. Kuznetsov, E. A. Lerche, I. C. Nascimento, E.K. Ozono, L. F. Ruchko, and J. H.F. Se-vero, 30th EPS Conference on Plasma Phys. and Contr.
Fu-sion, 7-11 July 2003, St.Pitersburg, Russia, ECA, 27A, (P-4.50) (2003).
[30] L. F. Ruchko, R. Valencia, R. M. O. Galv˜ao, E.A. Lerche, A.G. Elfimov, V. Bellintani, J.I. Elizondo, A.N. Fagundes, A.M.M. Fonseca, Y.K. Kuznetsov, I.C. Nascimento, W.P. de S´a, E. Sanada, and R.P. da Silva Rev. Scientific Instruments,
75, 655 (2004).
[31] M. Bornatici, R. Cano, O. De Barbieri, and F. Engelmann, Nuclear Fusion, 23, 1153 (1983).
[32] H. J. Hartfuss, T. Geist, and M. Hirsch, Plasma Phys. Contr. Fusion 39, 1693 (1997).
[33] V. L. Ginsburg, Propagation of Electromagnetic Waves in Plasmas (Gordon and Breach, New York, 1961).