Identification of the Alfv´en Wave Resonances in the TCABR
Tokamak by the Microwave Reflectometry
L. F. Ruchko, R. M. O. Galv˜ao, E. A. Lerche, A. G. Elfimov, V. Bellintani Jr,
J. I. Elizondo, A. N. Fagundes, A. M. M. Fonseca, Yu. K. Kuznetsov, I. C. Nascimento,
W. P. de S´a, E. Sanada, R. P. da Silva,
Instituto de F´ısica, Universidade de S˜ao Paulo, 05315-970, S˜ao Paulo, Brazil
and R. Valencia
Instituto Nacional de Investigaciones Nucleares, C.P. 11801, M´exico, D.F., M´exico
Received on 2 February, 2004; revised version received on 24 April, 2004
The experimental results on the Alfv´en mode structure identification by the microwave reflectometry in TCABR tokamak are presented. The knowledge of the spatial spectrum of the excited waves is crucial for optimization of Alfv´en wave plasma heating and noninductive current drive scenarios in tokamak plasmas. No less important is the possibility to use the Alfv´en wave excitation for diagnostic purposes. A microwave reflectometer with fixed frequency was used to register plasma density oscillations driven by the excited Alfv´en waves, under the condition of the spectrum scanned by a controlled plasma density rise. It is shown that when the position of the local Alfv´en resonance,rA, which is defined by relationω=k//(rA)CA(rA), is close to the plasma zone
where the microwave signal is reflected, the high-frequency modulation of the output signal of the reflectometer at theRF generator frequency increases. The possibility to use the observed effect for finding the plasma current profile in tokamaks is discussed.
1
Introduction
The study of the excited RF field structure is essential part of the Alfv´en wave experimental program that is currently carried out in TCABR tokamak [1, 2, 3]. These experiments should help to find out the optimal conditions for antennae performance and to ensure the effective plasma heating and noninductive current drive.
In the course of these studies the spatial spectrum of the excited waves M, N ( whereM andN are poloidal and toroidal wave numbers correspondingly) is analyzed by ma-king a comparison of signals from magnetic probes with the theoretical simulations. The shortcoming of commonly used RF magnetic probe diagnostic system, which is used for me-asuring the spatial spectrum and phase velocity of Alfv´en waves, lies in the fact that it can pick up magnetic fields at the plasma boundary only, where plasma temperature is low. The mesurements of the Alfv´en wave structure in the plasma inner regions have to be carried out by other methods. One of these methods consists of the registration of plasma den-sity perturbations, which are driven by Alfv´en waves.
In the AW heating scheme, the waves are launched by an external antenna structure. These waves, propagating towards plasma center, can be converted into kinetic Alfv´en wave (KAW) at specific magnetic surfaces, where their phase velocity equals the local Alfv´en velocity CA(r) =
B/pµ0mini(r), and are further dissipated through Landau damping on thermal electrons (vth ≈ vA) [4]. The loca-tion of the mode conversion zone determines the RF power deposition region, where plasma density oscillations at the
frequencyωof the applied RF field are excited. This posi-tion,r=rA, depends on the RF frequencyωRF and on the excited wave mode numbersM, Naccording to the disper-sion relation
ω2 RF =k
2 //(rA)C
2
A(rA)(1−ω 2 RF/ω
2
ci) (1)
where
k//(r) =N
R
·
1 + M
N q(r)
¸
(2) HereB is the magnetic field with toroidal componentBT and poloidal componentBP,ωci=ZeB/miis the ion cy-clotron frequency,miandniare ion mass and number den-sity, respectively,q(r) = rBT/RBP(r)is safety factor,R is the major radius of the plasma column, andr is the ra-dial coordinate of a pseudo-toroidal coordinate system cen-tered at the magnetic axis. It is seen that the position of the
AW deposition zone, where intensive plasma density oscil-lations are excited, depends both on the plasma parameters
n(r), q(r), mi and on theRF field characteristics M,N,
f =ωRF/2π.
The magnitude of plasma density oscillations in the course of the AW excitation has maximum value in the vici-nity of the AW resonance layer
e
n(r)
n =
e¯¯¯ eE//
¯ ¯ ¯
mev2th
¯ ¯k//
¯
¯, (3)
whereEe// =
s
8√2πk3 //v
3 th
πω2 peω
2 RF e
mag-netic field component of the oscillating electric field of the KAW, vth is electron thermal velocity, and ep(r) is speci-fic dissipatedRF power. The numerical calculations have shown that the RF input energy is deposited within few ion gyroradii of the resonance layer and density fluctuati-ons, too, are concentrated near the resonance layer [5].
Plasma density oscillations driven by launched AW were experimentally investigated in the PRETEXT [6] and TCA [7] tokamaks. In the former device, the spatial structure of the density fluctuations associated with the excited AW was measured by laser interferometry, using a CO2-laser inter-ferometer system that had its detection circuitry electrically referenced to theRFcurrent through a high-frequency lock-in amplifier. This provided a large signal-to-noise level and insured that only driven density oscillationsne were detec-ted. The detected signal was a measure of the line inte-gral of the amplitude and the phase of density fluctuations,
e
∆ = (2π/λnc)R en(y)dy, whereλ=10.6µmandnc≃1025 m−3
is the cutoff density. The results were in good agre-ement with the predictions of the kinetic theory of global Alfv´en wave excitation.
In the TCA tokamak [7], the AW driven plasma density fluctuations were studied with a phase-contrast imaging in-terferometer [8]. This system provided a simultaneous me-asurement of the amplitude and phase of the line integral of the density fluctuations at sixteen different radial locations betweenr/a= 0andr/a∼= 0.8. These results confirmed the effect of mode conversion to the kinetic Alfv´en wave, at the shear Alfv´en wave resonance layers, and agreed with the KAW dispersion relation [4]. The observed wave fields were well modelled by the kinetic calculations.
These experiments [6, 7] have proved the possibility to drive plasma density oscillations with a predefined spatial structure, with the help of externally excited Alfv´en waves, for diagnostic purposes. However, the registration and in-terpretation of these oscillations through the line integra-ted interferometer signals is rather complicaintegra-ted and some information about the radial structure can be inaccessible. In the sequel we present experimental results, which show that these oscillations can be detected by microwave reflec-tometry and an essential information about localization of RF power deposition zone and mode structure can be obtai-ned.
Microwave reflectometry is more convenient diagnostic method for Alfv´en wave detection due to its great capability to perform measurements of electron density fluctuations in tokamaks with both high temporal and spatial resolutions. A description of different techniques used in reflectometry measurements can be found in the reviews [9, 10]. The re-flectometry signals are extremely sensitive[10, 11] to plasma density oscillations in the cutoff layer. Due to this feature microwave reflectometry is now routinely used for probing the structure of magnetohydrodynamic and turbulent fluctu-ations in fusion plasmas.
The interpretation of reflectometer signal in the one-dimensional (1-D) geometry is relatively simple. In this case, a plane stratified plasma with permittivity ε(r) =
ε0(r) +δε(r), where ε0(r)is the permittivity of the un-perturbed plasma andδε(r) = δne
dε0
dne
is fluctuating part,
is probed by a wave propagating in ther-direction. Under these conditions the fluctuating phase of the reflected sig-nal is given by the approximation of geometric optics[11], wherercis the location of the cutoff layer.
δφ=k0 Z rc
0
δε(r)
p
ε0(r)
dr. (4)
For the O-mode and for a small density perturbation of the formδnecos[kr(r−rc)]simple expression for the pertur-bed phaseδφis given by
δφ≈2(k0Ln)
δne
ne
, krLn <1, (5)
δφ≈2k0(
Ln
kr
)1/2δne
ne
, krLn>1, (6) whereLnis the density scale length at the cutoff layer,kris the wave number of the density perturbation in the direction of wave propagation.[10] A general analysis of the sensiti-vity of reflectometry to perturbations of the plasma profile, using a full-wave description in one dimension, has proved that the approximation of geometric optics can also be ap-plied to large perturbations also [12]. However, the limita-tion of the method as a linear detector of long wavelength fluctuations has to be taken into account. The application of microwave reflectometry to the study of density oscillations driven by fast magnetosonic waves in the TFTR, assuming the validity of geometric optics for reflectometer measure-ments, has shown that linearity to the fast wave amplitude is restricted to density fluctuation levels (δn/n <10−3
) [13]. Beyond this level, over modulation of the wave front near the reflecting layer occurs what makes it difficult the inter-pretation of the experimental results.
The interpretation of reflectometry becomes considera-bly more complicated in the case of multidimensional fluc-tuations where, as in the case of tokamaks, the plasma per-mittivity varies perpendicularly to the direction of propa-gation of the probing wave. In this case two-dimensional full-wave simulations of reflectometry experiments are used [14, 15, 16].
New possibilities of the diagnostic technique can be re-alized by integrating it with Alfv´en wave (AW) excitation by external antennae. In the course of AW driving, coherent plasma density oscillations are excited in predefined plasma regions and the registration of the related perturbations by the reflectometry technique can be used for diagnostic pur-poses [3]. The favourable functional dependence of AW ex-citation zone on the plasma parameters permits easy identi-fication of excited modes by microwave refflectometry.
In the sequel we present experimental results on the de-termination of these oscillations by microwave reflectometry and show how this can be used for diagnostic purposes.
2
Theoretical considerations
The advantage of utilization of the reflectometer technique for registration of AW driven density oscillations is clearly seen after comparison of the AW dispersion relation (Eq.1) with the expression for the reflectometer O-mode cutoff po-sitionω2
p(rc) =ω 2
in the plasma region, where the reflectometer signal experi-ences cutoff, we can substituteωp(rA)by reflectometer fre-quencyωand obtain (we have assumed here thatne≈ni)
N R
·
1 + M
N q(rA)
¸ r
me
mi
=ω ωRF cωce
p
(1−ω2 RF/ω
2 ci)
, (7) whereωceis the electron cyclotron frequency.
This equation gives theAW dispersion in the plasma re-gion where the reflectometer signal is reflected. It is seen now that all variables on the right hand side of the Eq.7 are known and hence the magnitude of the left hand side can be found. Thus, if AW with predefined spectrumM, N
are excited in a plasma with known mi, then the local va-lueq(rA)can be found by finding the frequency, at which the reflectometer signal is modulated byAWfrequency, and by measuring therAposition by the reflectometer technique [9]. This diagnostic can be realized by sweeping the reflec-tometer frequency.
In the course of experiments, which were carried out in the TCABR tokamak, the reflectometer with fixed frequency
f ≈32.3GHz was used, and the microwave cutoff density was given by
nc= ε
0me(2πf)2
e2 ≈1.3×10 19
m−3
. (8)
That is why in order to verify the possibility to registerAW
driven modes by relectometer technique we have carried out the experiments with the density scan instead of reflectome-ter frequency sweeping. The frequency of RF generator, which was used for the excitation ofAW, has been chosen in such a way that Alfv´en resonance area and the reflecto-meter cutoff region were overlapping in the course of a con-trolled density rise. In this case, the output signal of the reflectometer is modulated by the frequency of the Alfv´en wave and the location of theRFpower deposition zone can be directly monitored. If the position of the Alfv´en wave re-sonance zone does not coincide with the cutoff zone of the microwave reflectometer signal, then the degree of modula-tion of reflectometer signal by the AW frequency decreases. The radial structure of the plasma density oscillations, which were excited byAW in these experiments in TCABR tokamak, was analyzed with the help of 2-D kinetic mo-del [17]. The calculations have shown that density oscil-lations are localized in the vicinity of Alfv´en resonance zone. The esimates show that in this case the condition
kr < k0/(k0Ln)1/3 is satisfied, and the approximation of geometric optics is valid[11]. The oscillating component of the signal phase, which was calculated with the help of the Eq.4, is equal toδφ ≈ 0.3. It means that linearity of the output signal of the reflectometer to the AW driven density oscillations is not violated.
The dependence of the Alfv´en resonance position,rA/a, for different Alfv´en wave modes, and of the microwave cu-toff layer,rc/a, on the line averaged densityhneiis shown in Fig. 1.
Figure 1. Dependence of the normalized Alfv´en wave resonance positionrA/aon the line averaged plasma density < n >for
the modes: (1)M = ±1, N = ∓1, (2)M = ±1, N = ±1, (3)M = ±1, N = ∓2, (4)M = ±2, N = ∓3, (5)M = ±1, N =∓3, (6)M=±2, N =∓4, (7)M=±1, N=±2, (8)
M=±1, N=∓4, and of the position of the reflectometer cutoff surface,rc/a(9).
The points for which the curvesrA/aandrc/aintersect correspond to superposition of the region of the Alfv´en wave resonance with that of microwave reflection, where enhan-cement of the reflectometer output signal is expected. The values ofrAwere calculated according to Eqs. 1 and 2, as-suming that the plasma current density is given by
j(r) =j(0)
µ
1−r 2
a2 ¶αj
, (9)
where αj =q(a)
q(0)−1, and the electron density is given by
ne(r) =ne(0)
µ
1− r 2
a2 ¶αn
. (10)
In these calculations the values of parameters wereαj = 2,
q(a) = 3.2(IP = 90kA), andαn= 0.8.
It is seen that, for chosen parameters, the curve, descri-bing the position of the microwave cutoff layer,rc/a, inter-sects three AW resonance zones for the mode numbersM = ±2, N = ∓4, at< n >≃ 1.2×10¹⁹
m−3
,rc/a ≃ 0.47;
M =±1, N=∓3, athni ≃2.1×10¹⁹ m−3
,rc/a≃0.78; and M = ±1, N = ±2, at hni ≃ 1.8 × 10¹⁹
m−3 ,
rc/a ≃ 0.73. This means that only these modes can con-tribute to the plasma density oscillations, which can be re-gistered by the reflectometer at the operational frequency. As consequence, these modes can be uniquely distinguished and they can be used for discharge diagnostics.
The numerical simulations have shown that TCABR an-tenna system can ensure sufficient spatial localization of the
scan permits to achieve the overlapping of the reflectome-ter cutoff zone with localized Alfv´en wave driven density oscillations.
1
2
3
4
0 0.2 0.4 0.6 0.8 1 0 0.02 0.04 0.06 0.08
<ne> f=4.0 MHz
r/a
Za(Ohm)
Figure 2. Dependence of the radial distribution of TCABR antenna impedance on the line averaged plasma density< ne>.
The phase of the density oscillations is directly related to the phase of the RF antenna current and this fact per-mits to use the latter as reference signal in the reflectometer detection system. This allows increasing the sensitivity and improving the signal/noise ratio. The great advantage of the proposed diagnostic technique is the elimination of the in-fluence of the reflections from the tokamak vacuum chamber elements, because only reflections from plasma cutoff layer will contribute to output signal.
3
Experimental setup
The experiments were carried out in the tokamak TCABR (a=0.18m, R=0.61m, B = 1.1T) [1, 2]. The basic parame-ters in this investigation were the following. Plasma current:
IP = 70 - 95 kA; edge safety factor: q(a) ≃3.1 - 4; line averaged plasma density: hni = (0.9−2.5)×1019
m−3 ; working gas: hydrogen. TheRF power absorbed by the plasma was limited toPea ≤40kW and the frequency was fixed atf = 4.0MHz.
The AW antenna module has two groups of RF current carrying straps. These groups are positioned in two toroidal cross-sections, which are separated toroidally by an angle ≃20◦. Each group consists of two straps that are positioned symmetrically in relation to the equatorial plane of the va-cuum chamber at the poloidal coordinates±45o. The poloi-dal extension of each strap is approximately90o. In the basic regime of operation, the straps in the same toroidal cross-sections are fed by RF currents with(0, π)phasing so that they can excite mainly the modesM =±1,N=±1,±2... The AW antennae have no Faraday screens. Instead la-teral protection is provided by boron nitride BN side plates, fixed directly on both sides of each strap, thus avoiding addi-tional supports and ensuring individual protection from ion and electron toroidal fluxes.
The diagnostic tools include conventional electrotechni-cal measurements of the loop voltage UL, plasma current
IP, plasma column shift (∆R,∆z), plasma energy content, by the diamagnetic signal and calculated plasma equilibrium parameters, optical measurements of theHαradiation, and fast bolometer measurements. The line averaged plasma density was measured by a three-channel microwave inter-ferometer.
A schematic representation of the reflectometer diagnos-tic scheme is shown in Fig. 3. The reflectometer operates in the continuous regime at the fixed frequency f ≈ 32.3 GHz, which corresponds to a cutoff plasma densitync ≈ 1.3×10¹⁹
m−3
. The microwave power is fed from the klys-tron oscillator (1) to the antenna (8) by a oversized wave-guide. The same antenna (8) is used as transmitter and re-ceiver. It consists of a circular horn terminated by a lens. The antenna is installed in the tokamak midplane in the im-mediate vicinity of the glass window of the tokamak va-cuum chamber. The antenna spot is on the order of 4 - 6 cm in diameter over the full range of reflection layer locations (rc≈5−15cm), which were used in these experiments, and it is significanly smaller than transverse perturbation wave-lengths for modesM =±1,N=±1,±2.
Figure 3. Schematic representation of the reflectometer diagnostic scheme: 1- microwave klystron oscillator,f = 32.3GHz, 2 - at-tenuator; 3 - directional coupler; 4 - diode detector; 5 - resonance amplifier; 6 - phase shifter; 7 - analog multiplier; 8 - horn antenna; 9 -RF Alfv´en antennae, 10 - plasma column.
The output signal is amplified by the selective amplifier (5) with passband frequencyf = (4.0±0.1)MHz. Then the signal is multiplied in the analog multiplier (7) by the reference signal, which is proportional to RF antenna (9) current, and is filtered by the low-pass filter with pass band
f ≤100kHz. The analog multiplier operates in a regime, for which the output signal does not depend on the ampli-tude of the reference signal, but only on the ampliampli-tude of the reflectometer signal and on the phase shift between them. In this way onlyRF modulated microwave signals, which are caused by theRF driven density oscillations, are regis-tered by the data acquisition system of TCABR. The advan-tage of this technique is the elimination of the influence of the reflections from the tokamak vacuum chamber elements, because onlyRF modulated reflections from plasma cutoff layer contribute to output reflectometer signal.
The data analysis includes the determination of the am-plitude and spectral characteristics of these signals and their dependence on the variation of line averaged plasma density
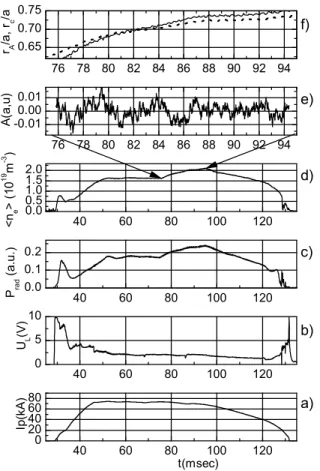
Figure 4. Shot #10677: a) - the plasma currentIP; b) - loop
vol-tageUL; c) - radiated powerPrad; d) - line averaged plasma
den-sity < ne >; e) - the time trace of the expanded reflectometer
output signalAeduringRFpulse; f) - the radial resonance position
rA/a(solid line) for mode numbersM =±1,N =±2, and the
reflectometer cutoff positionrc/a(dotted line).
4
Results
The registration of Alfv´en wave resonances by microwave reflectometry was studied in the typical experimental condi-tions of the tokamak TCABR. The initial rather low value of the line averaged plasma density,hni ≈(1.0−1.6)×1019 m−3
, was chosen in order to ensure that the positioning of the microwave cutoff layer nc ≈ 1.3×10¹⁹ m−3 was in the inner plasma region. In the course of the experiments, both the initial plasma density, before application of theRF
pulse, and the rate of plasma density increase, by fast gas puffing during Alfv´en wave pulse, were varied and the cor-responding variations in the reflectometer signal were deter-mined. At the timet= 75msec, when the plasma currentIp reached its maximum value and the plasma parameters were in the quasistationary phase, theRF generator was trigge-red on with a pulse durationτA≈20msec. Simultaneously the controlled pulsed gas puffing was initiated. The tempo-ral variation of the fast gas puffing was adjusted such that plasma density increased during theRF pulse and therefore
the zones of both Alfv´en resonance and microwave cutoff were swept. The time traces of some basic discharge para-meters are shown in Fig. 4 and Fig. 5 for two consecutive TCABR plasma discharges with different base plasma den-sity.
Figure 5. Shot #10678: a) - the plasma currentIP; b) - loop
vol-tageUL; c) - radiated powerPrad; d) - line averaged plasma
den-sity< ne >; e) - the time trace of the expanded reflectometer
output signalAeduringRFpulse; f) - the radial resonance position
rA/a(solid line) for mode numbersM =±1,N =±2, and the
reflectometer cutoff positionrc/a(dotted line).
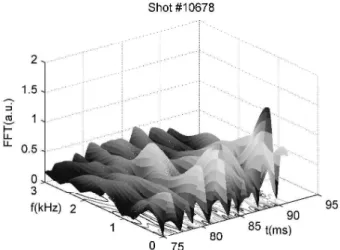
It can be seen that the characteristics the reflectometer output signal are quite different for these two shots with si-milar parameters. There are strong low frequency oscillati-ons at the initial phase of theRF pulse in the shot #10677 (Fig.4(f)), which decrease to the end of theRF pules. On the contrary, in the shot #10678 low frequency oscillations of the the reflectometer output signal have begun to grow in the final stage of theRF pulse.
In order to identify the origin of these spectrum changes, an analysis of theRF driven Alfv´en modes, whose localiza-tion can coincide with the microwave cutoff zone, has been carried out. Because the Alfv´en wave resonance condition depends both on the safety factorq(r)and plasma density
n(r) profiles (Eqs.1, 2), the analysis was carried out for different values of the profile indexesαj andαn, keeping constraints imposed by the measured values of the plasma current Ip(t)and line averaged density hnei. The results of calculations are shown in Fig.4(f) and Fig.5(f). Here the calculated value of the radial resonance position rA/a for mode numbersM =±1,N =±2where Alfv´en wave dri-ven density oscillations are localized, is plotted by solid line. The position of reflectometer cutoff zonerc/ais plotted by dotted line.
It is seen that due to the higher base plasma density in the shot #10677 the zone of Alfv´en wave driven density os-cillations has begun to overlap the reflectometer cutoff zone at the initial phase of theRF pulse, and it manifested itself by strong low frequency oscillations of reflectometer output signal. In the shot #10678 the base plasme density was lower and this effect occured at the final stage of theRFpulse.
These experimental data confirm the theoretical predicti-ons and dempredicti-onstrate that the temporal behaviour of the out-put signal of the reflectometer, correlated with the RF mo-dulation of plasma density oscillations, depends strongly on the evolution of the plasma density. The amplitude of low frequency part of the registered signal increased substanti-ally when the position of the Alfv´en resonance crossed the microwave cut-off zone.
Figure 6. Shot #10677: The time variation of the spectrum of the reflectometer output signal.
Figure 7. Shot #10678: The time variation of the spectrum of the reflectometer output signal.
The analysis of the experimental data can also provide very important information about the effective mass of the plasma ions. In fact, the Alfv´en velocity depends on the ion effective mass, CA(r) = B/
q
µ0mef fi ni(r), and results of calculations demonstrate thatrA×rc crossing depends rather sensitively onmef fi .
5
Conclusions
A microwave reflectometry scheme to detect density fluc-tuations correlated with the excitation of externally dri-ven Alfv´en waves has been described and the experimen-tal results presented. In conjuction with other diagnostic methods, this method can give information about the loca-lization of theRF power deposition zone in Alfv´en wave plasma heating and current drive experiments. It also allows finding the plasma current profile in the region of the RF power deposition and the effective mass of the plasma ions. The advantage of this technique is the elimination of the in-fluence of the reflections from the tokamak vacuum chamber elements, because only reflections from plasma cutoff layer contribute to output reflectometer signal.
The experiments, which were carried out in the TCABR, are not yet complete and have to be considered as a prelimi-nary proof of principle. The reflectometer technique and the system for Alfv´en mode identification are currently being improved to provide more clear results.
Acknowledgments
This work has been supported by The National Council for Scientific and Technological Development, The State of S˜ao Paulo Research Foundation, and The International Col-laboration Council of University of S˜ao Paulo.
References
[2] L. F. Ruchko, E. Lerche, R. M. O. Galv˜ao, A. G. Elfimov, I. C. Nascimento, W. P. de S´a, E. Sanada, J. I. Elizondo, A. A. Ferreira, S. Saettone, J. H. F. Severo, V. Bellintani, O. C. Usuriaga, Braz. J. Phys. 32, 57 (2002).
[3] L. F. Ruchko, R. Valencia, R. M. O. Galv˜ao, E. A. Lerche, A. G. Elfimov, V. Bellintani Jr, J. I. Elizondo, A. N. Fagundes, A. M. M. Fonseca, Yu.K. Kuznetsov, I. C. Nascimento, W. P. de S´a, E. Sanada, and R. P.da Silva, Rev. Sci. Instrum. 75, 655 (2004).
[4] A. Hasegava and L. Chen, Phys. Fluids 19, 1924 (1976). [5] D. W. Ross, G. L. Chen, and S. M. Mahajan, Phys. Fluids 25,
652 (1982).
[6] T. E. Evans, P. M. Valanju, J. F. Benesch, Roger D. Bengtson, Y. -M. Li, S. M. Mahajan, M. E. Oakes, D. W. Ross, X.-Z. Wang, and J. G. Watkins, Phys. Rev. Lett. 53, 1743 (1984). [7] H. Weisen, K. Appert, G. G. Borg, B. Joye, A. J. Knight, J.
B. Lister, and J. Vaclavik, Phys. Rev. Lett. 63, 2476 (1989). [8] H. Weisen, Rev. Sci. Instrum. 59, 1544 (1988).
[9] C. Laviron, A. J. H. Donn´e, M. E. Manso, and J. Sanchez, Plasma Phys. Control. Fusion 38, 905 (1996).
[10] R. Nazikian, G. J. Kramer, and E. Valeo, Phys. Plasmas 5, 1840 (2001).
[11] E. Mazzucato, Rev. Sci. Instrum. 69, 2201 (1998).
[12] I. H. Hutchinson, Plasma Phys. Controllcd Fusion 34, 1225 (1992).
[13] R. Nazikian, R. Majeski, E. Mazzucato, M. McCarthy, H. K. Park, C. K. Phillips,J. H. Rogers, G. Schilling, and G. Taylor, Rev. Sci. Instrum. 68, 450 (1997).
[14] L. G. Bruskin, N. Oyama, K. Shinohara, Y. Miura, Y. Kogi, A. Mase, M. Hasegawa, and K. Hanada, Rev. Sci. Instrum.
74, 1473 (2203).
[15] S. Heuraux, S. Hacquin, F. da Silva, F. Clairet, R. Sabot, and G. Leclert, Rev. Sci. Instrum. 74, 1501 (2003).
[16] G. J. Kramer, R. Nazikian, and E. Valeo, Rev. Sci. Instrum.
74, 1421 (2003).