A Novel Approach for Inflation Analysis Using Hidden Markov
Model
Bushra Hossain1, Mohiuddin Ahmed2 and MD. Fazle Rabbi3
1,2
Computer Science & Engineering Department, Green University of Bangladesh Dhaka-1207, Bangladesh
3
Computer Science & Engineering Department, Military Institute of Science and Technology Dhaka-1207, Bangladesh
Abstract
Inflation is a major issue to be considered for the development of any nation as well as having great influence on worldwide economy. In this paper, we present a novel approach to analyze inflation data of a given time using HMM. HMM is being used for several computational problems in real life applications. Although, HMM is not a perfect way to predict future events. Here we use HMM, that is trained on the past dataset. The trained HMM is used to search for behavioral data pattern from a given dataset. Output obtained using HMM are really inspiring and HMM offers a new paradigm for inflation analysis.
Keywords: HMM, Feature Selection, Financial Time series, Inflation.
1. Introduction
In economics, inflation is a rise in the general level of prices of goods and services in an economy over a period of time. When the general price level rises, each unit of currency buys fewer goods and services. Consequently, inflation also reflects an erosion in the purchasing power of money – a loss of real value in the internal medium of exchange and unit of account in the economy. A chief measure of price inflation is the inflation rate, the annualized percentage change in a general price index (normally the Consumer Price Index) over time.
Inflation's effects on an economy are various and can be simultaneously positive and negative. Negative effects of inflation include a decrease in the real value of money and other monetary items over time, uncertainty over future inflation may discourage investment and savings, and high inflation may lead to shortages of goods if consumers begin hoarding out of concern that prices will
increase in the future. Positive effects include ensuring central banks can adjust nominal interest rates (intended to mitigate recessions),and encouraging investment in non-monetary capital projects. Economists generally agree that high rates of inflation and hyperinflation are caused by an excessive growth of the money supply. Views on which factors determine low to moderate rates of inflation are more varied. Low or moderate inflation may be attributed to fluctuations in real demand for goods and services, or changes in available supplies such as during scarcities, as well as to growth in the money supply. However, the consensus view is that a long sustained period of inflation is caused by money supply growing faster than the rate of economic growth.
mentioning our future work in Section 5 followed by References
2. Hidden Markov Model
A Hidden Markov Model (HMM) [12] is a finite state machine which has some fixed number of states. It provides a probabilistic framework for modeling a time series of multivariate observations. Hidden Markov models were introduced in the beginning of the 1970’s as a tool in speech recognition. This model based on
statistical methods has become increasingly popular in the last several years due to its strong mathematical structure and theoretical basis for use in a wide range of applications. In recent years researchers proposed HMM as a classifier or predictor for speech signal recognition [5, 6, 7], DNA sequence analysis [8], handwritten characters recognition [9], natural language domains etc. It is clear that HMM is a very powerful tool for various applications. The advantage of HMM can be summarized as:
- HMM has strong statistical foundation - It is able to handle new data robustly
- Computationally efficient to develop and evaluate
- (due to the existence of established training - algorithms).
- It is able to predict similar patterns efficiently [10]
Rabiner [11] tutorial explains the basics of HMM and how it can be used for signal prediction. Hidden Markov Model is characterized by the following :
1) number of states in the model 2) number of observation symbols 3) state transition probabilities
4) observation emission probability distribution that characterizes each state
5) initial state distribution
For the rest of this paper the following notations will be used regarding HMM
N = number of states in the model
M = number of distinct observation symbols per state (observation symbols correspond to the physical output of the system being modeled)
T = length of observation sequence
O = observation sequence, i.e., O1, O2, O3 ,………OT
Q = state sequence q1, q2, ……., qTin the Markov
model
A = {aij} transition matrix, where aij represents the
transition probability from state i to state j
B = {bj(Ot)} observation emission matrix, where bj(Ot)
represent the probability of observing Ot at state j
π = {π} the prior probability, where π
probability of being in state i at the beginning of the experiment, i.e., at time t = 1
λ = (A, B, π) the overall HMM model.
To work with HMM, the following three fundamental questions should be resolved
1. Given the model λ= (A, B, π) how do we compute P(O| λ), the probability of occurrence of the
observation sequence O = O1,O2, ….. , OT.
2. Given the observation sequence O and a model λ, how do we choose a state sequence q1 , q2 , ….. , qT
that best explains the observations.
3. Given the observation sequence O and a space of models found by varying the model parameters A, B and π, how do we find the model that best explains the observed data.
There are established algorithms to solve the above questions. In our task we have used the forward-backward algorithm to compute the P(O| λ), Viterbi algorithm to resolve problem 2, and Baum-Welch algorithm to train the HMM. The details of these algorithms are given in the tutorial by Rabiner [11].
3. Proposed Method
In this section, we discuss the novel method for Inflation analysis using HMM as mathematical tool. While Implementing HMM, choice of hidden states and observation data is a difficult decision. For simplicity, we choose inflation rate as observation and change of inflation rate as hidden states.
As our dataset is continuous in nature, we have classified inflation rate into 12 ranges for simplicity which is clearly shown Table 1.
Table 1 : Definition of Observation type
Our goal is to analyze the behavior of change of inflation rate, for this, we have considered three states model i.e. Increase, Decrease and No change in inflation rate. For convenience of graph plotting Increase, Decrease and No change state status have been indexed as 0, 1 and 2 respectively, shown in Table 2.
Table 2 : Hidden State Definition
State number Change of Inflation Rate
0 Increase 1 Decrease
2 No change
So, S = { Increase , Decrease , No change}
Behavior of inflation rate makes transitions among these three states. At the start of each month hidden state status is updated.
Fig 1 : Transition between three states
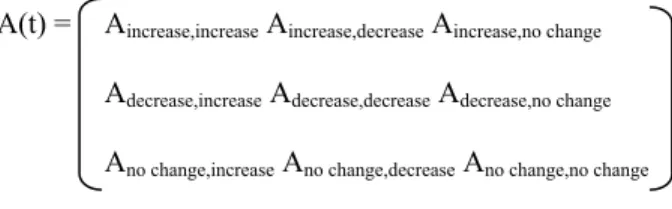
For our three-state-model we get nine transition probabilities, we define the nine transition probabilities as transition matrix representation shown below:
A(t) = Aincrease,increase Aincrease,decrease Aincrease,no change
Adecrease,increase Adecrease,decrease Adecrease,no change
Ano change,increase Ano change,decrease Ano change,no change
Fig 2 : Algorithm To Convert Dataset Values Into HMM Parameter
Now data values are converted into HMM parameter and it is ready for implementation and result.
4. Implementation & Simulation Results
To implement HMM, we divide the dataset into two sets, Training and Testing. We have focused on the inflation behavior of year 2010 and 2011. For this, we fixed our testing set size for this two year and calculated different hidden state sequences by varying the training set size. Result is given in Table 3.
To identify the inflation behavior of the time period Jan 2010 to Dec 2011 we always used the same testing data. The training data is taken from previous years to detect the similarities of inflation behavior among previous years. In Table 3, training set is increased from 10 to 60 year (In No 1 to 6 Row) and we can extract that the accuracy degrades as time period increases in the backward. We get the lowest accuracy when we use data of more previous time period ( In No 7 to 8 Row). Further, we experiment with the testing data set using training data of previous historical decades, i.e. 50’s, 70’s and 90’s decade (In No 9 to 11 Row) where the result shows 90’s decade inflation behavior is more similar than the two.
Decrease Increase
No change
# Create Observation Type according to Table 1 # Create Hidden state definition according to Table 2 For each row of the data from [13]
- Find exact range of Observation type of inflation rate for each time slot following rules given in Table 1.
- Find status of change of inflation rate for consecutive time slots and assign a state status for each time slot following state definition given in Table 2.
Table 3 : Accuracy of HMM for different training data set
# no
Training Set Testing Set Matched Accuracy
(%)
1 Jan 2000 to Dec 2009 Jan 2010 to Dec 2011 87.5
2 Jan 1990 to Dec 2009 Jan 2010 to Dec 2011 83
3 Jan 1980 to Dec 2009 Jan 2010 to Dec 2011 82
4 Jan 1970 to Dec 2009 Jan 2010 to Dec 2011 66.67
5 Jan 1960 to Dec 2009 Jan 2010 to Dec 2011 79.16
6 Jan 1950 to Dec 2009 Jan 2010 to Dec 2011 75
7 Jan 1950 to Dec 1969 Jan 2010 to Dec 2011 62.5
8 Jan 1934 to Dec 1963 Jan 2010 to Dec 2011 61.5
9 Jan 1950 to Dec 1959 Jan 2010 to Dec 2011 62
10 Jan 1970 to Dec 1979 Jan 2010 to Dec 2011 79.22
11 Jan 1990 to Dec 1999 Jan 2010 to Dec 2011 80
Following figure depicts the inflation analysis for the time period of Jan 2010 to Dec 2011.
Fig.3 : Original and Predicted behavior of Inflation change from Jan 2010 to Dec 2011
5. Conclusions
In this paper we used HMM to find out the similarity among previous years with the current inflation rates. It is a novel approach to easily extract economical information for any given time period for any purpose. Here the monthly inflation change is analyzed accurately which is beneficiary for several aspect of financial analysis. Our future work will include the inflation prediction using
HMM and we believe it will be one of the most efficient process to have a control over the economy.
References
[1] Kuo R J, Lee L C and Lee C F (1996), Integration of Artificial NN and Fuzzy Delphi for Stock market forecasting, IEEE International Conference on Systems, Man, and Cybernetics, Vol. 2, pp. 1073-1078.
[2] Kimoto T, Asakawa K, Yoda M and Takeoka M (1990), Stock market prediction system with modular neural networks, Proc. International Joint Conference on Neural Networks, San Diego, Vol. 1, pp. 1-6.
[3] Li Z, Wu Z, He Y and Fulei C (2005), Hidden Markov model-based fault diagnostics method in speed-up and speed-down process for rotating machinery. Mechanical Systems and Signal Processing, Vol. 19(2), pp. 329-339.
[4] Raposo R De C T and Cruz A J De O (2004), Stock Market prediction based on fundamentalist analysis with Fuzzy-Neural Networks.
http://www.labic.nce.ufrj.br/downloads/3wses_fsfs_2002 .pdf
[5] Huang X, Ariki Y, Jack M (1990), Hidden Markov Models for speech recognition. Edinburgh University Press.
[6] Jelinek F, Kaufmann M, Mateo C S (1990), Selforganized language modelling for speech recognition, in
Readings in Speech Recognition (Eds. Alex Waibel and Kai-Fu Lee), Morgan Kaufmann, San Mateo, California, pp. 450-506
[7] Xie H, Anreae P, Zhang M, Warren P (2004), Learning Models for English Speech Recognition, Proceedings of the 27th Conference on Australasian Computer Science,
pp. 323-329.
[8] Liebert M A (2004), Use of runs statistics for pattern recognition in genomic DNA sequences. Journal of Computational Biology, Vol. 11, pp. 107-124.
[9] Vinciarelli A and Luettin J (2000), Off-line cursive script recognition based on continuous density HMM,
Proceedings of the 7th International Workshop on
Frontiers in Handwriting Recognition, Amsterdam, pp. 493-498.
[10] Li Z, Wu Z, He Y and Fulei C (2005), Hidden Markov model-based fault diagnostics method in speed-up and speed-down process for rotating machinery. Mechanical Systems and Signal Processing, Vol. 19(2), pp. 329-339.
[11] Rabiner R L (1989), A Tutorial on Hidden Markov Models and Selected Applications in Speech
Proceedings of the 2005 5th International Conference on Intelligent Systems Design and Applications (ISDA’05)
[13]http://inflationdata.com/inflation/inflation_rate/historicalinfla tion.aspx
Bushra Hossain has achieved Bachelor of Computer Science and Engineering from Military Institute of Science and Technology, Dhaka, Bangladesh, in 2010.Now working as a lecturer at Green University of Bangladesh in Computer Science & Engineering Department. Her research interests include Wireless Communication, Artificial Intelligence and Computational Mathematics.
Mohiuddin Ahmed has achieved Bachelor of Computer Science & Information Technology from Islamic University of Technology, OIC. Now working as a lecturer at Green University of Bangladesh in Computer Science & Engineering Department. Research Interest includes Human-Computer Interaction, Cloud Computing, Artificial Intelligence, Wireless Network, Computational Mathematics.