F. V. Antunes et alii,Frattura ed Integrità Strutturale, 25 (2013) 54-60; DOI: 10.3221/IGF-ESIS.25.09
54
Special Issue: Characterization of Crack Tip Stress Field
Effect of crack propagation on crack tip fields
F.V. Antunes, A.G. Chegini
CEMUC, Department of Mech Eng, University of Coimbra, Rua Luís Reis Santos, Pinhal de Marrocos, 3030-788 Coimbra, Portugal
L.M. Correia, A.L. Ramalho
CEMUC, Escola Superior de Tecnologia do Instituto Politécnico de Castelo Branco, Av. do Empresário, 6000 - 767 Castelo Branco, Portugal
ABSTRACT. Crack closure influences fatigue crack growth rate and must be included in the design of
components. Plasticity induced crack closure is intimately linked with the crack tip plastic deformation, which becomes residual as the crack propagates. The objective here is to study numerically the effect of crack propagation on crack tip fields. The transient effect observed at the beginning of crack propagation is linked to the hardening behavior of material. The effect of mesh refinement is studied, and a singular behavior is evident, which is explained by the sharp crack associated with mesh topology, composed of a regular pattern of square elements. The plastic zone size measured perpendicularly to crack flank in the residual plastic wake is quantified and compared with literature models. Finally, the removal of material at the first node behind crack tip with load cycling was observed for plane strain state and some hardening models in plane stress state.
KEYWORDS. Plasticity induced crack closure; Crack tip; Plastic deformation.
INTRODUCTION
rack closure is a phenomenon which consists of the contact of the fracture surfaces during a portion of the load cycle. This contact affects the local stress and plastic deformation fields near the crack tip, and therefore, the intrinsic micromechanisms responsible for fatigue propagation (cyclic plastic deformation, oxidation, creep, etc.). According to Elber’s understanding of crack closure [1], as the crack propagates due to cyclic loading, a residual plastic wake is formed. The deformed material acts as a wedge behind the crack tip and the contact of fracture surfaces is forced by the elastically deformed material. Plasticity induced crack closure (PICC) is intimately related with the monotonic and reversed plastic deformation occurring at the crack tip. The forward or monotonic plastic zone is constituted by the material near the crack tip undergoing plastic deformation during loading. Major parameters are the maximum load, the stress state and the isotropic component of hardening. On the other hand, the reversed plastic zone is formed by the material near the crack tip undergoing compressive yielding during unloading. The amplitude of stress intensity factor, K, the stress state and the kinematic hardening are expected to have a major influence on reversed plastic deformation. However, the plastic deformation at a Gauss point is a complex phenomenon, occurring progressively as the crack tip approaches it, depending on the hardening model, loading parameters and finite element mesh, among other parameters. The main objective here is to study numerically the effect of crack propagation on crack tip fields. The effect of mesh refinement, stress state and hardening model are considered. The numerical simulations were performed with a three-dimensional elasto-plastic finite element program (DD3IMP) that follows a fully implicit time integration scheme.
F. V. Antunes et alii,Frattura ed Integrità Strutturale, 25 (2013) 54-60; DOI: 10.3221/IGF-ESIS.25.09
55
NUMERICAL MODEL
Middle-Tension (M(T)) specimen, in agreement with ASTM E647 standard, is studied here. An initial crack length of a0=5 mm was assumed. Due to symmetry conditions, only 1/8 of the MT specimen was simulated,
considering adequate symmetry conditions. The material used for this research was the 6016-T4 aluminium alloy (HV0.5=92). In order to model the hardening behaviour of this aluminium alloy, three types of mechanical tests were performed: uniaxial tensile tests and monotonic and Bauschinger shear tests. From the experimental data and curve fitting results, for different constitutive models, it was determined that the mechanical behaviour of this alloy is better represented using an isotropic hardening model described by a Voce type equation:
0 (1 )
p v
n sat
Y Y R e (1)
combined with a non-linear kinematic hardening model described by a saturation law:
px sat
X
X C X X
(2)
In previous equations Y is the equivalent flow stress, p is the equivalent plastic strain, Y0 is the initial yield stress, Rsat is
the saturation stress, n, Cx and Xsat are material constants, σ is the deviatoric stress tensor, X is the back stress tensor, p
the equivalent plastic strain rate and p the equivalent stress. The materials constants determined for the batch of
material in study, that were used in the numerical simulations, are: Y0=124 MPa, Rsat=291 MPa, n= 9.5, Cx= 146.5 and
Xsat= 34.90 MPa [2].
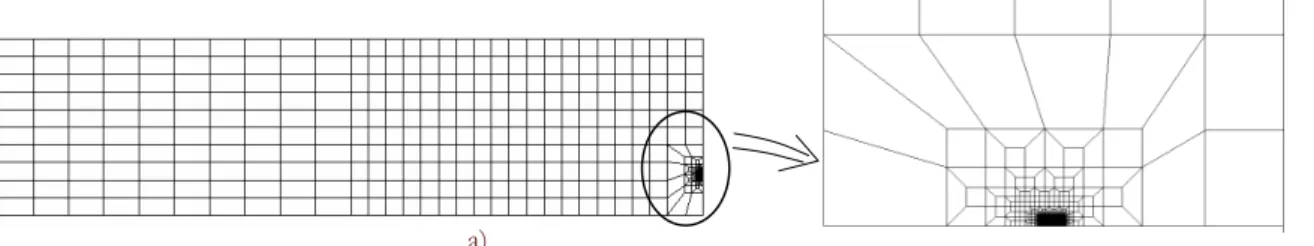
Fig. 1 presents the finite element mesh, which was refined at the crack front to model the severe plastic deformation gradients and enlarged at remote positions to reduce the numerical effort. The size considered for the linear isoparametric square elements around the crack front was L1=8 m, 16 m or 16 m. To overcome convergence difficulties, crack
propagation was simulated by successive debonding of nodes at minimum load. Each crack increment (ai) corresponded
to one finite element and two load cycles were applied between increments. In each cycle, the crack propagates uniformly over the thickness by releasing both current crack front nodes.
Figure 1: Finite element mesh. a) Frontal view. b) Detail of frontal view.
The numerical simulations were performed with the Three-Dimensional Elasto-Plastic Finite Element program (DD3IMP) that follows a fully implicit time integration scheme [3, 4]. The mechanical model and the numerical methods used in the finite element code DD3IMP, specially developed for the numerical simulation of metal forming processes, takes into account the large elastic-plastic strains and rotations that are associated with large deformation processes. To avoid the locking effect a selective reduced integration method is used in DD3IMP18. The optimum values of the numerical parameters of the DD3IMP implicit algorithm have been already established in previous works, concerning the numerical simulation of sheet metal forming processes [5] and plasticity induced crack closure [6].
NUMERICAL RESULTS
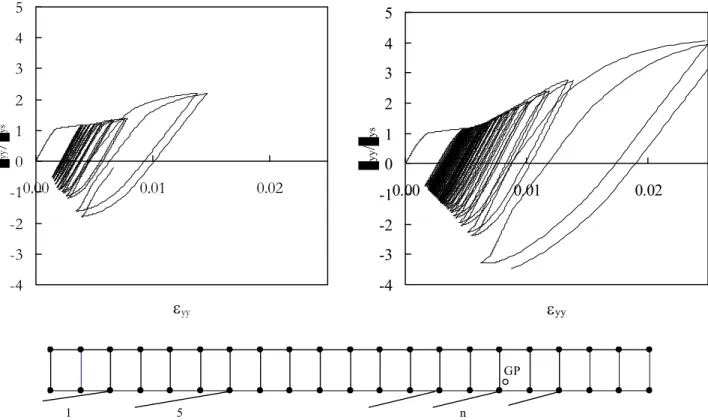
ig. 2a and 2b show stress-strain curves registered for a Gauss point when the crack propagates approaching it, as illustrated in Fig. 2c. The Gauss point suffers plastic deformation at the first load cycle, which indicates that it is within the first forward plastic zone, but it doesn’t experience reversed plasticity. As the crack tip approaches the
A
F
a)
F. V. Antunes et alii,Frattura ed Integrità Strutturale, 25 (2013) 54-60; DOI: 10.3221/IGF-ESIS.25.09
56
Gauss point, the monotonic plastic deformation increases and reversed plastic deformation starts. The plastic deformation has he highest magnitude when the Gauss point is immediately ahead of crack tip (position n in Fig. 2c). The comparison of Fig. 2a and 2b indicates that plastic deformation level is significantly higher for a mesh with 8 m elements (M8) compared with a mesh with 32 m elements (M32). In fact, the reduction of mesh size approaches the Gauss tip to crack flank, which increases the stress concentration factor. Additionally, more load cycles are applied when the crack approaches the Gauss point. Other Gauss points have similar behavior; however the levels of monotonic and reversed plastic deformation, and therefore the residual plastic deformation, vary.
-4 -3 -2 -1 0 1 2 3 4 5
0.00 0.01 0.02
yy
yy
/
ys
-4 -3 -2 -1 0 1 2 3 4 5
0.00 0.01 0.02
yy
yy
/ys
GP
1 5 n
Figure 2: Influence of finite element mesh on stress-strain curves. a) Mesh M32. b) Mesh M8. c) Position of the Gauss point.
(a=10mm; W=30 mm; max=47.5 MPa; min=0.8 MPa).
The location of the Gauss point relatively to the initial crack tip position has a major influence on residual plastic deformation. Fig. 3 presents the equivalent plastic strain along crack flank, which remains after crack propagation. A peak is evident at the beginning of crack propagation (a0=5 mm), which is followed by a progressive decrease until a
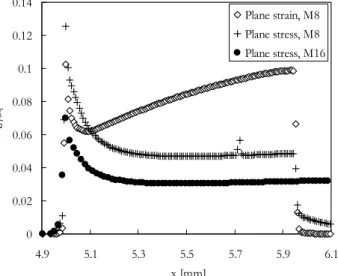
stabilization is reached. The material hardening model influences the plastic deformation level, but not the global trend. The kinematic hardening model gives higher plastic deformation levels, which is linked to the occurrence of reversed plastic deformation during unloading. Fig. 4 shows the effect of stress state and mesh refinement. A peak still is observed at the beginning of crack propagation, but the deformation increases with crack propagation for the plane strain state which wasn’t expected. The use of finite elements with 8 m at the crack tip (mesh M8) instead of 16 m elements (mesh M16) increases the plastic deformation level. This could be expected since the decrease of element size approaches the Gauss points to the crack tip and additionally more load cycles are applied because the crack increments are smaller. Therefore the monotonic and reversed plastic deformation levels, and consequently the maximum stress and plastic deformation, are higher for mesh M8 compared to the mesh M16.
Fig. 5b presents normalized stress-strain curves (yy-yy), registered as the crack propagates under plane stress conditions,
for Gauss points (GP) in different elements ahead of the initial crack tip (E1, E2, E8 in Fig. 5a). The crack is initially at position C0 indicated, and propagates ahead of element 8 (E8). The non-linear behaviour of the yy-yy curves at the first
F. V. Antunes et alii,Frattura ed Integrità Strutturale, 25 (2013) 54-60; DOI: 10.3221/IGF-ESIS.25.09
57 This phenomenon explains the peak values observed in Fig. 3 and 4 at the beginning of crack propagation. The difference between elements E2 and E8 is relatively small, which explains the stabilization observed in Fig. 3 and 4.
0 0.02 0.04 0.06 0.08 0.1 0.12 0.14
4.9 5.1 5.3 5.5 5.7 5.9 6.1
x [mm]
p,
eq
Kinematic Mixed Isotropic
0 0.02 0.04 0.06 0.08 0.1 0.12 0.14
4.9 5.1 5.3 5.5 5.7 5.9 6.1
x [mm]
p,
eq
Plane strain, M8 Plane stress, M8 Plane stress, M16
Figure 3: Equivalent plastic strain along crack flank (max=47.5
MPa; min=0.8 MPa, Mesh M16).
Figure 4: Equivalent plastic strain along crack flank (Mixed
hardening, max=47.5 MPa; min=0.8 MPa).
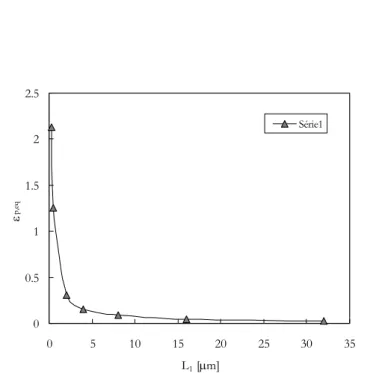
As already observed in Fig. 2a and 2b, the size of finite elements at the crack tip has a major influence on plastic deformation level. Fig. 6 shows the effect of element reduction down to nanometer sizes on maximum plastic deformation. There is a progressive increase of plastic deformation with mesh refinement without convergence, typical of a singular behavior. The finite element mesh used to model crack propagation, composed of a regular pattern of square elements ahead of initial crack tip, as can be seen in Fig. 1 and 5a, assumes a sharp crack, which has a singular behavior. Assuming a finite value for the crack tip radius, convergence is obtained with mesh refinement. However, depending on radius, the mesh required may be quite refined and the modeling of crack propagation to form the residual plastic wake is not easy with a finite crack tip radius.
-5 -4 -3 -2 -1 0 1 2 3 4 5
0.00 0.02 0.04 0.06 0.08 0.10
yy
yy
/
ys
E1 E2
E8
Figure 5: a) Near crack tip elements. b) Stress- strain curves (Mixed hardening, max=47.5 MPa; min=0.8 MPa).
E1 E2 E8
F. V. Antunes et alii,Frattura ed Integrità Strutturale, 25 (2013) 54-60; DOI: 10.3221/IGF-ESIS.25.09
58
Another relevant aspect is the size of crack tip plastic zone. Fig. 7 shows the effect of load level and stress state on plastic zone size measured in the residual plastic wake perpendicularly to crack flank. The boundary was defined for a plastic deformation of 0.2%, which is usually considered to be the onset of plastic deformation in tension tests. The monotonic plastic zone increases with load level and, for the maximum load studied (Kmax=11.9 MPa.m1/2; max/ys=70%), a size of
1.27 mm was observed. Lower values were obtained for plane strain state, but the effect of load is clearly dominant in Fig. 7. The size of crack tip plastic deformation zone has been widely studied for static loads, being usually represented in the form:
2
( )
p
ys
K
r
(3)
where K is the stress intensity factor and ys is material’s yield stress. Considering only the singularity stress field, =1/6 for
plane strain state and three times larger for plane stress state (=1/2) [7]. However, Clavel et al. [8] proposed a factor of two. Considering the stress redistribution produced by plastic deformation, Rice [9] proposed =1/3 and =1/ for plane strain and plane stress states, respectively, assuming small scale yielding and a perfectly plastic behaviour. Dugdale [10] proposed =/8 for plane strain state. For steels and aluminium alloys and plane strain state, Dias et al. [11] proposed:
2
0.196
129 0.928 ced
ced
(4)
Fig. 7 shows the results obtained with the models of Dugdale and Dias, which are significantly different from the numerical predictions. However, notice that the literature models were obtained for =0º, i.e., ahead of crack tip, and for static loads. In PICC studies the size perpendicularly to crack flank, i.e., for =90º, is more relevant. The sizes proposed here for plane stress and plane strain states are, respectively:
2
0.11 ys
K
(5)
3.1
1.64 ys
K
(6)
0 0.5 1 1.5 2 2.5
0 5 10 15 20 25 30 35
L1 [m]
p,eq
Série1
Figure 6: Effect of mesh refinement on maximum equivalent plastic strain.
F. V. Antunes et alii,Frattura ed Integrità Strutturale, 25 (2013) 54-60; DOI: 10.3221/IGF-ESIS.25.09
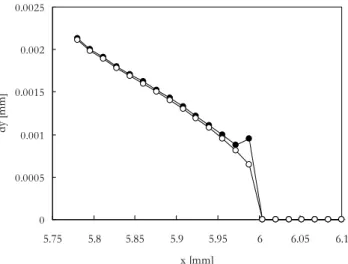
59 and consequently, crack closure. Subsequent unloading and loading cycles takes material from behind the crack tip reducing closure. A similar phenomenon was observed for elastic-perfectly plastic behaviour. For plane strain state was observed independently of material model, however this affects the extent of the phenomenon. The same phenomenon has been reported also by Antunes et al. [12] and Jiang et al. [13] for pure kinematic hardening models in 2D plane stress analysis. Toribio et al. [14] developed a high-resolution finite-element simulation of a plane-strain tensile crack with finite radius. Elastic-perfectly plastic behaviour was assumed and deformed shapes revealed the mechanism of material transfer from the crack front onto lateral faces of the crack.
0 0.2 0.4 0.6 0.8 1 1.2 1.4 1.6
0.01 0.03 0.05 0.07 0.09
Kmax/ys [m0.5]
p,
eq
Plane stress Plane strain
[11] [10]
0 0.0005 0.001 0.0015 0.002 0.0025
5.75 5.8 5.85 5.9 5.95 6 6.05 6.1
x [mm]
dy
[
m
m]
Figure 7: Size of plastic zone perpendicularly to crack flank. Figure 8: Effect of load cycles without propagation on crack
profile (pure kinematic hardening, plane stress, L1=16 m).
CONCLUSIONS
lasticity induced crack closure is intimately linked to crack tip plastic deformation. Along crack flank, the plastic deformation presents an initial peak of plastic deformation. This peak was explained by the initial plastic deformation occurring at the first loading. The elements suffering progressive increase of load level showed lower plastic deformation levels as a consequence of hardening. The crack propagation stabilizes the plastic deformation and the plasticity induced crack closure (PICC). The decrease of mesh size was found to increase progressively the maximum plastic deformation without convergence, which is typical of a singular behavior. Convergence is achieved considering a finite value for the crack tip radius, but conciliate crack propagation modeling with a finite crack tip radius is not easy. The size perpendicularly to crack flank was measured and compared with literature models. Significant differences were found relatively to literature models. However these models were defined for =0º, i.e., ahead of crack tip, and for static loads, while the present results were obtained for a residual plastic wake formed by crack propagation.
AKNOWLDGMENTS
he authors are indebted to the Portuguese Foundation for the Science and Technology (FCT) and to FEDER (European Regional Development Fund) for the financial support (Project PTDC/EME-PME/114892/2009; COMPETE: FCOMP-01-0124-FEDER-015171)
REFERENCES
[1] Elber, W., Fatigue crack closure under cyclic tension, Engng Fracture Mechanics, 2 (1970) 37-45.
P
F. V. Antunes et alii,Frattura ed Integrità Strutturale, 25 (2013) 54-60; DOI: 10.3221/IGF-ESIS.25.09
60
[2] Bouvier, S., Haddadi, H., Levée, P., Teodosiu, C., Simple shear tests: Experimental techniques and characterization of the plastic anisotropy of rolled sheets at large strains. Journal of Materials Processing Technology, 172 (2006) 96–103. [3] Menezes, L.F., Teodosiu, C., Three-Dimensional Numerical Simulation of the Deep-Drawing Process using Solid
Finite Elements, Journal of Materials Processing Technology, 97 (2000) 100-106.
[4] Oliveira, M.C., Alves, J.L., Menezes, L.F., Improvement of a frictional contact algorithm for strongly curved contact problems, International Journal for Numerical Methods in Engng, 58 (14) (2003) 2083-2101.
[5] Oliveira M.C., Menezes, L.F., Automatic correction of the time step in implicit simulations of the stamping process, Finite Elements in Analysis and Design, 40 (2004) 1995–2010.
[6] Antunes, F.V., Rodrigues, D.M., Numerical simulation of plasticity induced crack closure: Identification and discussion of parameters, Engineering Fracture Mechanics, 75 (2008) 3101–3120.
[7] McClung R.C., Thacker B.H., Roy, S., Finite element visualization of fatigue crack closure in plane stress and plane strain, International Journal of Fracture, 50 (1991) 27–49.
[8] Clavel M., Pineau A., Fatigue behavior of two nickel-base superalloys I: experimental results on low cycle fatigue fatigue crack propagation and substructures, Materials Science and Engineering, 55(2) (1982) 157-171.
[9] Rice, J.R., Mechanisms of Crack Tip Deformation and Extension by Fatigue, Fatigue Crack Propagation, ASTM STP 415 (1967) 247-309.
[10]Dugdale, D.S., Yielding of Steel Sheets Containing Slits, J. Mech. Phys. Solids, 8 (1960) 100-108.
[11]Dias, A., Lebrun J.L., Bignonnet, A., X-ray Diffraction Studies on Fatigue Crack Plastic Zones Developed Under Plane Strain State Conditions, Fatigue and Fracture of Engng Mat. Structures, 22 (1999) 133-144.
[12]Antunes, F.V., Borrego, L.F.P., Costa, J.D., Ferreira, J.M., A numerical study of fatigue crack closure induced by plasticity. Fatigue and Fracture of Engng Materials and Structures, 27(9) (2004) 825-836.
[13]Jiang, Y., Feng, M., Ding F., A re-examination of plasticity-induced crack closure in fatigue crack propagation. International Journal of Plasticity, 21 (2005) 1720-1740.