1. BACKGROUND
The tactical basic research, “The Success Factors of Infantry Company’s Attack” (SCA research), which was carried out in the Finnish Defence Forces (FDF) during the years 2004-2007 forms the empirical background of this paper. The SCA research focused on analyzing different individual effects of selected explanatory measured variables. The variables were selected from the areas of tactics, situational awareness, battle task load, human factors, background factors and response variables. During this research, 59 attacks by infantry companies were analyzed.
This paper presents a comprehensive evaluation method for tactical analysis. The development of the method started from constructing the data collection matrix. Later on in this paper, the method is called the CMEP method (Command and control, Manoeuvre, Effect, Performance Maintenance) and its data collection matrix is entitled the CMEP matrix. This matrix is presented in Figure 1.
The construction and order of the rows and the columns of the CMEP matrix are based on the observations collected in the SCA research and supported by literature research. For example, Liddell Hart [1] has emphasized such comparable
UTILIZING BÉZIER SURFACE PATTERN
RECOGNITION FOR INTEGRATING QUALITATIVE
AND QUANTITATIVE ANALYSIS
OF MILITARY TACTICS
LTC Jari SORMUNEN*, D. Sc. Harri ESKELINEN**
*National Defence University, Finnish Defence Forces, Finland ** Lappeenranta University of Technology PL 20,
53850 Lappeenranta, Finland
This paper describes how to develop and utilize a method based on Bézier surface pattern recognition, which could be used for the overall military tactical analysis of a company’s attack. This paper also explains how this method could be applied to an integrated analysis of the most important tactical factors affecting the success and task fulfi llment of an attack together with the effects of the leader’s decision-making and his or her tactical solutions.
According to the Field Manual [3], the tactical elements are command and control, manoeuvre, effect and performance maintenance. The tactical principles become apparent in the interaction with the tactical elements of the battle. According to the Field Manual, the purpose of the manoeuvre near the adversary is to move one’s own troops safely to the position from which it is possible to affect the adversary effectively with fi re. Further, command and control can be seen as a factor which aims to integrate the other tactical elements of the battle fi eld. When considering the chronological order of the tactical elements, the sequence is command and control, manoeuvre, effect and performance maintenance. The tactical elements (columns of the CMEP matrix) of the CMEP matrix are the same as the tactical elements in the battlefi eld according to the Field manual. (Infantry Company’s Battle Guideline, 2008) The tactical elements presented in the columns of the CMEP matrix can be evaluated by utilizing the adverbs presented in the rows of the CMEP matrix (consciously, actively, simply, concentratedly and continuously). For example, command and control could simultaneously be conscious, active, simple, concentrated and/or continuous). This viewpoint has lead to the 5*4 - CMEP matrix and enables the qualitative tactical evaluation of an attack.
From the tactical viewpoint, the central aspect which connects the rows and columns of the CMEP matrix is time. As illustrated in Figure 2, the time dependent structure of the CMEP matrix makes it possible contents as “Freedom of action” and
“Clear intention” and Bellamy [2] has emphasized such comparable contents as “Terrain and circumstances”, “Use of performance”, “Battle readiness”, “Concentrating on the essential”, “Execution capability”, “Flexibility”, “Battle pull”, “Battle support” and “Releasing new reserve”.
Figure 1. The CMEP matrix
to study in the desired time window both what actions have been taken and in what way these actions were carried out.
Within the CMEP matrix, a part of a tactical phenomenon could be expressed as “conscious command and control” in the time window “tw1” or it could be entitled “active manoeuvre” in the time window “tw2” if it is relevant to limit the size of the time window to illustrate just a small part of the tactical phenomenon. From the viewpoint of the battle result, the study of tactical phenomena could be extended in the time window “tw3”, which covers several checkers of the CMEP matrix (several tactical actions have taken place and are carried out in different ways).
Because both the tactical elements and tactical principles are time dependent and there is causality which establishes the sequence of them, there is also a time axis passing along the diagonal of the CMEP matrix.
The CMEP matrix construction makes it possible to describe the tactical grounds so that e.g. good command and control could be simultaneously based on situational awareness (consciousness) and activeness, or, on the other hand, effect could be simultaneously concentrated and simple. In addition to the description of these types of separate tactical reason-consequence relations, the CMEP matrix construction makes it possible to study comprehensively different integrated tactical phenomena within the 5*4 fi eld (see Figure 2).
Figure 2. Utilization of the matrix construction for forming the tactical
time windows
In this research the checkers, which are formed at the crossings of the rows and columns of the CMEP matrix, are called CTVs (Central Tactical Variable) and the aspects they can be divided into are called tactical items. The contents of the tactical variables and items are established by the qualitative analysis of the source data collected from the SCA research. The qualitative analysis is carried out by applying the principles presented by Miles & Huberman [4].
The presentation can be developed in a more illustrative manner by constructing a surface model from these numerical values. This is performed by changing the numerical values of the matrix into the height values of the surface model. As an essential part of this quantitative analysis, formulated Bézier surfaces were used as resulting surfaces, which indicate the goodness of the tactical solutions and performance of an attack. In addition to the formulation of the surface, a specialized surface ratio curve is calculated to be able to evaluate the attacks by using quantifi ed grading.
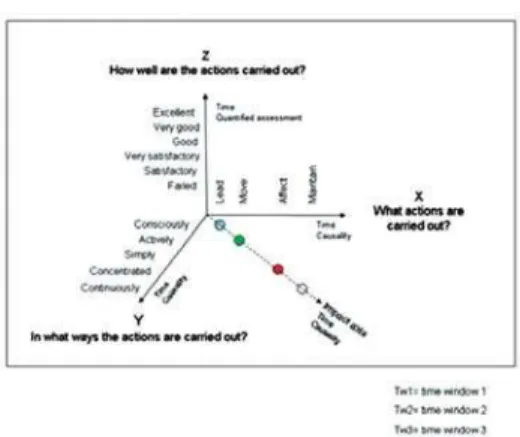
Based on the qualitative viewpoint, we already know how the columns of the CMEP matrix describe “what is done” (lead, move, affect, maintain) and how the rows of the CMEP matrix describe “in what ways these actions are carried out” (consciously, actively, simply, concentratedly, continuously) when a company carries out an attack. When we integrate the third dimension with the matrix (z-axis), it is possible to evaluate from the viewpoint of tactics the success of each action and the success of an attack. This principle is illustrated in Figure 3.
If we regard the numerical value of each central tactical variable as its assessment related to the success of the corresponding action described with this variable, the surface model constructed based on the numerical values of each CTV can be regarded as an overall assessment of the analyzed attack. The height values evaluate “how well” knowledge of the adversary and one’s own force, activity, simplicity, concentration of effect and reserve and exertion of it
have been carried out in relation with command and control, manoeuvre, effect and performance maintenance.
The height values of the surface model change depending on time, which makes it possible to study the tactical phenomena at different moments during the progress of an attack or after the end of an attack.
Figure 3. Integrating the z-axis with the CMEP matrix
The quantitative evaluations of task fulfi llment and casualty data were integrated into the presentation by positioning the surface at the z-axis according to the given numerical values of task fulfi llment and casualty data. In the same way it would be possible e.g. to change the positioning of the surface depending on the diffi culty level of the task. This quantifying process is presented in outline in Figure 4.
As shown in Figure 4, the basic height values of the surface are calculated by summing the scaled numerical values describing the task fulfi lment and casualties. These values can be regarded as basic assessment criteria of success in the battle and therefore their scaled values are added to each central tactical variable to move the surface to the higher or lower level, which indicates how well the task is fulfi lled and what the casualty ratio was after the battle. The additional quantifi ed and scaled values of each central tactical variable are summed with these basic values.
An example of the Bézier surface, which is calculated based on the measured data in the SCA research [5], for successful attacks is presented in Figure 5.
Figure 5. Calculated Bézier surface and the grading curve
4. CALCULATING THE SURFACE AREA RATIO
CURVE
From the produced surface model of the CMEP method, it is possible to cut different slices along xy-, yz- or zx-planes to evaluate different tactical aspects or to conduct a time dependent analysis of them. The calculated grading curve (surface
area ratio curve) of the CMEP method makes it possible to carry out an exhaustive and overall evaluation of the attack exercise. An example is presented in Figure 6.
Figure 6. The surface area ratio curve
From this curve, it is reasonable to read how large a relative portion of the CTVs have reached the required grading level. On the other hand, it is possible to set a grading value which divides the battles into successful or unsuccessful ones. This curve also shows how wide the basis for success has been or if only a few CTVs affecting success have reached the required level. This grading curve is an application of the Abbott-Firestone curve, which is applied to surface analysis [6].
5. BÉZIER SURFACE MODELING
types of practical applications to improve the local information gained from the surface model. They have presented enhanced Bézier curve models. Extensive research has also been conducted to fi nd means to describe the shape information of Bézier surfaces [8] for interpreting different modeled phenomena. These aspects are of great interest when there is a need to integrate qualitative and quantitative measurement results to support tactical analysis.
When evaluating the reliability aspects of the surface modeling, two main points were checked: How the selected Bézier surface calculation differed from other possible modeling techniques in relation to pattern recognition and what the difference is in grading.
The viewpoint of interest focuses to the higher levels of the surface, which start above the layers describing one’s own and the adversary’s casualties together with task fulfi llment. Four different surface modeling techniques were compared: Bézier, Mozaic, Pyramid and Block surfaces. Basically, the Mozaic model describes exactly the measured values of each item in all twenty CTVs. Compared to this, the Block model summarizes the values of different items within each of the twenty CTVs and it shows correctly the summarized values of each CTV. The Pyramid model is otherwise the same, but only the peaks are illustrated with the sharp vertex of twenty cones.
The idea of the CMEP method is to combine time aspect into both CMEP matrix axes, which means that the heights of the neighboring bars should change smoothly according to the tactical phenomena. Unlike
the other modeling techniques, the Bézier surface is able to illustrate this feature due to its mathematical properties. The comparison results of different grading curves and the surfaces of each modeling techniques are presented in Figure 7.
Figure 7. Comparison of different surface modeling techniques
6. INTERPRETATION OF BÉZIER SURFACE PATTERNS
As a part of computing advances in military OR (Operations Research), especially in tactical decision-making, the surface interpretation is based on recognizing some geometrical shapes from the surface pattern. This recognizing process is supported by a picture series describing the most relevant surface shapes which are assumed to present some tactical phenomena and their success.
The comparison of the calculated Bézier surface is performed with theoretical surfaces. Based on these theoretical surfaces, a set of defi nition maps were produced to support the interpretation process of military tactics. The comparison is divided into the following three parts:
• Geometric similarity of the defi nition maps and the calculated surface pattern;
• Synthesis of the surface patterns. From the top view of the calculated surface, it can be proved that surface patterns at different height levels of the surface indicate and highlight by different weightings the aspects which have an effect on the result of the battle. It is as important to recognize these surface patterns at different height levels as it is to recognize the surface pattern at the highest (=most visible) surface level. This shows that several aspects simultaneously have an effect on the result of the battle. It also shows that depending on the battle situation, the impact factor of these aspects varies. As documented in Table 1, in this case example, only one chain is named and analyzed. In this case, according to tactical interpretation, in order to enable initiative in battle, the leaders have ensured the freedom of action by maintaining the possibility to affect in creative ways and by avoiding force binding. In addition to this, the leaders have been open to looking for new possibilities and to taking initiative. Initiative in manoeuvres, effects and other actions has shown in proactive actions to varying situations and the unexpected actions of the adversary. The leaders have had a strong understanding of utilizing the unit’s and its subunits’ execution capability and they have understood the necessary functions to carry out the planned, prepared and trained actions before the adversary has had time to force them to do so. Both the leaders and the subunits have had the courage and the justifi cation to fi nd and use the effects of supporting branches in a simple and creative way to fulfi ll the battle task.
7. DISCUSSION AND CONCLUSIONS
The aim of the CMEP method is to integrate several different variables and affecting factors into one overall tactical analysis according to the leaders’ decisions, solutions, and orders and according to the unit’s actions and according to the events in the battle space.
By integrating a qualitative and quantitative analysis of an attack within the Bézier surface model, it is possible to extract and identify certain key points of the battle:
• Was the battle task fulfi lled and the battle victorious?
• At what cost was the outcome of the battle achieved?
• Timing compared to the correctness of created solutions and selected actions.
• Were the decisions and actions actively justifi ed?
• What were the key variables and culmination points of the attack?
mathematical comparison and pattern recognition in the CMEP method.
The primary challenge was in fi nding an appropriate way to handle several qualitative parameters describing tactical aspects. The sensitivity analysis of the CMEP method consists of interaction between three main analyzing stages, which are 1) the accuracy of the measured data, 2) the mathematical sensitivity of the CMEP method and 3) the sensitivity of the CMEP method’s defi nition maps to support relevant interpretations dealing with the analyzed tactical phenomenon. The sensitivity analysis of the CMEP method shows that it is possible to affect the resolution of the surface model by tuning the scaling of different layers of the surface model. However, a suffi cient amount of source data is more critical to ensure that the height differences of the surface model are clear enough to illustrate different tactical aspects.
REFERENCES
[1] Liddell Hart, B. H. 1954. Strategy - the indirect approach, New York, 336, 338, 341.
[2] Bellamy, C. 1990. The Evolution of Modern Land Warfare, Theory and Practice, Routledge, 13, 15-21, 25.
[3] Field Manual, The Finnish Defence Forces, 2008. Infantry Company’s Battle Guideline, Edita Prima Oy, 18-20, 92-93, 123-124.
[4] Miles, M. B., and Huberman, M. A. 1994. Qualitative Data Analysis, Second Edition, Thousand Oaks, 10-12.
[5] Sormunen, J., and Eskelinen, H. 2010. Measured Tactics - Success Factors of Infantry Company’s Attack, Edita Prima Oy, 43-46 and 61.
[6] Schmahling, J., and Hamprecht, F. A. 2007. Generalizing the Abbott-Firestone curve by two new surface descriptors, Wear, Vol. 262, Issue 11-12, 1360-1371.
[7] Vucina, D., Lozina, Z., and Pehnec, I. Computational procedure for optimum shape design based on chained Bézier surfaces parameterization, Engineering Applications of Artifi cial Intelligence, Vol. 25, Issue 3, No. 4, 2012.
[8] Sohel, F. A., Karmakar, G. C., and Dooley, L. S. 2007. Bezier curve-based character descriptor considering shape information, 6th IEEE/ACIS International Conference on Computer and Information Science, article 4276383, 212-216.
[9] Lind, W. S. 1985. Manoeuvre Warfare Handbook, Westview Special Studies in Military Affairs, 7.