Comparison of soft tissue size between
different facial patterns
Murilo Fernando Neuppmann Feres*, Silvia Fernandes Hitos**,
Helder Inocêncio Paulo de Sousa***, Mirian Aiko Nakane Matsumoto****
Objective: This study was designed to compare the soft tissue morphology of indi-viduals according to their facial patterns. Methods: Were used cephalograms of 90 pa-tients of both genders, aged 12 to 16 years, which were divided into three distinct groups, according to their morphological patterns, i.e., mesofacials, dolichofacials and brachyfacials. The groups were compared in terms of thickness and height of the upper and lower lips, and thickness of the soft tissue chin. Correlations between soft tissue variables and dental and skeletal cephalometric measurements were also investigated.
Results and Conclusions: Thickness of upper lip, lower lip and soft tissue chin showed
no differences in all morphological groups. However, upper and lower lip heights were significantly greater in dolichofacials. Brachyfacials showed smaller upper lip height compared with mesofacials, although no differences were found between those two groups in terms of lower lip height. Assessment of the correlations between soft and skeletal/dental variables evidenced vertical development of the upper and lower lips, commensurate with the vertical development of the skeleton. The vertical positioning of upper incisors significantly correlated with the same parameters related to the lips, which ensured a similar exposure level of these teeth in all groups.
Abstract
Keywords: Vertical pattern. Cephalometry. Lip. Chin.
* MSc in Orthodontics, Pontiic Catholic University of Minas Gerais (PUC - MG). ** MSc in Health Sciences, São Paulo School of Medicine (UNIFESP - EPM). *** Specialist in Orthodontics, Unicastelo University.
INTRODUCTION
The orthodontic literature often describes and classifies the different facial types according to their vertical skeletal features.15,20,23,24,25 This
skeletal pattern classification stems from the need to ensure the use of discrete approaches based on the diagnosis, treatment and prognosis of each group.
On the other hand, less emphasis is given to the description and comparison of aspects relat-ed to the soft tissue of different morphological classes. Most research in this area focuses on in-vestigating soft tissue responses to movements resulting from orthodontic treatment.1,5,8,17,22,28
Some correlate soft tissue characteristics with malocclusions of horizontal origin.6,11 However,
few address soft tissue characteristics of maloc-clusions from a vertical perspective. Moreover, investigations that do address these issues3,4,13
fail to conduct an in-depth examination of the origin or possible causes of any differences that may be found. Thus, we need to generate fur-ther information about these morphological groups and their soft tissue characteristics. The provision of such information may also assist in planning orthodontic cases according to these characteristics while helping to establish a spe-cific soft tissue prognosis for each pattern.
Therefore, this study was designed to com-pare facial groups classified according to their vertical skeletal characteristics (mesofacial, dol-ichofacial and brachyfacial) and to their respec-tive soft tissue morphological features, particu-larly those relating to the lips and chin. More-over, it also aims to determine the skeletal and/ or dental features of the sample, which correlate more significantly with the morphology of the lips and chin, thereby allowing inferences to be made regarding the origin and possible causes of any differences detected between groups.
MATERIAL AND METHODS
This is a cross-sectional, comparative and
de-scriptive study approved by the Ethics in Research Committee of the institution where it was con-ducted (File No. 2003. 1. 1045. 58. 4).
Were used lateral cephalograms of patients aged between 12 and 16 years of both gen-ders whose records were archived at the Or-thodontics Clinic of the university where the study was conducted. Were excluded from the final sample those patients who had un-dergone orthodontic treatment in the period prior to when the radiographs were taken. Furthermore, subjects who had made obvious efforts towards achieving a lip seal were also excluded from the study.
Once selected, the radiographs were divided into three groups consisting of 30 subjects each, according to the morphological patterns dis-played by the patients (mesofacial, dolichofacial and brachyfacial). The criterion used to divide the sample into groups was the measurement of the facial axis (BaN.PtGn), whose normal value18
is 90°. The groups were defined taking into ac-count the 3º variation proposed by McNamara,14
as explained below.
- Mesofacials: facial axis equal to or above 87º and equal to or below 93º.
- Dolichofacials: facial axis above 93º. - Brachyfacials: facial axis below 87º.
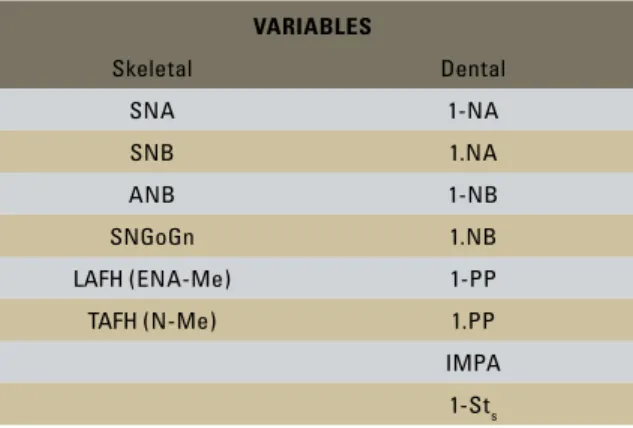
TABLE 1 - Skeletal and dental cephalometric variables. Variables
Skeletal Dental
SNA 1-NA
SNB 1.NA
ANB 1-NB
SNGoGn 1.NB
LAFH (ENA-Me) 1-PP
TAFH (N-Me) 1.PP
IMPA
The radiographs were then traced and subse-quently dental and skeletal cephalometric mea-surements were determined (Table 1).
The following assessments of soft tissue di-mensions were also performed (Fig 1).
- Upper lip thickness (ULT): distance be-tween the junction of the contour of the maxillary incisor and the pre-maxilla, and point UL, located in the anterior-most re-gion of the upper lip contour.
- Upper lip height (ULH): distance between the palatal plane (ANS-PNS) and a parallel line going through Stu (located at the bot-tom of the contour of the upper lip). - Lower lip thickness (LLT): distance
be-tween the junction of the contour of the lower incisor and the anterior contour of the chin, and point LL, located in the ante-rior-most contour of the lower lip.
- Lower lip height (LLH): distance between the mandibular plane and a parallel line go-ing through Stl (located at the upper border of the contour of the lower lip).
- Soft chin thickness (SCT): shortest distance between Pog’ and NB line.
The measurements were performed by a single orthodontist trained for this purpose, who did not know to which group each radiograph belonged.
Statistical Analysis
Group characterization was conducted through descriptive data analysis. To check data normality the Shapiro-Wilk test was ap-plied. Due to the presence of normal distribu-tion of data, parametric tests were used for in-ferential analysis.
Once assessed, the measurement values were compared between the groups. To check for dif-ferences in sample characterization in terms of gender, the Chi-square test was applied, and for age, analysis of variance (ANOVA). Com-parisons between groups for each cephalometric measurement were assessed using ANOVA. For variables whose ANOVA value was significant (p <0.05), the Tukey test for multiple comparison analysis was used. To check the correlation be-tween soft tissue variables and skeletal and den-tal parameters the Pearson correlation coefficient was applied. Correlation strength was analyzed using the values proposed by Santos.19 The level
of significance for statistical tests was 5% (α ≤ 0.05). All tests were performed by the computer program SPSS (10.0, SPSS Inc., Chicago, USA).
RESULTS
Most of the subjects in the mesofacial, doli-chofacial and brachyfacial groups were male (60.0%, 56.7% and 53.3%, respectively), with mean age between 13 and 14 years (13.73 years, 13.43 years, 13.37 years, respectively). The three groups showed no statistical differences regarding composition by gender (p = 0.873) and age (p = 0.555).
The means, standard deviations, maximum and minimum values as well as the comparative NB line
ULT ULH
B
Pog’ SCT
LLT
LLH Palatal plane
Mandibular p lane
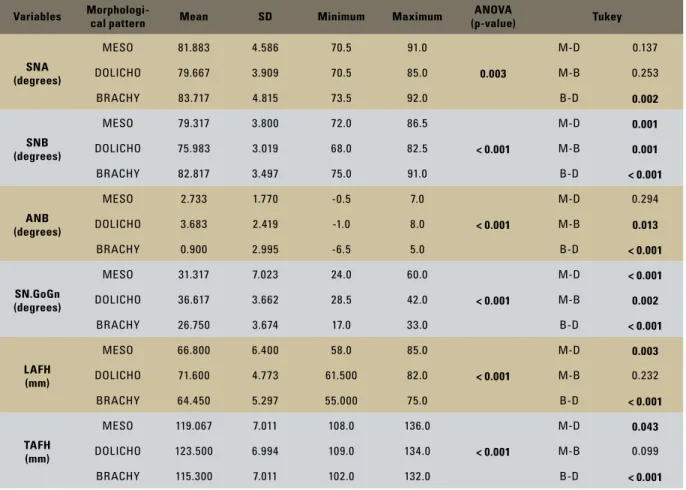
TABLE 2 - Comparison between morphological patterns in terms of skeletal measurements.
Level of significance = 5%. Variables
Morphologi-cal pattern Mean sD Minimum Maximum
aNOVa
(p-value) Tukey
sNa (degrees)
MESO 81.883 4.586 70.5 91.0
0.003
M-D 0.137
DOLICHO 79.667 3.909 70.5 85.0 M-B 0.253
BRACHY 83.717 4.815 73.5 92.0 B-D 0.002
sNb (degrees)
MESO 79.317 3.800 72.0 86.5
< 0.001
M-D 0.001
DOLICHO 75.983 3.019 68.0 82.5 M-B 0.001
BRACHY 82.817 3.497 75.0 91.0 B-D < 0.001
aNb (degrees)
MESO 2.733 1.770 -0.5 7.0
< 0.001
M-D 0.294
DOLICHO 3.683 2.419 -1.0 8.0 M-B 0.013
BRACHY 0.900 2.995 -6.5 5.0 B-D < 0.001
sN.GoGn (degrees)
MESO 31.317 7.023 24.0 60.0
< 0.001
M-D < 0.001
DOLICHO 36.617 3.662 28.5 42.0 M-B 0.002
BRACHY 26.750 3.674 17.0 33.0 B-D < 0.001
laFH (mm)
MESO 66.800 6.400 58.0 85.0
< 0.001
M-D 0.003
DOLICHO 71.600 4.773 61.500 82.0 M-B 0.232
BRACHY 64.450 5.297 55.000 75.0 B-D < 0.001
TaFH (mm)
MESO 119.067 7.011 108.0 136.0
< 0.001
M-D 0.043
DOLICHO 123.500 6.994 109.0 134.0 M-B 0.099
BRACHY 115.300 7.011 102.0 132.0 B-D < 0.001
analysis relating to skeletal and dental cephalo-metric measurements are depicted in Tables 2 and 3, respectively.
Soft tissue measurements (Table 4)
There was no statistical difference between the facial groups with regard to the thickness of both upper and lower lips.
However, the groups were considered dif-ferent from each other in terms of upper lip height. Dolichofacials exhibited significantly longer lips, followed by mesofacials and brachy-facials, who displayed significantly shorter lips.
Regarding lower lip height, there were no
significant differences between mesofacials and brachyfacials. However, the dolichofacial group exhibited significantly higher means compared with the other groups, indicating that dolichofa-cials have lips that are vertically longer.
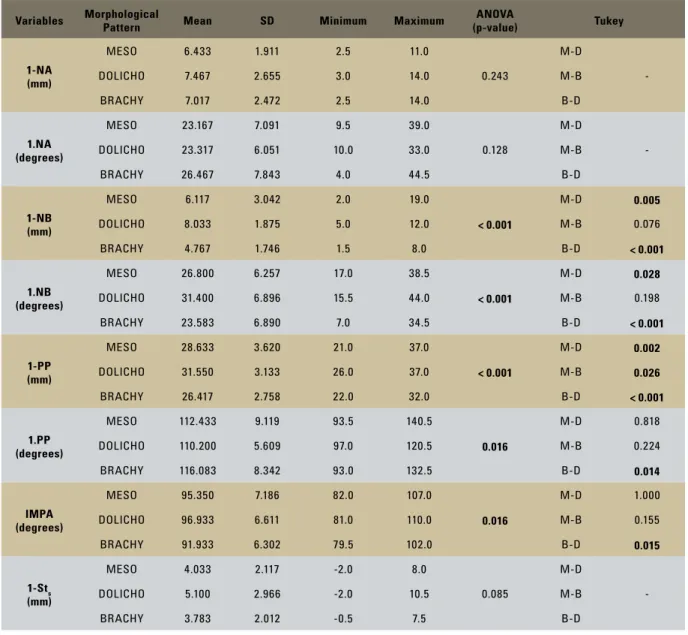
TABLE 3 - Comparison between morphological patterns in terms of dental measurements.
Level of significance = 5%.
Variables Morphological Pattern Mean sD Minimum Maximum (p-value)aNOVa Tukey
1-Na (mm)
MESO 6.433 1.911 2.5 11.0
0.243
M-D
-DOLICHO 7.467 2.655 3.0 14.0 M-B
BRACHY 7.017 2.472 2.5 14.0 B-D
1.Na (degrees)
MESO 23.167 7.091 9.5 39.0
0.128
M-D
-DOLICHO 23.317 6.051 10.0 33.0 M-B
BRACHY 26.467 7.843 4.0 44.5 B-D
1-Nb (mm)
MESO 6.117 3.042 2.0 19.0
< 0.001
M-D 0.005
DOLICHO 8.033 1.875 5.0 12.0 M-B 0.076
BRACHY 4.767 1.746 1.5 8.0 B-D < 0.001
1.Nb (degrees)
MESO 26.800 6.257 17.0 38.5
< 0.001
M-D 0.028
DOLICHO 31.400 6.896 15.5 44.0 M-B 0.198
BRACHY 23.583 6.890 7.0 34.5 B-D < 0.001
1-PP (mm)
MESO 28.633 3.620 21.0 37.0
< 0.001
M-D 0.002
DOLICHO 31.550 3.133 26.0 37.0 M-B 0.026
BRACHY 26.417 2.758 22.0 32.0 B-D < 0.001
1.PP (degrees)
MESO 112.433 9.119 93.5 140.5
0.016
M-D 0.818
DOLICHO 110.200 5.609 97.0 120.5 M-B 0.224
BRACHY 116.083 8.342 93.0 132.5 B-D 0.014
iMPa (degrees)
MESO 95.350 7.186 82.0 107.0
0.016
M-D 1.000
DOLICHO 96.933 6.611 81.0 110.0 M-B 0.155
BRACHY 91.933 6.302 79.5 102.0 B-D 0.015
1-sts (mm)
MESO 4.033 2.117 -2.0 8.0
0.085
M-D
-DOLICHO 5.100 2.966 -2.0 10.5 M-B
BRACHY 3.783 2.012 -0.5 7.5 B-D
Correlation between soft tissue, skeletal and dental variables (Table 5)
Soft tissue variables were compared among themselves as well as with all dental and skeletal variables. The correlations that reached statistical significance are shown below.
Upper lip thickness correlated moderately with lower lip, so that as one increased, so did the other.
TABLE 4 - Comparison between morphological patterns in terms of soft tissue measurements.
Variables Morphological
Pattern Mean sD Minimum Maximum
aNOVa
(p-valor) Tukey
UlT (mm)
MESO 17.033 2.810 11.0 23.5
0.262
M-D
-DOLICHO 16.750 2.417 11.5 20.5 M-B
BRACHY 17.817 2.541 11.0 24.0 B-D
UlH (mm)
MESO 25.267 3.919 19.0 33.0
< 0.001
M-D 0.037
DOLICHO 27.417 3.135 22.5 35.0 M-B 0.050
BRACHY 23.217 2.559 19.0 28.5 B-D < 0.001
llT (mm)
MESO 18.483 2.164 16.0 26.0
0.576
M-D
-DOLICHO 18.133 1.814 14.0 21.0 M-B
BRACHY 17.917 2.301 15.0 25.5 B-D
llH (mm)
MESO 44.633 3.924 38.0 56.0
< 0.001
M-D 0.012
DOLICHO 47.617 3.718 40.5 40.5 M-B 1.000
BRACHY 43.850 4.052 34.0 54.0 B-D 0.001
sCT (mm)
MESO 15.800 2.575 12.0 20.5
0.046
M-D 0.124
DOLICHO 14.483 2.284 10.0 19.5 M-B 1.000
BRACHY 15.933 2.515 12.0 23.0 B-D 0.075
Level of significance = 5%.
TABLE 5 - Significant correlations between soft tissue, skeletal and dental measurements.
soft tissue measurements
UlT UlH llT llH sCT
skeletal measurements
SNA - -0.229* - -
-SNB - -0.286* - -
-ANB -0.278* - - -
-SN.GoGn - 0.307* - 0.327* -0.246*
LAFH - 0.800*** 0.309* 0.829***
-TAFH 0.270* 0.654** 0.341* 0.732**
-Dental measurements
1-NA 0.251* 0.329* - -
-1.NA 0.364* - - -
-1-PP - 0.811*** - 0.613**
-1.PP 0.302* -0.256* - -
-1-Sts - - - -
-1-NB - 0.333* 0.210* 0.460* -0.241*
1.NB - 0.329* - 0.386* -0.249*
IMPA - - - -
-soft tissue measurements
ULT - 0.549** 0.335* 0.471*
ULH - - 0.590**
-LLT 0.549** - 0.492* 0.415*
LLH 0.335* 0.590** 0.492*
-SCT 0.471* - 0.415*
-Level of significance = 5%.
The degree of upper incisor extrusion, as given by the shortest distance from its incisal point to the palatal plane (1-PP), established moderate and positive correlation with lower lip height, and strong and positive correlation with upper lip height.
Regarding soft chin thickness, although signifi-cant correlations were observed, these were not so strong. All other measurements pertaining to soft tissue also displayed low strength correlations.
DISCUSSION
The literature states that the dimensions of facial soft tissues vary considerably as a result of sexual dimorphism and age.7,9,11,16 However,
the groups compared in this study were uni-form with respect to the distribution of both variables, which enabled us to undertake com-parative studies.
Although the parameter used for determin-ing the facial groups in this research (BaN.PtGn), departs from the criterion adopted by Blanch-ette et al,3 Lai, Gosh and Nanda13 and Boneco
and Jardim,4 it was considered suitable for the
morphological classification of patients. This is due to the fact that the groups determined by this criterion, especially the facial patterns at the two opposite extremes (brachyfacials and dolichofacials), differed significantly from the parameters used by the aforementioned au-thors3,4,13 to group their respective samples. We,
therefore, found it appropriate to compare their results3,4,13 with those achieved in this study.
According to data obtained in this investiga-tion, the facial groups did not differ significantly with respect to the thickness of the upper lip, lower lip and soft tissue chin. These data are consistent with research by Boneco and Jardim4
and Lai, Gosh and Nanda.13 These findings,
how-ever, differed from a study by Blanchette et al.3
According to the latter authors,3 the thickness of
the soft tissues of the lip and chin vary to com-pensate for an absence or excess of underlying
hard structure. Thus, dolichofacial individuals, whose basal bones are usually more retruded, exhibit greater thickness of the lip and soft tis-sue chin. Moreover, according to these research-ers,3 brachyfacials display lower horizontal soft
tissue profile magnitudes given their significant-ly sturdier undersignificant-lying structure. Although the results of this study demonstrate an effective distinction in the level of horizontal projection of the maxillary bones, as noted by Blanchette et al,3 no differences were found between the
morphological types with respect to the thick-ness of both the upper and lower lip and the soft tissue chin. According to data derived from this study, the soft tissue is not able to compensate for any bone discrepancy through differential horizontal growth. This finding is corroborated by the fact that this study did not disclose rele-vant correlation levels between lip and soft chin thickness variables and horizontal skeletal mag-nitudes, such as SNA, SNB and ANB.
Blanchette et al3, Lai, Gosh and Nanda,13
as well as Boneco and Jardim4 confirmed that
dolichofacials have longer lips, whereas brachy-facials’ lips are shorter. These observations—al-though stemming from measures that diverge slightly from those employed here—agree with the data from this study. According to Blanch-ette et al3 and Boneco and Jardim,4 the size of
dolichofacials’ lips is greater in the vertical di-rection in order to compensate for lip seal diffi-culties, as these individuals are more prone than others to develop lip incompetence.26,29
Lip “elongation”, observed particularly in dolichofacials in this study was large enough to prevent the upper incisor of these patients from being overexposed. As noted, dolichofa-cials’ upper incisors are more extruded than those of other facial groups (1-PP), which has also been observed by other authors.10,21
of dolichofacials’ upper lips, which proved suf-ficient to compensate for the extrusion, or the lower position of the upper incisors. The re-verse was observed in brachyfacials. These in-dividuals had shorter lips and more superiorly positioned teeth, which ensured a level of inci-sor exposure similar to that of dolichofacials. With regard to this hypothesis, we highlight the fact that the variables that correspond to the vertical incisor position (1-PP) showed a positive and strong correlation with the height of the upper lip. According to data from this study and confirmed by Peck, Peck and Kata-ja,16 the greater the vertical length of the upper
lip, the greater the “extrusion” of upper inci-sors. It is not advisable, however, to establish a cause and effect relationship between the level of extrusion of the upper incisors and upper lip height, although such link could be suggested.
The anterior lower and total facial height variables also strongly correlated with upper lip height. Both are significantly higher in dolicho-facials and lower in brachydolicho-facials, as reported in other studies.10,15,20,24 It is our opinion that the
upper lip tends to follow the underlying verti-cal skeletal development. Therefore, dolichofa-cials—whose skeletal structure stands out in the vertical direction—exhibit upper lip dimensions also characterized by excessive vertical devel-opment. Brachyfacials, in turn, tend to display relatively smaller vertical bone structure as well as smaller upper lips.
This hypothesis is further reinforced in view of the vertical dimensions of the lower lip. This variable was significantly higher for dolichofacials than for brachyfacials. Further-more, it exhibited a relevant correlation with the same vertical skeletal variables (LAFH and TAFH). Therefore, the dimensions of the lower and upper lips are commensurate with their underlying skeletal dimensions. Vig and Co-hen27 agree with this relationship and further
report that—proportionately—the combined
growth of the upper and lower lips may even exceed the growth of the lower facial height.
Given its plasticity,2 the stomatognathic
sys-tem is highly capable of developing adaptive patterns. Therefore, above and beyond mere comparisons, we need to understand the inter-actions established between the hard and soft tissues in the different facial patterns. Although other authors6,8,12 have suggested that the soft
tissues of the face are dynamic structures and, as such, can develop independently of the hard structures, data from our sample show evidence that the lip develops vertically in line with both the vertical skeletal development and vertical positioning of the upper incisors.
The analysis performed in this study al-lowed us, therefore, to disclose the morpho-logical similarities and differences that should inform orthodontists and professionals from related areas in their approach to the different facial types.
The uniformity we noted in the thickness of the lips and soft tissue chin rules out the hy-pothesis of soft tissue compensation and recom-mends the adoption of therapies focused on the preservation of the soft tissue profile of patients with inherent maxillomandibular retrusion, such as dolichofacials.
Lip “elongation” was found to correlate with excessive vertical skeletal development, which reinforces the dominant paradigm and points to a favorable treatment prognosis for dolichofa-cial patients in terms of their motor and labial rehabilitation.
CONCLUSIONS
Through a comparative analysis of the dif-ferent facial pattern groups, we were able to conclude that:
• Thicknessofupperlip,lowerlipandsoft
tissue chin did not differ significantly be-tween groups.
-ferences between the three groups. It was greater for dolichofacials and lower for brachyfacials, when these two groups were compared between themselves, and with mesofacials.
• Lowerlipheightwassigniicantlygreater
for dolichofacials when these were sepa-rately compared with the other morpho-logical groups.
• Mesofacialsandbrachyfacialsdidnotdif -fer with respect to lower lip height. In checking the correlations established be-tween the soft and hard tissue variables, the
main findings should be highlighted:
• Upper lip height was very strongly cor -related with lower anterior facial height. Furthermore, lower lip height correlated strongly with lower anterior and total fa-cial heights. This indicates a tendency to-wards an “alignment” between upper lip and lower vertical facial development.
• Upperlipheightcorrelatedstronglywith
the vertical positioning of the upper inci-sors, which ensured—to a certain extent— a constant exposure of these teeth across the different morphological groups.
1. Basciftci FA, Uysal T, Buyukerkmen A, Demir A. The inluence of extraction treatment on Holdaway soft-tissue measurements. Angle Orthod. 2004 Apr;74(2):167-73. 2. Bianchini EMG. Desproporções maxilomandibulares: atuação fonoaudiológica com pacientes submetidos à cirurgia ortognática. In: Marchesan IQ, Bollai C, Gomes ICD, Zorzo JL. Tópicos em fonoaudiologia. São Paulo: Lovise; 1995. p. 129-45.
3. Blanchette ME, Nanda RS, Currier GF, Ghosh J, Nanda SK. A longitudinal cephalometric study of the soft tissue proile of short- and long-face syndromes from 7 to 17 years. Am J Orthod Dentofacial Orthop. 1996 Feb;109(2):116-31. 4. Boneco C, Jardim L. Estudo da morfologia labial em
pacientes com padrão facial vertical alterado. Rev Port Estom Med Dent Cir Maxilofac. 2005;46(2):69-80.
5. Del Santo LM, Souza RP, Del Santo M Jr, Marcantonio E. Alterações no peril dos lábios de pacientes submetidos a avanços maxilares em cirurgia ortognática do tipo Le Fort l. Rev Dental Press Ortod Ortop Facial. 2004 set-out;9(5):49-63.
6. Ferrario VF, Sforza C. Size and shape of soft-tissue facial proile: effects of age, gender, and skeletal class. Cleft Palate Craniofac J. 1997 Nov;34(6)498-504.
REFERENCES
7. Ferrario VF, Sforza C, Schmitz JH, Ciusa V, Colombo A. Normal growth and development of the lips: a 3-dimensional study from 6 years to adulthood using a geometric model. J Anat. 2000 Apr;196(Pt3):415-23.
8. Gomes P, Jardim L. Estudo cefalométrico do peril cutâneo de jovens adultos tratados ortodonticamente com e sem extrações. Rev Port Estom Med Dent Cir Maxilofac. 2006;47(2):69-78. 9. Halazonetis DJ. Morphometric evaluation of soft-tissue proile
shape. Am J Orthod Dentofacial Orthop. 2007 Apr;131(4):481-9. 10. Haralabakis NB, Yiagtzis SC, Toutountzakis NM. Cephalometric
characteristics of open bite in adults: a three-dimensional cephalometric evaluation. Int J Adult Orthodon Orthognath Surg. 1994;9(3):223-31.
11. Hoffelder LB, Lima EM, Martinelli FL, Bolognese AM. Soft-tissue changes during facial growth in skeletal Class II individuals. Am J Orthod Dentofacial Orthop. 2007 Apr;131(4):490-5.
12. Kuyl MH, Verbeeck RM, Dermaut LR. The integumental proile: a relection of the underlying skeletal coniguration? Am J Orthod Dentofacial Orthop. 1994 Dec;106(6):597-604. 13. Lai J, Ghosh J, Nanda RS. Effect of orthodontic therapy on the
Contact address
Murilo Fernando Neuppmann Feres
Rua Dr. Bacelar, nº 730, apto. 173 – Vila Clementino CEP: 04.026-001 – São Paulo / SP, Brazil
E-mail: [email protected]
Submitted: October 2008 Revised and accepted: March 2009
14. McNamara JA Jr. A method of cephalometric evaluation. Am J Orthod. 1984 Dec;86(6):449-69.
15. Opdebeeck H, Bell WH. The short face syndrome. Am J Orthod. 1978 May;73(5):499-511.
16. Peck S, Peck L, Kataja M. Some vertical lineaments of lip position. Am J Orthod Dentofacial Orthop. 1992 Jun;101(6):519-24.
17. Ramos AL, Sakima MT, Pinto AS, Bowman SJ. Upper lip changes correlated to maxillary incisor retraction - a metallic implant study. Angle Orthod. 2005 Jul;75(4):499-505. 18. Ricketts RM. A foundation for cephalometric communication.
Am J Orthod. 1960 May;46(5):330-57.
19. Santos C. Estatística descritiva: manual de auto-aprendizagem. Lisboa: Edições Sílabo; 2007.
20. Schendel SA, Eisenfeld J, Bell WH, Epker BN, Mishelevich DJ. The long face syndrome: vertical maxillary excess. Am J Orthod. 1976 Oct;70(4):398-408.
21. Schendel SA, Eisenfeld JH, Bell WH, Epker BN. Superior repositioning of the maxilla: stability and soft tissue osseous relations. Am J Orthod. 1976 Dec;70(6):663-74.
22. Silveira CA, Correa FA, Vedovello M Filho, Valdrigh HC, Vedovello SA, Telles EZ. Alterações do ângulo nasolabial e da inclinação do incisivo central superior pós-tratamento ortodôntico. Ortodontia. 2006 jan-mar;39(1):31-6.
23. Stuani AS, Matsumoto MA, Stuani MB. Cephalometric evaluation of patients with anterior open-bite. Braz Dent J. 2000;11(1):35-40. 24. Taibah SM, Feteih RM. Cephalometric features of anterior open
bite. World J Orthod. 2007 Summer;8(2):145-52.
25. Tsai HH. Cephalometric studies of children with long and short faces. J Clin Pediatr Dent. 2000 Fall;25(1):23-8.
26. Tsang WM, Cheung LK, Samman N. Cephalometric characteristics of anterior open bite in a southern Chinese population. Am J Orthod Dentofacial Orthop. 1998 Feb;113(2):165-72.
27. Vig PS, Cohen AM. Vertical growth of the lips: a serial cephalometric study. Am J Orthod. 1979 Apr;75(4):405-15. 28. Wen-Ching Ko E, Figueroa AA, Polley JW. Soft tissue
proile changes after maxillary advancement with distraction osteogenesis by use of a rigid external distraction device: a 1-year follow-up. J Oral Maxillofac Surg. 2000 Sep;58(9):959-69. 29. Yamaguchi K, Morimoto Y, Nanda RS, Ghosh J, Tanne K.