DOI: http://dx.doi.org/10.1590/1516-1439.331714
Materials Research. 2015; 18(Suppl. 1): 106-109 © 2015
*e-mail: [email protected]
1. Introduction
Since the theoretical model for nanocomposite magnet was put forward by Coehoorn et al.1, much work has been done in regards to this topic. Nd2Fe14B/α-Fe nanocomposite is a promising permanent magnetic material by combining advantages of Nd2Fe14B and α-Fe phases through magnetic exchange coupling between the two2. However, the exchange coupling is only effective within a critical length, typically 20 nm[3]. Hence, the microstructure plays a key role in determining the magnetic behavior. Uniform phase distribution in combination with ine grain sizes is needed for excellent magnetic performance in Nd2Fe14B /α-Fe composite4.
Melt spinning method is an effective way to produce Nd2Fe14B/α-Fe nanocomposite. From our available experiments we ind that the processing window is pretty narrow in optimizing magnetic properties for nanocrystallites prepared directly by low-speed melt spinning. Uniformly distributed and reined microstructure can be achieved through crystallization of the amphormos matrix produced by quenching5,6. Based on this concept, a substantial amount of work has been done to optimize the nanocomposite microstructure. Element doping, such as Zr[7], Nb[8], Ti[9], W[10] etc., or combined addition11,12, promotes the formation of amorphous phase by increasing the whole entropy, which may effectively reine the grain size by forming grain boundaries13. However, it is dificult to co-regulate the microstructure of Nd2Fe14B and α-Fe phases as the crystallization behavior for the two phases differs much14,15. It is still a pending problem to achieve an ideal microstructure in Nd2Fe14B/α-Fe nanocomposite, which is much more complex in substantial system than that deined by theoretical
model2. It is necessary to investigate the crystallization process as well as the corresponding exchange interaction behavior in order to gain a comprehensive understanding and improvement of the magnetic performance.
In this work the effect of microstructure on magnetic properties was investigated on stoichiometric Nd8Fe84Ti2B6 compound by varying annealing temperature. In order to clarify the role of exchange coupling between the Nd2Fe14B /α-Fe dual phases for a typical microstructure, irst-order reversal curve (FORC) diagram method is adopted to reveal the magnetic competition in our investigated system16, which allows the characterization of the switching ield distribution as well17.
2. Experimental Procedure
Stoichiometric Nd8Fe84Ti2B6 ingot was prepared by induction melting Nd, Fe and Fe-B under Ar atmosphere. Ribbons were obtained by ejecting the melt from a quartz nozzle with a diameter of 0.8 mm onto a spinning molybdenum wheel with the chamber pressure of 0.4 atm and the ejection pressure of 0.3 atm, respectively. Differential scanning calorimetry (DSC) curve for the as spun ribbon was obtained on Mettler Toledo TGA/DSC1 system in a temperature range of 50-1000 °C with a heating rate of 20 °C/min. The ribbons were annealed in a series of temperatures (800 °C, 810 °C, 820 °C, 830 °C, 840 °C, 850 °C, 860 °C) for 10 minutes in a steel tube under an argon atmosphere, and water-quenching cooling was applied afterwards. Room temperature magnetic measurements were carried out on Quantum Design Versalab with a maximum magnetic ield of 3 T. X-ray diffraction (XRD) was carried out on smart Rigaku X-ray diffractometer (Co Kα radiation).
Study on Magnetic Behavior of Nd
8Fe
84Ti
2B
6Nanocomposite by FORC Diagram
Jinling Jina, Yuchao Liua, Kuoshe Lia, Yang Luoa*, Dunbo Yua, Shuo Lua, Jiajun Xiea, Binbin Lva
aNational Engineering Research Center for Rare Earth Materials, General Research Institute for
Non-ferrous Metals, Grirem Advanced Materials Co. Ltd., Beijing 100088, China
Received: September 27, 2014; Revised: October 9, 2015
Systematic investigation was made on the magnetic property of a series of Nd2Fe14B/α-Fe nanocomposites prepared by crystallization of amorphous Nd8Fe84Ti2B6 ribbon at annealing temperatures in the range of 800-860 °C. Both remanence and energy product increase with increasing annealing temperature, reaching the maximum values at 850 °C. Coercivity remains around 5.5 kOe for the annealing temperatures above 800 °C. Although the smooth demagnetization curve indicates effective exchange coupling between the Nd2Fe14B/α-Fe dual phases, FORC diagram reveals the existence of α-Fe for the Nd8Fe84Ti2B6 ribbon annealed at 850 °C. In addition, the variation of microcoercivity at different locations indicates a distributed exchange interaction, which can be caused by the nonuniform microstructure. The magnetic property is also affected by the demagnetization effect caused by the particle shape, which is evidenced by the negative region in the irst-order reversal curve (FORC) diagram.
2015; 18(Suppl. 1) Study on Magnetic Behavior of Nd8Fe84Ti2B6 Nanocomposite by FORC Diagram 107
3. Results and Discussion
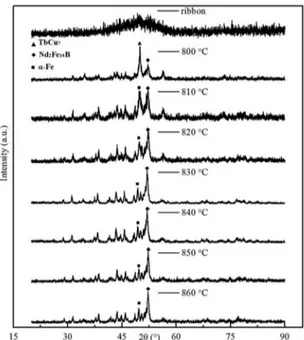
In order to obtain amorphous Nd8Fe84Ti2B6 matrix, ribbons at a series of wheel velocities (14, 16, 18, 20, 22, and 24 m/s) were prepared. The XRD peak proiles indicate that amorphous phase is formed at a velocity higher than 20 m/s. Ribbons at a velocity of 22 m/s is employed in the investigation. The XRD of the ribbon is displayed at the top of Figure 1, which shows a distinct amorphous peak.
DSC measurement was carried out to estimate the crystallization temperature. Figure 2 displays the DSC curve for the as spun Nd8Fe84Ti2B6 ribbon in a temperature range of 50-1000 °C with a heating rate of 20 °C/min under argon atmosphere. Two apparent anomalies can be distinguished at 610 °C and 695 °C, which correspond to the two-step crystallizaton of Nd2Fe14B. Firstly, a metastable intermediate phase is formed as indicated by the peak at 610 °C. Secondly, the metastable phase is decomposed and transformed into Nd2Fe14B phase with increasing temperature18.
Both nucleation rate and grain growth rate increase exponentially with increasing annealing temperature, so there is a optimum annealing temperature to maximize the nucleariotion rate and reinement of the grains. Short heating time and rapid quenching are aslo necessary for a reined microstructure. Based on these considerations, we design the annealing experiments from 800 °C to 860 °C with an increment of 10 °C for 10 minutes. The XRD patterns for the annealed samples are also shown in Figure 1. TbCu7-type metastable structure is evident for sample annealed at 800 °C, for which some trace of Nd2Fe14B and ɑ-Fe phase can also be distinguished. With increasing annealing temperature, Nd2Fe14B and ɑ-Fe phases become dominant instead of the metastable phase.
Magnetic measurements were carried out to investigate the magnetic interactions for the annealed Nd8Fe84Ti2B6 with Nd2Fe14B/α-Fe dual phases. The remanence, coercivity, energy product of the annealed samples are shown in Figure 3. As shown in the inset of Figure 3, the demagnetization curves of all annealed samples are smooth except the one annealed at 800 °C. This is characteristic of a monophase, which means that the inter-exchange between the soft and permanent magnetic phases takes effect. The increasing remanance with annealing temperature indicates an enhanced exchange interaction between Nd2Fe14B and α-Fe phases, which reaches a maximum value of 8.1 kGs at an annealing temperature of 850 °C. Magnetic energy product shows the same trend with remanence, which reaches a maximum value of 7.6 MGOe also at an annealing temperature of 850 °C. Generally speaking, the coercivity deteriorates with increasing remanence. However, the coercivity remains steady with increasing annealing temperature, which may be attributed to the reined microstructure after annealing.
In order to get a comprehensive understanding of our investigated system, we use FORC diagram method to analyze magnetic exchange interaction and the switching ield distribution for the sample annealed at a temperature of 850 °C. Each FORC is a partial recoil loop, which begins by saturating the sample under a magnetic ield of 30 kOe. The magnetic ield decreases to a reversal ield Hr and a FORC is recorded with the magnetic ield increasing from
Hr to 30 kOe. Figure 4 shows a batch of representative
Figure 1. XRD results for the as spun ribbon and annealed samples for Nd8Fe84Ti2B6 at different annealing temperatures.
Figure 2. DSC curve for as spun Nd8Fe84Ti2B6 ribbon in a temperature of 50-1000 °C with a heating rate of 20 °C/min under Ar atmosphere.
Figure 3. The remanence, coercivity and magnetic energy product for samples annealed at 800, 810, 820, 830, 840, 850, and 860 °C for 10 min under Argon atmosphere. Inset is the corresponding
Jin et al.
108 Materials Research
FORCs. The FORC diagram ρ(Hr,H) was obtained by the following mixed second derivative:
2
1 ( , )
( , ) 2
∂ = −
∂ ∂
M Hr H Hr H
Hr H
ρ (1)
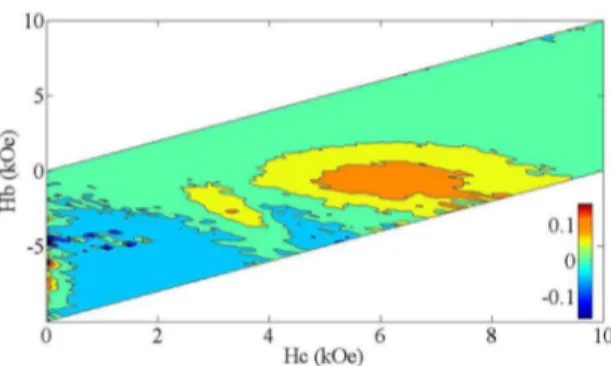
The coordinate in the diagram is transformed from {Hr, H} to {Hc = (H – Hr) / 2, Hb = (H + Hr) / 2}[19]. As for each loop H ≥ Hr, Hc is always a positive value. So the FORC diagram is conined to the right-hand half plane. The Hc co-ordinate is referred to as the microcoercivity. In our experiment Hr varies from –10 kOe to 0 kOe with an increment of 200 Oe. The calculated FORC diagram is shown in Figure 5 by using SF=3[20], which indicates two main magnetic phases in the annealed sample. An irreversible peak is located at position around 60 kOe due to the exchange interaction between soft and hard magnetic phase, which is consistent with the demagnetization curve. The effective microcoercivity is widely dispersed, which may be due to the inhomogeneous microstructure. However, soft phase still exists as illustrated by the reversible peak around the origin. The negative region indicates the existence of demagnetization effect caused by the particle shape, which is against the magnetization of the system.
4. Conclusion
The magnetic performance of Nd8Fe84Ti2B6 is signiicantly affected by annealing temperature, and an optimum combination of magnetic properties is obtained with an annealing temperature of 850 °C. The FORC diagram can give more detailed information than mere demagnetization curves. From FORC diagram we ind that the exchange interaction intensity is distributed across a wide range, which results in a wide range of microcoercivity. In spite of the smooth curve indicated by the demagnetization curve, soft magnetic is evident in FORC diagram because of the deicient coupling of α-Fe with hard magnetic phase. The demagnetization effect generated by particle shape also has an effect on magnetic performance of our investigated system. There is still much room for improving the magnetic performance of Nd8Fe84Ti2B6 nanocomposite by enhancing the exchange interactions between Nd2Fe14B and α-Fe phases through optimizing the microstructure.
Acknowledgements
This work is supported by the special fund of Rare earth Industrial upgrading in 2014 on “Key engineering preparation techniques of low-cost bonded mixed rare earth permanent magnet (MM-Fe-B)” sponsored by Industrialization and Information Department.
Figure 5. FORC diagram for Nd8Fe84Ti2B6 at an annealing temperature of 850 °C.
Figure 4. The FORCs with different reversal ield Hr.
References
1. Coehoorn R, Mooij DB, Duchateau JPWB and Buschow KHJ. Novel permanent magnetic materials made by rapid quenching.
Le Journal De Physique Colloques. 1988; 49(C8):669-670. http://dx.doi.org/10.1051/jphyscol:19888304.
2. Skomski R and Coey JMD. Giant energy product in nanostructured two-phase magnets. Physical Review B: Condensed Matter and Materials Physics. 1993; 48(21):15812-15816. http://dx.doi. org/10.1103/PhysRevB.48.15812. PMid:10008137. 3. Schrefl T and Fidler J. Modelling of exchange-spring permanent
magnets. Journal of Magnetism and Magnetic Materials. 1998; 177:970-975. http://dx.doi.org/10.1016/S0304-8853(97)00653-7. 4. Jin ZQ, Okumura H, Wang HL and Hadjipanayis GC. Microstructure
and magnetic properties of (Pr,Tb)2(Fe,Nb,Zr)14B/α-Fe nanocomposites. Journal of Applied Physics. 2002; 91(10):8165-8167. http://dx.doi.org/10.1063/1.1446118.
5. Uehara M, Konno TJ, Kanekiyo H, Hirosawa S, Sumiyama K
and Suzuki K. Effect of Cr doping on crystallization behavior
of Fe3B/Nd2Fe14B nanocomposite permanent magnets. Journal
of Magnetism and Magnetic Materials. 1998; 177:997-998. http://dx.doi.org/10.1016/S0304-8853(97)00516-7.
6. Zhanyong W, Wenqing L, Bangxin Z, Jiansen N, Hui X, Yongzheng
F, et al. High coercivity Nd2Fe14B/α-Fe nanocomposite magnets.
Physica B, Condensed Matter. 2009; 404(8-11):1321-1325. http://dx.doi.org/10.1016/j.physb.2008.12.022.
7. Zhang PY, Hiergeist R, Lüdke J, Albrecht M and Ge HL.
Magnetization reversal behavior in high coercivity Zr doped α-Fe/Nd2Fe14B nanocomposite alloys. Journal of Applied Physics. 2010; 108(4):043905. http://dx.doi.org/10.1063/1.3457105.
8. Wang C and Chang WC. Significant changes in crystallization
kinetics of Nd2Fe14B/α-Fe nanocomposites induced by Nb addition.
Journal of Physics: Conference Series. 2011; 266(1):012047. http://dx.doi.org/10.1088/1742-6596/266/1/012047.
2015; 18(Suppl. 1) Study on Magnetic Behavior of Nd8Fe84Ti2B6 Nanocomposite by FORC Diagram 109
10. You CY, Sun XK, Liu W, Cui BZ, Zhao XG, Geng DY, et al. Effects of W and Co additions on the phase transformation and magnetic properties of nanocomposite Nd2Fe14B/α-Fe magnets.
Journal of Physics D: Applied Physics. 2002; 35(10):943-950. http://dx.doi.org/10.1088/0022-3727/35/10/301.
11. Yang S, Song XP, Liu XS, Li SD, Qin W, Gu BX, et al. Magnetic properties enhancement of Nd2Fe14B/α-Fe nanocomposites with a combined addition of Cu and Ti. Journal of Applied Physics. 2003; 93(2):1199-1202. http://dx.doi.org/10.1063/1.1530368.
12. Ping DH, Wu YQ and Hono K. Microstructure and magnetic
properties of microalloyed α-Fe/Nd2Fe14B nanocomposites. Journal
of Magnetism and Magnetic Materials. 2002; 239(1):437-440. http://dx.doi.org/10.1016/S0304-8853(01)00615-1.
13. Wu YQ, Kramer MJ, Chen Z, Ma BM and Miller MK. Behavior of Nb atoms in Nb substituted Nd2Fe14B nanocrystalline alloys investigated by atom probe tomography. IEEE Transactions on Magnetics. 2004; 40(4):2886-2888. http://dx.doi.org/10.1109/ TMAG.2004.829018.
14. Wang C, Lan MY and Yan M. Study on crystallization behavior
and microstructure of melt-spun Nd2(Fe,Nb)14B/α-Fe alloys.
Journal of Materials Science. 2010; 45(20):5637-5641. http:// dx.doi.org/10.1007/s10853-010-4628-8.
15. Gao YD, Zhang SQ and Liu BC. Crystallization behavior of
melt–spun Nd7Fe86Nb1B6 ribbons under different heating rates.
Journal of Magnetism and Magnetic Materials. 2000; 208(3):158-162. http://dx.doi.org/10.1016/S0304-8853(99)00583-1.
16. Cornejo DR, Peixoto TRF, Reboh S, Fichtner PFP, Franco VC, Villas-Boas V, et al. First-order-reversal-curve analysis of Pr–Fe–B-based nanocomposites. Journal of Magnetism and Magnetic Materials. 2010; 322(7):827-831. http://dx.doi. org/10.1016/j.jmmm.2009.11.012.
17. Clime L, Veres T and Yelon A. Identification of switching fields in magnetic nanostructures by partial first order reversal curves.
Journal of Applied Physics. 2007; 102:013903. http://dx.doi. org/10.1063/1.2751115.
18. Jin ZQ, Okumura H, Wang HL, Muñoz JS, Papaefthymiou V and Hadjipanayis GC. Crystallization behavior and magnetic properties
of melt-spun (Pr,Tb)2(Fe,Nb)14B/α-Fe nanocomposites. Journal
of Magnetism and Magnetic Materials. 2002; 242-245:1307-1309. http://dx.doi.org/10.1016/S0304-8853(01)01273-2.
19. Pike CR. First-order reversal-curve diagrams and reversible
magnetization. Physical Review B: Condensed Matter and Materials Physics. 2003; 68(10):104424. http://dx.doi.org/10.1103/ PhysRevB.68.104424.
20. Pike CR, Roberts AP and Verosub KL. Characterizing interactions