* e-mail: [email protected]
1. Introduction
“Fractals” were introduced by Mandelbrot et al. 1 ,
being a non-Euclidean geometry theory used to describe the irregularity in nature. Fractal analysis has been used for the study of distributions and microstructural changes of systems with discontinuities, mainly through the use of the fractal dimension (Df). This parameter has demonstrated to be a very important tool to analyze the microstructure of different materials including ceramics, polymers and composites 2-4. There are different ways to deine fractals:
by dimension (e.g. by using the box-counting method), or by distribution (e.g. by a log-log frequency histogram of a certain feature). The fractal property characterized by Df using box counting method is obtained from:
( )
lim log / log
f 0
D N
δ− δ δ
= (1)
where δ is the magniication factor or scale (corresponding to the inverse of the grid size l) and N(δ) is the number of self-similar parts under the ixed magniication factor.
Eq. (1) indicates that the fractal dimension is determined by plotting N(δ) against δ in a log-log scale.
In the case of porous systems, Df is used in order to determine the distribution of the pores, comparing the quantity of large pores (present in low proportions) with the smaller pores, which are much more abundant 5. These
distributions are signiicantly different from the central distributions due to the fact that the maximum shifts to the left, corresponding to the pores with the lowest sizes. Df has been also used for the analysis of not porous phases in ceramic materials, determining the modiications in the morphology originated by different phenomena, as the work of Perugini and Poli 2 for tourmaline inclusions in minerals.
A number of papers have used fractal approaches to study different metallic foams, for example using the “Sierpinski carpet” 6. Other works have also used the fractal analysis for
the study of the microstructure in Al alloys, including heat treatments and their relation with the mechanical properties 7,8.
Nevertheless, there is no a single manuscript reported in the literature that analyzes second phases evolution using Df, depending on heat treatment time or temperature. In the case
Fractal analysis of the heat treatment response for multiphase Al alloys
Ismeli Alfonsoa * , Gonzalo Gonzálezb, Gabriel Larab, Manuel Rodríguezc, Martha Domínguezd,
Mercedes Gabriela Télleze, José Eduardo Ledesmae, Claudio Aguilarf, Ignacio Alejandro Figueroab
a Instituto de Investigaciones en Materiales, Unidad Morelia, Universidad Nacional Autónoma de
México, Campus Morelia, Antigua Carretera a Pátzcuaro No. 8701, Col. Ex-Hacienda de San José de la Huerta, CP. 58190, Morelia, Michoacán, México
b Instituto de Investigaciones en Materiales, Universidad Nacional Autónoma de México,
Circuito Exterior SN, Ciudad Universitaria, Del Coyoacán, DF, CP 04510, México
c Centro de Investigaciones de Soldadura, Universidad Central Marta Abreu de Las Villas, Santa Clara,
Villa Clara, CP 50100, Cuba
d Facultad de Ciencias Químicas e Ingeniería, Universidad Autónoma del Estado de Morelos,
Av. Universidad 1001, Col. Chamilpa, CP 62209, Cuernavaca, Morelos, México e Facultad Ingeniería Química, Universidad Michoacana de San Nicolás de Hidalgo, Ediicio M,
Ciudad Universitaria, CP 58000, Morelia, Michoacán, México
f Departamento de Ingeniería Metalúrgica y Materiales, Universidad Técnica Federico Santa María,
Av. España 1680, Casilla 110-V, Valparaíso, Chile
Received: December 9, 2015; Revised: February 10, 2016; Accepted: March 11, 2016
The present work shows the fractal analysis for the microstructure of Al-6Si-3Cu-xMg (x = 0.59, 3.80 and 6.78 wt.%) alloys, solution heat treated at 480 °C for times ranging from 4 to 72 h. Microstructural changes were examined using Optical Microscopy (OM) and Scanning Electron Microscopy (SEM), and quantiied by measuring conventional characteristics of second phases. The fractal analysis of the microstructures was also carried out using fractal dimension (Df). Results shown important variations in the microstructure when Mg content is increased, being the eutectic Al-Si and Cu-rich phases the predominant phases for the alloys with low Mg content, while for higher Mg contents predominant phases were Mg2Si and Cu-rich phases. The analysis of Df showed that this parameter could be used in order to compare the microstructural solution response of the Al alloys. Besides, it was possible to correlate the fractal dimension with the shape factor of the second phases, mainly for the alloys with only one second phase remaining after heat treatment.
Fractal analysis of the heat treatment response for multiphase Al alloys
2016; 19(3) 629
of quaternary aluminum alloys second phases are much more abundant than for binary or ternary alloys, as the case of the Al-Si-Cu-Mg system, where the as cast structure includes the α-Al, Al-Si eutectic, Q (Al5Mg8Cu2Si6), Al2Cu and Mg2Si
phases, besides other complex intermetallic compounds 9-11.
These alloys are a common material for engine applications due to their good castability, excellent corrosion resistance and machinability, relatively good strength, and low speciic weight 12. Due to the complexity of the microstructure of
these alloys, they are excellent candidates for fractal studies. The 319 alloy is one of such alloys of this particular system. Its silicon content ranges from 5.5 to 6.5 (wt.%), and copper varies from 3.0 to 4.0 (wt.%). The addition of approximately 0.5 wt. % of magnesium improves the strain, hardenability and enhances the material strength by solid solution 12. There
are some reports that have study these alloys using much higher Mg contents, i.e., between 0.5 and 7.0 wt. % 9,13.
Nevertheless, no information have been found in the literature about the fractal analysis of the microstructure produced in these alloys, nor in the as cast condition and after heat treatment. The most applied heat treatment for this alloy is a solution treatment followed by an age-hardening, as this is required for the precipitation of the hardening constituents (T6 treatment). Solution heat treatment (T5 treatment) is particularly suitable for alloys with high magnesium content, fact that has lead to investigate the effect of Mg at higher contents than those reported 9,13. Prior to the study
of the precipitation hardening process, it is necessary to examine the solution stage of the heat treatment. There are some works about the characterization of the T5 treatment for Al-Si-Cu-Mg alloys 10,11,14, reporting different optimal
solution temperatures and times. These parameters inluence the content and distribution of the alloying elements in solid solution, also they can control the microstructure and hence the mechanical properties (the aspect ratio of the particles decreases, while the size and spacing between particles increase, obtaining a higher ductility 15). Decomposition of
the phases, fragmentation, spheroidization and coarsening are some of the observed changes. Then, the morphology evolution of the second phases is a very important characteristic to be determined, and it is convenient to have a parameter for describing these changes, being the equivalent diameter and the shape factor among the most used 16. The equivalent
diameter (De) is a parameter related to the particle size. This parameter is deined as the diameter of a circle with equivalent area 16, and is given by Equation 2 where A
p is the particle area and n the number of measured particles:
/ 1 2 n pi e i 1 4 A 1 D
n = π
=
∑ (2)
Otherwise, the shape factor (F) is a dimensionless parameter deined in Equation 3, where Pp is the perimeter and n the number of measured particles. A perfect circle will have a shape factor of 1, while the shape factor of a line will approach to zero.
n pi 2
i 1 pi
4 A 1 F n P π = =
∑ (3)
These parameters can be determined by means of image analysis of the micrographies obtained using the different characterization techniques, e.g. OM and SEM. The accuracy of the determination of not only F and De but also Df by image analysis depends on the sample preparation, the characterization technique and the method for image analysis. Recently, with the rapid development of computer science and image processing techniques, more and more microstructure information was quantiied and extracted from images. Several methods and software have been developed to quantify microstructures by image processing, as the used by Liu et al. 17. These methods are
mainly based on the identiication of isolated regions in a binary image. The key issue of the technology is how to segment the image, so that black pixels represent second phases in the binary image. However, there are a number of issues with the corresponding image processing technologies and measurement methods, which inluence the accuracy of the obtained results.
As mentioned above, no work has been found that uses Df for the study of the microstructure after different heat treatments for Al alloys, or comparing this parameter with F or De. The magnitude of Df is a measure of a geometry complexity: larger the dimension, the more heterogeneous and complex the fractal object is. Therefore, a direct correlation should exist between these parameters. The magnitude of Df is very easy to measure using the box-counting method, being a global analysis of the whole micrography. That is why the main objective of the present paper is to examine, using Df, the modiications of the microstructure for three Al-Si-Cu-Mg alloys with different Al-Si-Cu-Mg contents. These microstructural modiications will be examined both in the as cast conditions and after being heat treated at different times, comparing the fractal results (Df) to the obtained ones using conventional image analysis. Keeping this purpose in mind, OM and SEM were carried out on the alloys in the as-cast condition and after T5 heat treatments, in order to obtain images of the microstructures that could result under the different experimental conditions, proposed in this work.
2. Experimental
Three experimental Al-Si-Cu-xMg alloys were obtained, using a 356 Al–8.5Si–0.3 Mg (wt.-%) alloy ingot as raw material. Then, Cu (>99.99% purity) and Mg (>99.95% purity) at different proportions of were added in order to prepare the alloys, with resulting chemical compositions shown in Table 1. Castings were carried out using graphite crucibles in a Leybold-Heraeus induction furnace under a controlled Ar atmosphere.
Table 1. Chemical composition (in wt.-%) of the experimental alloys.
Alloy Code Si Cu Mg Fe Mn Zn Ti Al
MG1 6.40 3.02 0.59 0.34 0.09 0.04 0.14 Balance
MG4 6.31 3.03 3.80 0.32 0.08 0.03 0.13 Balance
The experimentally produced alloys in the as-cast condition were polished using standard metallographic techniques and characterized by OM and SEM, using respectively a Nikon EPIPHOT 300 optical microscope, and a JEOL JSM 7600F Scanning Electron Microscope operated at 20 kV, with a BRUKER XFlash6/30, with an energy dispersive X-ray spectroscopy (EDX) attached to the microscope. The alloys were also analyzed by X-ray diffraction (XRD), using a Siemens 400 X-ray diffractometer, with CuKα radiation at 30 kV and 25 mA. Cubic-shaped samples of 1.0 × 1.0 × 1.0 cm were sectioned from each alloy ingot and solution heat treated at 480 °C in a forced-air furnace at solution times of 4, 8, 12, 20, 30, 48 and 72 h. To ensure repetitive and accurate results 3 samples were analyzed for each condition. Then, the samples were quenched in hot water (60 °C), polished, and examined using OM to observe the microstructural changes. For a better statistical analysis 5 images were obtained from different zones for each sample. Care was taken during sample preparation to obtain accurate results in the image analysis stage, being sure to get surfaces without artifacts (e.g. lines or pores from the polishing process) that could lead to obtain signiicant errors in the measurements, mainly of Df. The microstructure captured in the images was analyzed through the pixels intensity. As irst step, the obtained gray level images were transformed to binary images. For the optically taken images, the second phases are clearly distinguished from the matrix, being darker, and can be simply discriminated by their different gray scale levels. The same image capturing conditions were used to obtain a series of images having the same characteristics, i.e. color, brightness, magniication, etc. An effective segmentation method used to analyze the second phases in these images is the global thresholding method, described in reference
17. There, the gray-level image is converted into a binary
image by selecting an appropriate gray-level threshold in order to separate second phases from the background. In the present work, this was carefully taken to avoid the arbitrary threshold of the method, which inluences the binary image, and consequently changes the selected areas. The main problem was to distinguish between α-Al matrix and second phases. The method used in order to decrease this error is based on a gray scale value comparison, using a reference sample (only α-Al) and adjusting the threshold level to a certain gray scale value 18. ImageJ software was
used for image process and analysis, and for De, F and Df determinations. De and F were determined from Equations (2) and (3), respectively, using the areas and perimeters of the second phases, measured by ImageJ 19. Whilst, D
f were determined using the box-counting tool that ImageJ has. In order to remain the same conditions for the determination of these parameters, in each micrography it was used the same treated binary image, according to the already mentioned thresholding method. The repetitiveness of the determinations for different micrographies was possible by adjusting to a certain gray scale during thresholdings.
3. Results and discussion
Fig. 1 a-c shows the optical micrographies of the as-cast microstructure for the experimentally produced alloys. It is important to note the signiicant modiications obtained
for the microstructures originated by the increase in Mg content. For the MG1 alloy, the presence of a dark ibrous silicon eutectic as the predominant phase and Al2Cu phase as the main Cu-rich phase, can be observed. For this alloy Q phase (Al5Mg8Cu2Si6) in low proportions was also observed. For the MG4 and MG7 alloys, the microstructures showed a signiicant presence of Q phase instead of Al2Cu. For the
MG4 alloy (Fig. 1b), it is observed that the other predominant second phase is the eutectic Al-Si, while for the MG7 alloy is Mg2Si phase (Fig. 1c). These microstructures and the phases obtained were already analyzed and reported in detail in a previous work [9] using Scanning Electron Microscopy (SEM) and X-ray diffraction (XRD) techniques. It is worth mentioning that this work is mainly focused on the analysis of the global microstructure but not on individual phases, nevertheless, these phases will be further analyzed here. Df determinations by the box-counting method using log-log graphs are also observed in Fig. 1a-c, revealing that Df values increased with the increment in the Mg content, being 1.57, 1.66 and 1.70 for the alloys with 0.59, 3.80 and 6.78 wt.-% of Mg, respectively. This is an expected result due to the fact that the higher complexity of the microstructure for the MG7 alloy is clearly observed. On this basis, the increment in the magnitude of Df when Mg is added could be originated from the fact that the predominant phases have different features. Fig. 2a shows the SEM analysis of the alloy MG7, while Fig. 2b shows the XRD analysis, and Figs. 2c to 2f shows the EDX of the second phases observed in Fig. 2a. This corroborates the chemical composition of the phases, also, observed in Fig. 1. Please note that this alloy was selected because it has all the identiied phases. Due to the light grey scale of the Cu-rich phases it is dificult to differentiate Al2Cu and Q.
Fractal analysis of the heat treatment response for multiphase Al alloys
2016; 19(3) 631
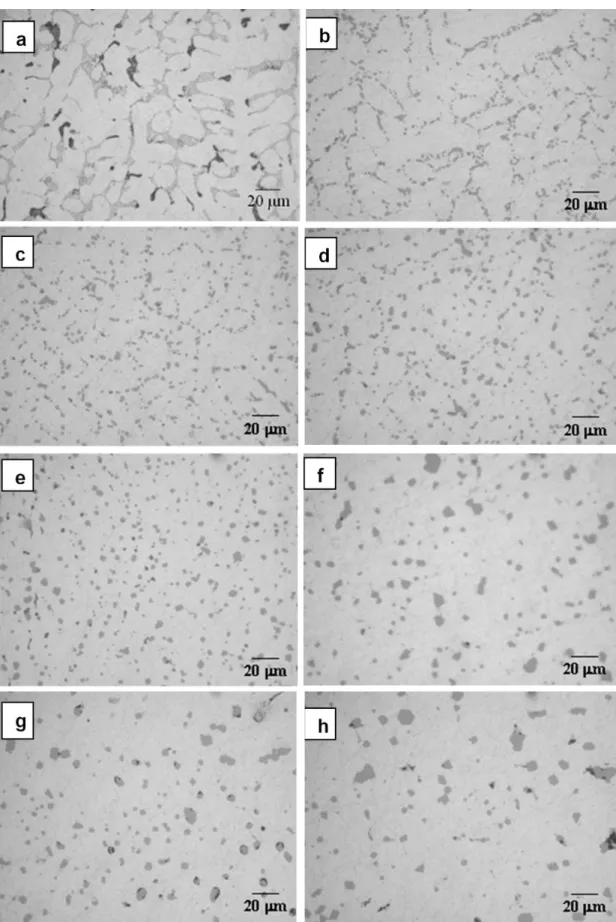
Fig. 4a–h shows the microstructural evolution in the alloy MG4, solution heat-treated at 480 °C, for solution times between 4 and 72 h. The observed behavior is similar to that obtained for the MG1 alloy, as for the specimens treated during 4 h (Fig. 4b), the structure of the second phases is also similar to the one observed in the as–cast condition (Fig. 4a), with the second phases already fragmented in smaller particles. For this alloy almost all the remaining second phases is Q instead of eutectic Al-Si, although particles of this eutectic are even observed at 72 h (Fig. 4h). The Q and Al-Si phases undergoes fragmentation, spheroidization and coarsening, similar to the process observed for the alloy MG1, with the important difference that the quantity of remaining second phases is clearly higher than for the alloy MG1. Besides, Q
particles are more markedly rounded until 30 h (see Fig. 4f), while for the alloy MG1 particles have this characteristic for times as short as 4 h, fact that will be further analyzed using F.
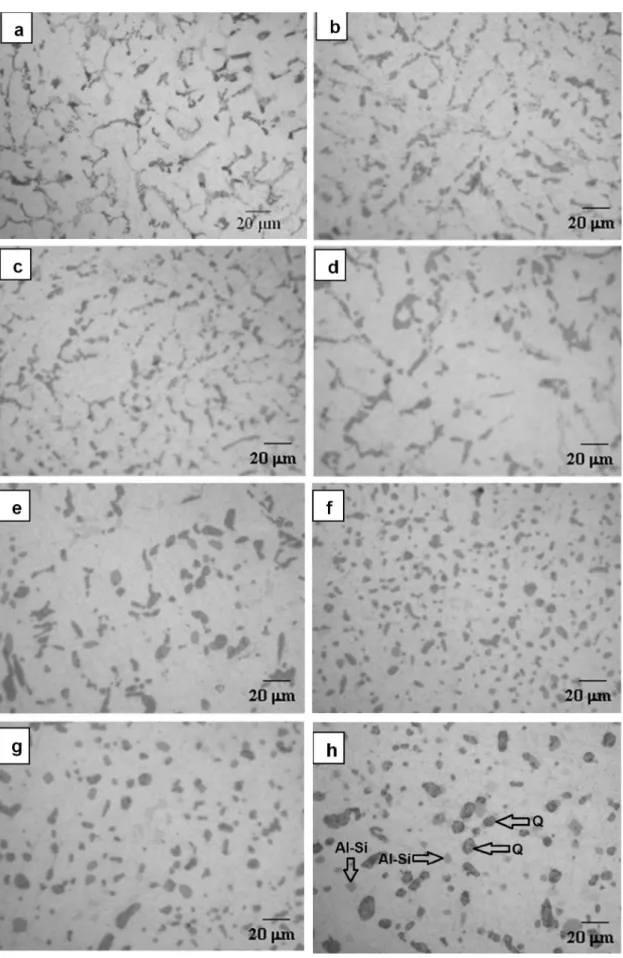
Fig. 5a–h shows the microstructural evolution in the MG7 alloy solution heat treated at 480 °C, for solution times between 4 and 72 h. The observed behavior is similar to the obtained for the MG1 and MG4 alloys, with the second phases already fragmented into smaller particles, for the specimens treated during 4 h (Fig. 5b), and completely different to the structure of the second phases observed in the as–cast condition (Fig. 5a). For this alloy the remaining second phases are Q and Mg2Si. This phases also showed
phases is clearly higher than for the alloys MG1 and MG4. Besides, modiications for these second phases (Q and Mg2Si)
occurred at longer solution times. Theoretical considerations indicate that ibrous eutectic phases are susceptible to changes in shape, while for plate-like phases interfacial instabilities cannot readily occur and hence the structure is more resistant to fragmentation and spheroidization 20.
Figs. 3 to 5 were processed using ImageJ in order to obtain De, F and Df. An example of the process can be observed in Fig. 6a-c for the MG7 alloy, heat treated during 72 h. Here, the optical micrography (Fig. 6a) is converted to a processed image were second phases are clearly separated from α-Al matrix (Fig. 6b). The Mg2Si phase is observed as black particles, while Q phase is shown as light grey particles. Fig. 6c shows the image used for the analysis of the fractal dimension of the second phases (in black). As already mentioned, the problem of distinguishing between different phases with similar gray scales was minimized adjusting the threshold level to a certain reference gray scale value.
Once the images observed in Figs. 3a-h, 4a-h and 5a-h were analyzed and processed; the analysis of De, F and Df can be presented. First, the average equivalent diameters (De) and shape factors (F) are observed in Figs. 7a and 7b, respectively. It is important to remember that main second phase particles are Al-Si eutectic for the MG1 alloy, Q and
Al-Si for the MG4, and Mg2Si and Q for MG7. Due to the aforementioned fragmentation and coarsening processes, De increases for all the investigated alloys (Fig. 7a). For the MG1 alloy, due to the Al-Si particles, De increases from 2.0 μm at 4 h to 6.2 μm at 72 h. For the MG4 alloy particles, the magnitude of the parameter, De, increases from 12.0 μm at 4 h to 20 μm at 72 h, while for the MG7 alloy, this parameter increases from 2.5 μm to 17 μm. The behavior of the shape factor observed in Fig. 7b shows the spheroidization of all the second phases when the solution time is increased. The Al-Si phase shows spheroidization levels near to 0.5, with solution times as short as 4 h (MG1 alloy), while for Q phase (MG4 alloy) the maximum shape factor is lower than 0.4. The combination of Q and Mg2Si (MG7 alloy) reached
Fractal analysis of the heat treatment response for multiphase Al alloys
2016; 19(3) 633
Fractal analysis of the heat treatment response for multiphase Al alloys
2016; 19(3) 635
Figure 6. (a) Optical micrograph of the alloy with 6.78 Mg wt.-% solution heat treated during 72 h, and the same image processed using ImageJ for the analysis of De and F (b); and Df (c).
Fractal analysis of the heat treatment response for multiphase Al alloys
2016; 19(3) 637
the three alloys, the MG1 alloy presented the lowest values of Df due to the presence of the Al-Si phase, which can be easily dissolved. The MG7 alloy has intermediate Df values, due to the presence of Q and Mg2Si phases, being
more complex the microstructure than for the alloy MG1, which only has Al-Si particles. Q phase is more dificult to dissolve and, therefore, to modify its shape, as can be observed in Fig. 5h. In this micrography Q phase particles still have elliptical shapes, while Mg2Si particles are more rounded, similar to the shape of Al-Si particles for the alloy MG1. On the other hand, MG4 alloy presented the highest Df values, attributed not only to the fact that the predominant phase for this alloy is Q, which has elliptical shape, but also to their bigger sizes compared to the Q particles present in the MG7 alloy. These results show that maxima Df values correspond to maxima De and minima F (for alloy MG4), while the contrary behavior was found for alloy MG1: minima Df values correspond to minima De and maxima F. Summarizing, Df ~ De and Df ~ 1/F. This is an important result, because demonstrates that Df could be used in order to compare microstructures of different heat treated Al alloys. E.g.. higher comparative Df means that an speciic alloy has a more complex structure, with second phases of a higher size and shapes far from spheres. Then, this alloy with high Df values is less desired to be solution heat treated because second phases do not dissolve very well, while alloys with low Df values are optimum to be heat treated. On the other hand, for a particular alloy it is dificult to relate Df and De, as De does not presented important inlection points in its behavior but just a signiicant increase with solution time. Otherwise, Df and F behaviors have inlections, being possible to correlate them, as will be further analyzed.
In order to analyze the relationship between Df and F, these parameters were plotted for each alloy. Fig. 8a-c shows the behavior of Df vs F for the experimentally produced alloys. A polynomial correlation was observed for the alloy MG1 (Fig. 8a), with high R2 value (R2 = 0.93), and F
having a maximum for medium values of Df. This behavior agreed well with the observed in Figs. 7b and 7c, where the inlection points were obtained at 8-12 h. For the alloys MG4 and MG7 (Figs. 8b and 8c, respectively) the behaviors were different, showing lower values for R2 , demonstrating that
the relationship between Df and F is not good, as it was for the alloy with lower Mg content. This fact could be related to much complex microstructures, and phases more dificult to dissolve and to being modiied. These results show that a correlation between Df and F could be an important tool in this analysis, mainly for cases where the phases are more sensible to the solubilization process. For the alloy with lower Mg content, almost all the remaining second phase after heat treatment was eutectic Al-Si, while for the alloys with higher Mg contents remained two second phases (Q + Al-Si for the alloy MG4; and Q + Mg2Si for
the alloy MG7). The presence of two different phases after heat treatment, which have different shape factors and sizes, led to lower correlations with Df. In the particular case of the alloys where only one second phase remains after heat treatment, the use of these correlations could be possible to
Figure 8. Relationship between the fractal dimension and the shape factor, for the alloys: (a) MG1, (b) MG4, and (c) MG7.
4. Conclusions
In this work, the microstructural changes for three heat-treated experimentally obtained aluminum alloys were measured using conventional and fractal image analyses. From this, the following conclusions can be highlighted:
1. The increase in the Mg content caused important microstructural modiications: for the alloy with medium Mg content, Q phase formed as the predominant phase instead Al-Si eutectic. For the alloy with the highest Mg content Q and Mg2Si are
present as the predominant phases.
2. It was possible to establish a relation between microstructure and fractal dimension for the as-cast alloys. The highest fractal dimension was obtained for the alloy with the highest Mg content, corresponding to the most complex microstructure and the presence of different phases.
3. Solution heat treatments of 12 h at 480 ◦C were enough to obtain important degrees of dissolution and modiication of the phases in the alloys studied. 4. Fragmentation, spheroidization and coarsening
occurred for the second phases after the solution treatment. Solution time required for these processes to occur in Q phase was longer.
5. The equivalent diameter increased for all the heat treatment times, showing the tendency to spheroidization, while shape factor increased until
approximately 12 h, remaining almost constant for higher solution times.
6. The behavior of the fractal dimension for the solution heat-treated alloys presented minima for the three alloys after 4 h, followed by maxima at 8-12 h and subsequent stabilizations.
7. Fractal dimension was successfully used to compare the response to the solution heat treatment of the experimental alloys, being desired low values of this parameter.
8. Important correlations were obtained between fractal dimension and shape factor, mainly in cases where only one second phase remains after heat treatment. This result leads to conclude that fractal dimension can be used as an important tool for determining microstructural modiications in heat-treated aluminum alloys.
9. For multiphase heat-treated aluminum alloys could be important the determination of the fractal dimension of not only the whole microstructure but separating the analysis of the remaining second phases after heat treatment.
Acknowledgements
The authors would like to acknowledge the inancial support from SEP–CONACYT 178289 and UNAM PAPIIT IN117316 for funding the project.
References
1. Mandelbrot BB, Passoja DE, Paullay AJ. Fractal character of fracture surface of metals. Nature. 1984;308:721-722.
2. Perugini D, Poli G. Tourmaline nodules from Capo Bianco aplite (Elba Island, Italy): an example of diffusion limited aggregation growth in a magmatic system. Contributions to Mineralogy and Petrology. 2007;153(5):493-508. http://dx.doi. org/10.1007/s00410-006-0167-3
3. Thomazini D, Gelfuso MV, Altafim RA. Hydrophobicity classification of polymeric materials based on fractal dimension.
Materials Research. 2008;11(4):415-419. http://dx.doi. org/10.1590/S1516-14392008000400006
4. Dos Santos SF, Rodrigues JA. Correlation between fracture toughness, work of fracture and fractal dimensions of Alumina-mullite-zirconia composites. Materials Research. 2003;6(2): 219-226. http://dx.doi.org/10.1590/S1516-14392003000200017
5. Perrier E, Mullon K, Rieu M. Computer construction of fractal soil structures: Simulation of their hydraulic and shrinkage properties. Water Resources Research. 1995;31:2927-2943. http://dx.doi.org/10.1029/95WR02214
6. Song HW, He QJ. Mechanics of metallic foams: a fractal approach. In: 2nd International Conference on Heterogeneous Material Mechanics. Advances in Heterogeneous Material Mechanics, 2008 June 3-8, Huangshan, China. p. 870-874.
7. Durowoju MO, Akintan AL. Variation between fractal geometry and mechanical properties of Al alloys under different heat treatments. International Journal of Advanced Science and Technology. 2013;3(4):38-44.
8. Haitao J, Yalin L, Weichao H, Xiaoli L, Miaoquan L. Microstructural evolution and mechanical properties of the semisolid Al–4Cu– Mg alloy. Materials Characterization. 2013;51(1):1-10. http:// dx.doi.org/10.1016/S1044-5803(03)00128-1
9. Alfonso I, Maldonado C, Gonzalez G, Bedolla A. Effect of Mg content and solution treatment on the microstructure of Al-Si-Cu-Mg alloys. Journal of Materials Science. 2006; 41(7):1945-1952. http://dx.doi.org/10.1007/s10853-006-4494-y
10. Samuel FH, Samuel AM, Ouellet P, Doty HW. Effect of Mg and Sr additions on the formation of intermetallics in Al-6 wt pct Si-3.5 wt pct Cu-(0.45) to (0.8) wt pct Fe 319-type alloys.
Metallurgical and Materials Transactions A. 1998;29(12):2871-2884. http://dx.doi.org/10.1007/s11661-998-0194-y 11. Du K, Zhu Q, Li D, Zhang F. Study of formation mechanism of
incipient melting in thixo-cast Al–Si–Cu–Mg alloys. Materials Characterization. 2015;106:134–140. http://dx.doi.org/10.1016/j. matchar.2015.05.035
12. Hatch JE. Aluminium, Properties and Physical Metallurgy. Ohio, USA: American Society for Metals; 1993.
13. Masakazu H, Shinji Y. Aluminum alloy of excellent
machinability and manufacturing method thereof. Patent
US6059902. Japan: Kobe Steel; 2000.
14. Ouellet P, Samuel FH. Effect of Mg on the ageing behaviour of Al-Si-Cu 319 type aluminium casting alloys. Journal of Materials Science. 1999;34(19):4671-4697.
Fractal analysis of the heat treatment response for multiphase Al alloys
2016; 19(3) 639
alloys. Materials Letters. 2003;57(24):4083-4087. http://dx.doi. org/10.1016/S0167-577X(03)00270-2
16. Ogris E, Luchinger H, Uggowitzer PJ. Silicon spheroidization treatment of thixoformed Al-Si-Mg alloys. In: 8th International Conference. Aluminium alloys 2002, 2002 July 2-5. Cambridge, UK. p. 149-154. (Materials Science Forum)
17. Liu C, Shi B, Zhou J, Tang, C. Quantification and characterization of microporosity by image processing, geometric measurement and statistical methods: Application on SEM images of clay materials. Applied Clay Science. 2011;54(1):97-106. http:// dx.doi.org/10.1016/j.clay.2011.07.022
18. Stoessel R, Guenther T, Dierig T, Schladitz K, Godehardt M, Kessling PM, Fuchs T. μ-Computed tomography for micro-structure characterization of carbon fiber reinforced plastic (CFRP). In: Thompson DO, Dale CE, editors. AIP Conference Proceedings: Review of progress in quantitative nondestructive evaluation; 2010 Jul 18-23; San Diego, United States. United States: American Institute of Physics, 2011. p. 461-468. http:// dx.doi.org/10.1063/1.3591888
19. Rasband WS. ImageJ. [online]. Bethesda (MD): U. S. National Institutes of Health, 1997-2015.