Abstract
The seismic performance of RC columns can considerably be im-proved through the use of continuous spiral reinforcement in terms of ductility and energy dissipation capacity. Since the beam-column connections were subjected to brittle failure after earth-quakes, the simultaneous application of this method in both beams and columns could greatly improve the seismic behaviour of such connections. In this investigation, a new proposed detail for beam to column connection introduced as twisted ”pp”si“g recta“gular spiral was i“vestigated b”th experime“tally a“d “umerically a“d its seismic performance was verified through comparison with normal rectangular spiral and conventional shear reinforcement systems. In this research, three full scale beam to column connec-tions were first designed according to Eurocode (EC8-04) for Me-dium ductility classes and then tested by quasi-static cyclic load-ing suggested by ACI Buildload-ing Code (ACI 318-08). Finally, nu-merical methods were hired to validate the experimental results. The results indicated that the ultimate lateral resistance, ductility and energy dissipation capacity of the connection could be im-proved using the new proposed connection.
Keywords
Reinforced concrete; rectangular spiral reinforcement; ductility classes; beam-column connection.
Seismic performance of ductility classes medium RC beam-column
connections with continuous rectangular spiral transverse
reinforcements
1 INTRODUCTION
It has been proven that application of continuous spiral reinforcement in circular cross section com-ponents including beams and columns of RC structures could lead to improved strength, ductility and energy dissipation capacity of these structural members (Park, 1975; Saatcioglu, 1992; Sheik, 1993). The first application of spiral reinforcement as the shear reinforcement to improve the axial
Mohammadamin Azimia* Azlan Bin Adnanb Mahmood Md. Tahirc
Abdul Rahman Bin Mohd Samd Sk Muiz Bin Sk Abd Razake
Faculty of Civil Engineering, UTM Con-struction Research Centre (CRC), Universiti Teknologi Malaysia (UTM), Johor, Johor Bahru, 81300, Malaysia. b[email protected]
c[email protected] d[email protected] e[email protected]
Corresponding author:
http://dx.doi.org/10.1590/1679-78251387
Latin A m erican Journal of Solids and Structures 12 (2015) 787-807
behaviour of reinforced columns was presented by Considere in 1903 (Considere, 1903). Other scien-tists have conducted similar experiments to investigate the use of continuous spiral shear reinforce-ment instead of conventional stirrups, hoops and etc. (Mander et al., 1988; Saatcioglu and Grira, 1999). Also, a new technique for application of two opposing spiral (cross spirals) was introduced by Hindi in 2004 (Hindi, 2004) where no reduction in strength or ductility in columns occurred due to the increased pitch distance of spiral reinforcement. The widespread incorporation of rectangular shape cross sections in RC structures has led to increased application of continuous rectangular reinforcement in RC elements over the past few years. The first application of rectangular spiral reinforcement in RC beams was carried out by Karayannis et al. (Karayannis et al., 2005a) in an experimental study in 2005. At present, the studies on effectiveness of rectangular spiral shear rein-forcement on RC structures have been accelerated (Karayannis and Sirkelis, 2005a; Karayannis et al., 2005b; Tsonos, 2007; Kakaletsis et al., 2011). In 2011, an experiment was conducted by Yang et al. (Yang et al., 2011) on shear behaviour of RC T-beams reinforced by spiral-type wire ropes as internal shear reinforcements. The most outstanding finding of their project was higher maximum load bearing capacity, energy absorption and the ductility compared to those of conventional stir-rup shear reinforcement. Furthermore, the seismic performance of the structural components in RC elements is improved using the rectangular continuous spiral reinforcement (Karayannis and Sirkelis, 2005b; Azimi et al., 2014). Whenever the ductility and seismic resistance of the structure is taken into account, continuous spiral reinforcement must be incorporated instead of conventional shear resistant ones based on ACI 318-08 recommendations (ACI-Committee318, 2008). The great amount of studies conducted on continuous spiral reinforcement in RC elements indicates its popu-larity among scientists; nevertheless, no significant studies have been done regarding the application of rectangular spiral reinforcement as shear reinforcement in RC elements.
Latin A m erican Journal of Solids and Structures 12 (2015) 787-807 the Laboratory of Structures and Materials, Universiti Teknologi Malaysia (UTM). Besides, ad-vanced rectangular spiral reinforcement, also referred to as twisted opposing rectangular spiral, which was composed of double rectangular spiral reinforcements with a pitch distance twice the pitch distance of spiral reinforcement was tested in this study. It is predicted this proposed connec-tion demonstrate adequate performance during cyclic loading with satisfactory energy dissipaconnec-tion capacity due to two cross legs in each sections. This is good to mention that this connection possess all advantages of continuous spiral reinforcement whereas its total weight was same. The main ob-jective of this research was to investigate the cyclic behaviour of new scheme in comparison with conventional shear reinforcement and single continuous spiral reinforcement. In this study the main objective is to investigate on the use of continues link in reinforced concrete connections as shear reinforcement in two different ways, namely Single Rectangular Spiral Continues Link Shear Resis-tant System and Double Twisted Opposing Rectangular Spiral Continues Link Shear ResisResis-tant System for ductility classes medium (DCM). The experimental work and finite element study were subjected to simulated earthquake loading (quasi-static cyclic loading). Three full scale beam-column connections were designed according to Eurocode (EC8-04) (CEN-EC8, 2004) for medium ductility class connections and then, were subjected to quasi-static cyclic loading prescribed by ACI Building Code (ACI 318-08). Eventually, the FE Software ANSYS was used to validate the experi-mental results of the tests.
2 TEST PROGRAM
2.1 Analytical Predictions
The basis of the design for the reinforced concrete beams would be their flexural and shear strength. When the design of a reinforced concrete member is intended, flexure is the first item to be consid-ered to determine the section size and arrangement of reinforcement along with provision of re-quired resistance for moments. On the other hand, the fundamental function in successful formation of plastic hinges in beams instead of columns would be the beam-column relationship. The next step would be the design of beams for shear. Since shear failure occurs without a prior warning, the shear strength for every structural member must exceed its flexural strength. Changes in shear fail-ure mechanisms are a function of the shear reinforcement properties of the member, type of loading and cross-sectional dimensions of the member. Generally, initiation of inclined shear cracks occurs
at the middle height of the beam near supports at almost 45◦ and continues towards the
compres-sion zone. Incorporation of anchored reinforcement, that intersects these diagonal cracks, provides resistance against the shear forces near supports. In practice, three forms of shear reinforcement are provided in real projects: stirrups, inclined bent-up bars and a combination of a system of stirrups and bent-up bars. One big advantage of the rectangular spiral reinforcement system is the intersec-tion of its angle with the diagonal shear cracks (Figure 1). The shear design of structural members is achieved by the following equation (ACI 318-08):
n u
V V (1)
where,
u
Latin A m erican Journal of Solids and Structures 12 (2015) 787-807 = strength reduction factor (0.85 for shear)
n
V = nominal shear strength computed by:
n c s
V V V (2)
where,
C
V = nominal shear strength provided by concrete
S
V = nominal shear strength provided by shear reinforcement for inclined stirrups computed by:
sin cos
V y S
A f d V
S (3)
where,
V
A = total cross sectional area of web reinforcement within a distance S, for single loop stirrups,
2
V S
A A .
S
A = cross sectional area of the stirrup bar (mm2).
S = center to center spacing of shear reinforcement in a direction parallel to the longitudinal
rein-forcement (mm).
y
f = yield strength of web reinforcement steel.
(a) common closed (b) rectangular spiral reinforcement (c) twisted opposing rectangular spiral
Figure 1:Contribution of the spiral reinforcement on the shear capacity.
It can be concluded from the aforementioned equations that the shear resistance could be im-proved by the angle of shear reinforcement up to 1.41 times whenever the angle is 45◦. Further-more, close installation of stirrups at high-shear regions in conventional design would result in con-gestion near the supports of the reinforced concrete beams and hence, increased amount of time and money for installation process. This problem could be solved using rectangular spiral reinforcement to improve the flow of concrete in the molds once it is poured. The concept of rectangular spiral reinforcement pattern is illustrated in Figure 2.
2.2 Case Studies and Modelling Set Up
The case studies of this research involve three full-scale beam-column connections incorporating rectangular cross-sections subjected to earthquake loading, which was simulated by quasi-static cyclic loading. This study involved an investigation on the effectiveness of three shear transverse patterns as a key parameter in connection during seismic events which are as follows: i) common closed stirrups (DCM- CONVEN), ii) rectangular spiral reinforcement (DCM- SINGLE), and iii) twisted opposing rectangular spiral (DCM- DOUBLE). The design of the longitudinal reinforcement
S
S
S
H
Shear
Diagonal Crack
H
Shear
Diagonal Crack
H
Shear
Diagonal Crack F
F
F
V
V
V
90○
Ɵ 83.3○
Ɵ 76.7○ Ɵ
Latin A m erican Journal of Solids and Structures 12 (2015) 787-807 of all specimens was done according to Eurocode (EC8-04) Appendix A, Table A1, with specimens having the same dimensions, with a column length of 1200 mm and a beam length of 700mm. The
rebar φ6 was ch”se“ as the tra“sverse rei“f”rceme“t havi“g the same steel perce“tage i“ all spec
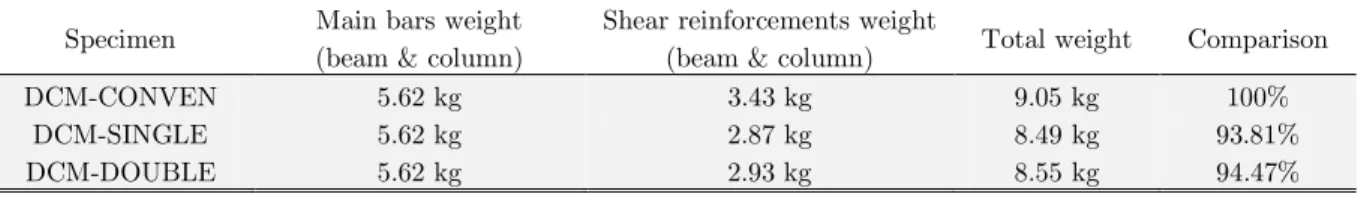
i-mens and with a distribution similar to the above mentioned patterns. Since all the parameters of all specimens are same and the only different is about shear reinforcing system, so the cost differ-ence is related to the steel weight for the material part. According to evaluation of all three speci-mens the weight of main bars in all connections are same and the results of shear reinforcement weight for specimens shown in Table 1 and Figure 3. In conventional connection there are two extra hooks in each stirrup for anchorage. These hooks are removed in both proposed continuous rectan-gular spiral shear reinforcing system. Accordingly, the steel weight in SINGLE and DCM-DOUBLE connections is less than DCM-CONVEN. However, steel weight in DCM-SINGLE and DCM-DOUBLE is almost similar. It believed that, installation time in proposed shear reinforcing system is less than conventional one due to the continuous accordion shape of proposed system. All these factors including steel weight, time and man power are reduced and can cause to cost reduc-tion. Besides, in order to isolate the medium ductility class multi-storey RC moment resisting frame, all the specimens were treated as exterior beam to column connections. The geometry and properties of the reinforcements used in this study are listed in Figure 4 and Table 2 respectively.
(a) (b)
Figure 2: Application of (a) Single and (b) Twisted opposing rectangular spiral reinforcement in RC elements.
Specimen Main bars weight (beam & column)
Shear reinforcements weight
(beam & column) Total weight Comparison
DCM-CONVEN 5.62 kg 3.43 kg 9.05 kg 100%
DCM-SINGLE 5.62 kg 2.87 kg 8.49 kg 93.81%
DCM-DOUBLE 5.62 kg 2.93 kg 8.55 kg 94.47%
Table 1:Reinforcement weight comparison for all specimens.
0 10 20 30 40 50 60 70 80 90 100
STEEL WEIGHT COMPARISON
DCM-CONVEN
DCM-SINGLE
DCM-DOUBLE
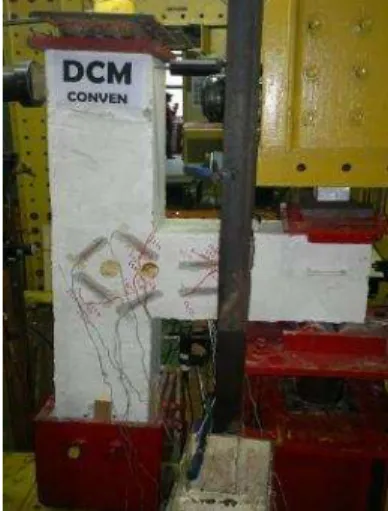
Latin A m erican Journal of Solids and Structures 12 (2015) 787-807 (a) DCM - CONVEN
(b) DCM - SINGLE
(c) DCM - DOUBLE
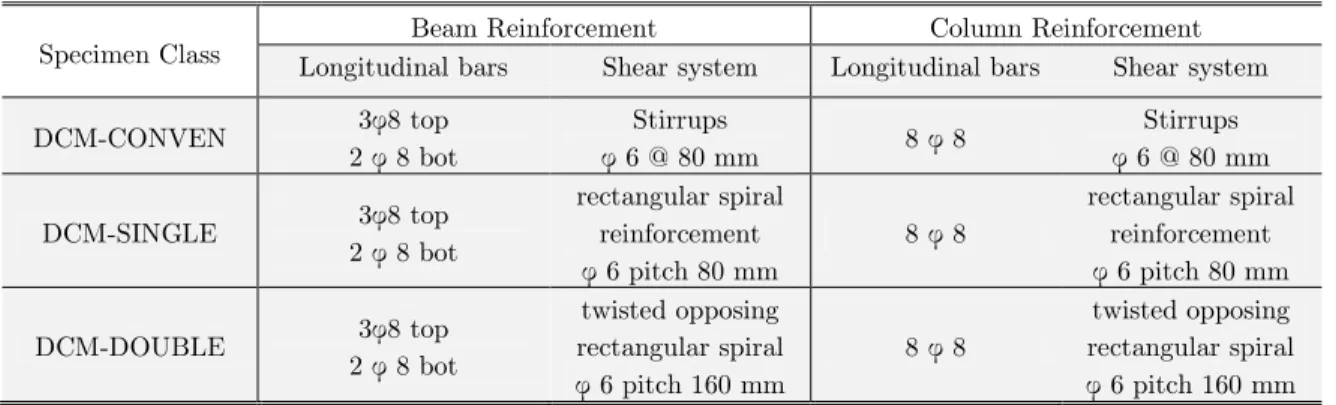
Latin A m erican Journal of Solids and Structures 12 (2015) 787-807 Specimen Class Longitudinal bars Beam Reinforcement Shear system Longitudinal bars Column Reinforcement Shear system
DCM-CONVEN 3φ8 t”p 2 φ 8 b”t
Stirrups
φ 6 @ 80 mm 8 φ 8
Stirrups φ 6 @ 80 mm
DCM-SINGLE 3φ8 t”p 2 φ 8 b”t
rectangular spiral reinforcement
φ 6 pitch 80 mm 8 φ 8
rectangular spiral reinforcement φ 6 pitch 80 mm
DCM-DOUBLE 3φ8 t”p 2 φ 8 b”t
twisted opposing rectangular spiral
φ 6 pitch 160 mm 8 φ 8
twisted opposing rectangular spiral φ 6 pitch 160 mm
Table 2: Reinforcement details of specimens.
A typical quasi static cyclic pattern and modelling setup was arranged for the tests conforming
t” C”mme“tary ”“ Accepta“ce Criteria f”r M”me“t Frames Based ”“ Structural Testi“g (ACI
T1.1R-01) . Moreover, Figure 5 highlights the deformation of the exterior beam to column test module. According to Figure 5, the initial position of the connection is shown by the broken lines considering its self-weight only. The module is pin supported at A and roller supported at D. The column is subjected to the cyclic force HCE through the pin at C for seismic assessment purposes and therefore, the specimen deforms accordingly as shown by the solid lines. The concept of drift
rati” is prese“ted by θ.
C
A
B D
h
HC
+
- Δ
Ɵ
Initial Position Final Position
Drift Ratio
Figure 5:Deformation of the exterior beam to column test module (ACI T1.1R-01) .
Latin A m erican Journal of Solids and Structures 12 (2015) 787-807
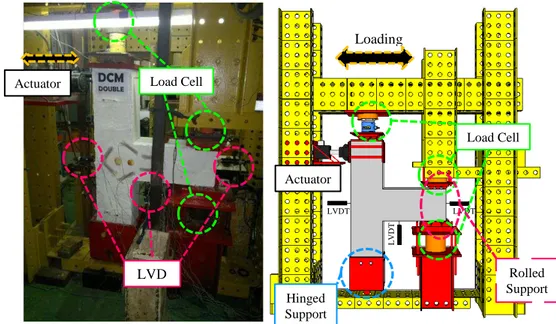
50-ton load cell. Figure 6 shows the modelling set up and testing instruments of the experimental portion of the study.
.
Actuator
Actuator Load Cell
Load Cell
LVD
Hinged Support
Rolled Support
L
V
D
T
LVDT LVDT
Loading
Figure 6: Real test setup view (left), schematic view (right).
2.3 Loading Protocol
The loading protocol used in this study was the Displacement Control Method followed by the
load-ing sequence suggested by C”mme“tary ”“ Accepta“ce Criteria f”r M”me“t Frames Based ”“
Structural Testi“g (ACI T1.1R-01) Provisions. A series of load steps and the number of cycles for
each one are given in the ACI Protocol (Figure 7). Each load step belongs to a total inter-storey drift angle. The load was incremented in a step by step manner while the data points were recorded and photographs were taken at regular intervals at the end of each load step. When the strength of the specimens reduced to 40 percent of the maximum strength, the load steps were halted.
-4 -3 -2 -1 0 1 2 3 4
Dr
ift R
ati
o ×
10
-2
Cycles
0.2 0.25 0.35 0.5 0.75 1.0
1.4 1.75
2.2 2.75
3.5
Latin A m erican Journal of Solids and Structures 12 (2015) 787-807 2.4 Materials Properties
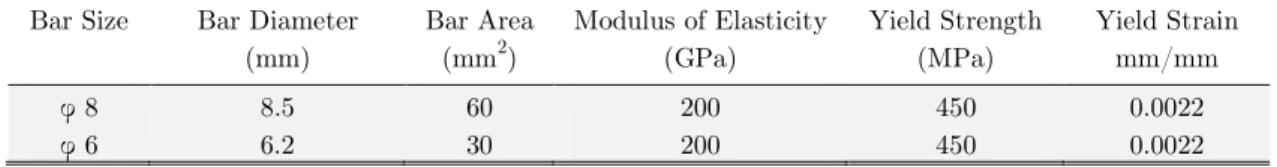
The casting and construction of all specimens included the use of normal weight and ready mixed concrete with a maximum aggregate size of 20 mm. The horizontal layout way from the side was chosen as the casting method of all specimens. Then, curing the specimens was conducted for seven days after casting in the laboratory environment. Ready mixed concrete was ordered for 28-day concrete compressive strength of 30 MPa. However, the standard cylinder test showed a compres-sive strength of 35 MPa. The yield strength and yield strain of the reinforcement bar incorporated in this research were 450 MPa and 0.0022 respectively based on the results of the Universal Test performed in Laboratory of Structures and Materials, Universiti Teknologi Malaysia (UTM) (Table 3).
Bar Size Bar Diameter (mm)
Bar Area (mm2)
Modulus of Elasticity (GPa)
Yield Strength (MPa)
Yield Strain mm/mm
φ 8 8.5 60 200 450 0.0022
φ 6 6.2 30 200 450 0.0022
Table 3:Mechanical properties of reinforcing bars.
2.5 Numerical Study Procedure
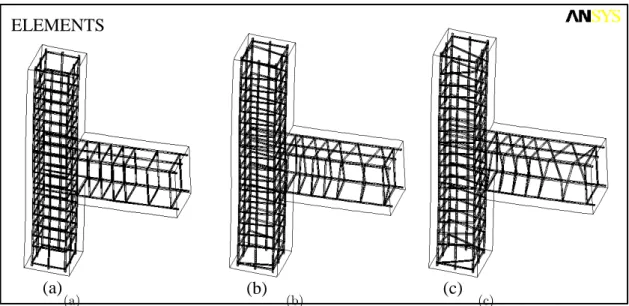
In order to perform the FEA stage of the research, the FE software ANSYS was applied to properly simulate the nonlinear behaviour of beam-column connections. The higher accuracy of the results obtained from three dimensional (3D) FEA compared to those of two dimensional (2D) ones con-vinced the authors to use the former. The following three techniques are being used in modelling the steel reinforcement in numerical studies (Park and Paulay, 1973; Willam and Warnke, 1975; Tavárez, 2001): i) discrete modelling, ii) embedded modelling and iii) smeared modelling (Figure 8). In this research, discrete modelling was hired to appropriately model the steel bars. In order for the constitutive behaviour of the reinforcements to be efficiently described, the isotropic strain harden-ing of von Mises yield criterion plus an associated flow rule were incorporated. The ANSYS options of "separate link 180 elements" were applied to model the bars. The modelling of reinforcement for
all the three specimens is demonstrated in Figure 9.
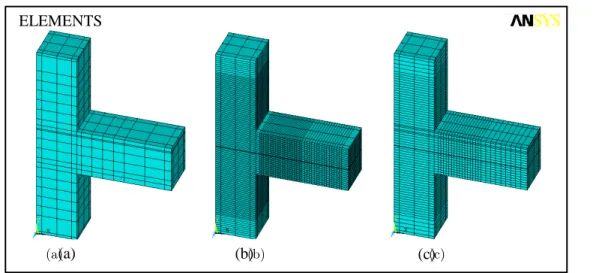
In order to model the concrete behaviour properly, the "Solid65" element plus linear isotropic and multi-linear isotropic material properties were used in FEA phase of the study. Hence, defini-tion of concrete failure was done through the use of the von Mises failure criterion with the multi- linear isotropic material (Willam and Warnke, 1975). Figure 10 indicates the concrete specimens modelled with ANSYS.
2.6 Acceptance criteria based on ACI 318-08
Acc”rdi“g t” the Buildi“g C”de Requireme“ts f”r Structural C”“crete ACI 318-08, the strong
inter-Latin A m erican Journal of Solids and Structures 12 (2015) 787-807
storey drift angle of at least 0.035 rad. The characteristics of the third complete cycle must satisfy the following requirements for cycling at drift ratio of 0.035 rad:
i)The peak force must be not less than 0.75 Emax.
ii)The relative energy dissipation ratio must be not less than 1/8.
where,
Emax = the maximum lateral resistance of the test specimen calculated from test results (forces or moments).
Figure 8: Reinforcement modelling techniques: (a) discrete, (a) embedded, (c) smeared (Tavárez 2001).
ELEMENTS
(a)
(b)
(c)
(a) (b) (c)
Figure 9:Definition of reinforcement bars with "Link180 Element" in ANSYS (a) DCM-CONVEN, (b) DCM-SINGLE, (c) DCM-DOUBLE.
CONCRETE ELEMENT CONCRETE ELEMENT
CONCRETE ELEMENT CONCRETE NODE
CONCRETE NODE
SMEARED PROPERTIES OF STEEL IN CONCRETE ELEMENTS
CONCRETE NODE
REINFORCEMENT NODE
COMPATIBLE DISPLACEMENTS BETWEEN CONCRETE AND REINFORCEMENTS SHARE NODE BETWEEN
CONCRETE AND REIN-FORCEMENT ELEMENTS
(a) (b)
Latin A m erican Journal of Solids and Structures 12 (2015) 787-807
ELEMENTS
(a) (b) (c)
(a) (b) (c)
Figure 10:Concrete element modelling with ANSYS using the element "Solid 65" for (a) DCM-CONVEN, (b) DCM-SINGLE, (c) DCM-DOUBLE.
3 TEST RESULTS AND DISCUSSIONS
The three following sections are included in the test results: i) hysteresis responses of the specimens, ii) energy dissipation capacity and iii) beam deflection and crack opening. A detailed discussion on the test results are given in the following paragraphs.
3.1 Hysteresis Responses
The fundamental parameter to investigate the seismic performance is the inter-storey drift angle is inter-storey drift angle. According to the data provided by direct observation, photographic docu-mentation and data logger, it was concluded that the monitoring of the crack initiation and propa-gation was performed in the same storey shear force in all specimens. Yet, a different performance was demonstrated by the specimens after this point. The following sections will discuss the effi-ciency of different transverse shear patterns.
3.1.1 Conventional Specimen
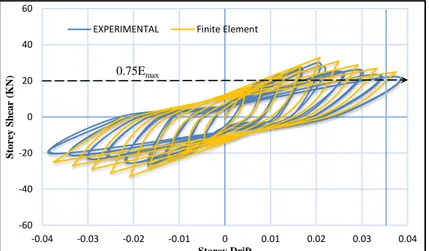
relation-Latin A m erican Journal of Solids and Structures 12 (2015) 787-807
ships between the storey shear force and the storey drift calculated by experimental tests and nu-merical studies are compared in Figure 11. The stress intensity results and the damaged state at the end of the seismic test for the DCM-CONVEN specimen are shown in Figure 12. Eventually, it was observed that there was a good correlation between the results of the numerical model and the ex-perimental test in the overall cyclic behaviour.
-60 -40 -20 0 20 40 60
-0.04 -0.03 -0.02 -0.01 0 0.01 0.02 0.03 0.04
S
to
re
y
S
h
ea
r
(K
N)
Storey Drift EXPERIMENTAL Finite Element
0.75Emax
Figure 11: An experimental and finite element hysteresis response comparison for the DCM-CONVEN specimen.
Figure 12:Stress intensity results and the damaged state at the end of the seismic test for the DCM-CONVEN specimen.
3.1.2 Rectangular and twisted opposing rectangular spiral reinforcement specimens
Due to the similarities observed in behaviour of the DCM-Single and DCM-double specimens, they are discussed in the same section. The first diagonal crack was initiated at an inter-storey drift ratio of 0.5%. The alternate load directions resulted in formation of an X-pattern by the diagonal cracks. Moreover, there was a rise in the size and number of the diagonal cracks in joint cores until the peak load of almost 45.7 kN at 3.39% drift ratio for DCM-single specimen and 53.1 kN at 3.4% drift ratio for specimen DCM-double were attained respectively. Despite the fact that no cracks were
Latin A m erican Journal of Solids and Structures 12 (2015) 787-807 observed in the beam after this cycle, the diagonal cracks continued to widen in the joint core fol-lowing by spalling of concrete at the center of the joint area. A wider area of the joint was affected by the extension of concrete spalling, which exposed the column longitudinal bars, at 3.8% drift.
The strai“ gauges p”siti”“ed ”“ steel bars rec”rded a 4800 με (micr”-strain) value relevant to the
3.5% top drift in the experimental test, which was an indication of strength degradation resulting from yielding of longitudinal bars. Conduction of the test continued until the 4% drift ratio where concrete spalling covered the entire joint area and extended into the beam above and below the joint. Both connection failures were categorized as ductile flexural failure. The wide hysteresis loops indicated large energy dissipation in bending mode. A reasonable correlation among the numerical and experimental results for both specimens is demonstrated in Figures 13 and 14. The experimen-tal failure mode and the equivalent strain distribution at the end of cyclic test are shown in Figures 15 and 16. Finally, Figure 17 indicates an experimental comparison between hysteresis performances of all specimens.
-60 -40 -20 0 20 40 60
-0.04 -0.03 -0.02 -0.01 0 0.01 0.02 0.03 0.04
S
to
re
y
S
h
ea
r
(K
N)
Storey Drift
EXPERIMENTAL Finite Element
0.75Emax
Figure 13: An experimental and finite element hysteresis response comparison for the DCM-SINGLE specimen.
-60 -40 -20 0 20 40 60
-0.04 -0.03 -0.02 -0.01 0 0.01 0.02 0.03 0.04
S
to
re
y
S
h
ea
r
(K
N)
Storey Drift
EXPERIMENTAL Finite Element 0.75Emax
Latin A m erican Journal of Solids and Structures 12 (2015) 787-807
Figure 15: Stress intensity results and the damaged state at the end of seismic test for the DCM-SINGLE speci-men.
Figure 16: Stress intensity results and the damaged state at the end of seismic test for the DCM-DOUBLE specimen.
-60 -40 -20 0 20 40 60
-0.04 -0.03 -0.02 -0.01 0 0.01 0.02 0.03 0.04
S
to
re
y
S
h
ea
r
(K
N)
Storey Drift
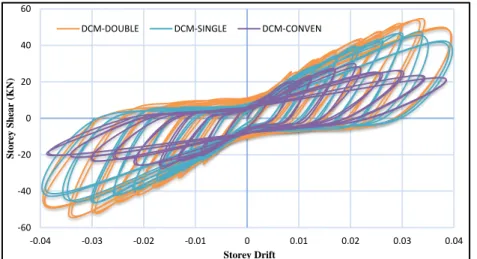
DCM-DOUBLE DCM-SINGLE DCM-CONVEN
Figure 17:An experimental comparison of hysteresis performance of all three specimens. Diagonal Cracks
X pattern Plastic Hinge
Diagonal Cracks
Plastic Hinge
Latin A m erican Journal of Solids and Structures 12 (2015) 787-807 3.2 Energy dissipation capacity and load-drift envelops
Energy dissipation capacity is believed to be the key parameter in resisting seismic loading. This study includes the determination of energy dissipation of connections in each group using the area enclosed by the lateral load-displacement loops. The energy dissipation capacities of all three con-nections are compared against each other in Figure 18. According to the graph, it is evident that a better performance in absorbing the cyclic energy was shown by the rectangular spiral reinforce-ment (DCM- SINGLE) and twisted opposing rectangular spiral (DCM- DOUBLE) compared to the common closed stirrups (DCM- CONVEN).
The envelope curves in RC frames are greatly affected by the shear deformation of beam-column connections. They reflect the nonlinear behaviour of the tested beam-column joints. Therefore, the envelop curves were drawn using the peak lateral resistance values determined at each level of drift and the corresponding drift ratios, Figure 19. It is inferred from the figure that larger drifts could be withstood by the DCM- SINGLE and DCM-DOUBLE specimens compared to that of the DCM- CONVEN specimen as a result of the impact of their special shear transverse patterns. Moreover, it is concluded that the peak lateral resistances of DCM- SINGLE and DCM-DOUBLE specimens are almost similar.
100
261
343
0 50 100 150 200 250 300 350
ENERG
Y
DISS
IP
IA
T
ION
(%
)
DCM CONVEN DCM SINGLE DCM DOUBLE
Figure 18:An energy dissipation capacity comparison for the DCM group.
-60 -40 -20 0 20 40 60
-0.04 -0.02 0 0.02 0.04
S
to
re
y
S
h
ea
r
(K
N)
Storey Drift
DCM-DOUBLE DCM-SINGLE DCM-CONVEN
Latin A m erican Journal of Solids and Structures 12 (2015) 787-807 3.3 Beam deflection and crack opening
This is proven fact that the overall deflection of the RC beams depends on their shear reinforce-ments characteristics. In this study higher deflections observed for the SINGLE and DCM-DOUBLE specimens due to their shear transverse pattern. Notice that deflection measurement was achieved by installation of a vertical LVDT at the bottom of the beams. On the contrary, minor deflections at the ultimate load plus a fairly ductile failure were reported for the DCM-CONEN specimen. The results indicate the fact that the deflections and modes of failure of the connections depend on the proper pattern and amount of shear reinforcement. The drift against deflection curves for all specimens are demonstrated in Figure 20.
Crack opening in RC members is usually accompanied by shear crack sliding along shear cracks leading to shear transfer by the aggregate interlock mechanism. The key factor in fracturing shear reinforcement mostly under cyclic loading would be the shear sliding, which is related to shear opening. Besides, it was concluded that the diagonal crack openings were greatly influenced by the angle between the shear reinforcement and shear cracks. Nevertheless, greater shear crack widths were detected in the beam with vertical stirrups. Figure 21 demonstrates the crack opening curves for all specimens tested in this study.
-6 -4 -2 0 2 4 6
-0.04 -0.03 -0.02 -0.01 0 0.01 0.02 0.03 0.04
B
ea
m
De
flec
tio
n
(m
m
)
Storey Drift
DCM-CONVEN DCM-SINGLE DCM-DOUBLE
Figure 20:Drift versus beam deflection.
0 2 4 6 8 10 12
-0.04 -0.02 0 0.02 0.04
Cr
a
ck
O
p
en
n
in
g
(m
m
)
Storey Drift
DCM-CONVEN+ DCM-CONVEN- DCM-SINGLE+
DCM-SINGLE- DCM-DOUBLE+
Latin A m erican Journal of Solids and Structures 12 (2015) 787-807 3.4 Damage index and tensile stresses in the joint rejoin
The most widely accepted damage index incorporated in most studies is the Park and Ang (1985) damage index with (Park R. 1985; Karayannis and Sirkelis 2008; Ghosh, Datta et al. 2011) as the main damage indicator. In this study, the Park and Ang Damage index was hired to assess the damaged state of the specimens during the third complete cycle of 0.035 rad drift ratio. A correla-tion exists between the damage index value and the damaged state of the specimens with the value of one as the collapse state while zero indicating the undamaged state of the specimens. Other val-ues in the range of zero to one, increasing form undamaged state to collapse state, indicate the in-termediate damage states as shown in Table 4. The five damage states of buildings are categorized as none, slight, minor, moderate and severe. The Park and Ang damage index is known to be a mathematical model for quantitative description of the damage state where it is presented as the linear combination of normalized maximum deformation and hysteretic energy dissipation:
d
m y
e
u y y u
E D
M (4)
where, m is the maximum rotation attained during cyclic loading, u is the ultimate rotational
capacity of the section, y is the returnable rotation after unloading, My is the yielding moment,
is the non-negative parameter indicating the cyclic loading effect on structural damage and
dE is the hysteretic energy absorbed by the element during the cyclic loading.
Table 4:Park and ang damage index.
According to Figures 12, 15, 16 and 21, it is evident that the DCM- CONVEN model has experi-enced wider cracks compared to those of DCM- SINGLE and DCM-DOUBLE ones. With applica-tion of Eq.4, it was concluded that the DCM- SINGLE and DCM-DOUBLE models had a damage index of approximately 0.7 while the DCM- CONVEN model had a damage index of higher than 1. Enabling the adjoining members to develop and sustain their ultimate capacity would be the essential requirement of a joint as the intersection zone of beams and columns. In case of an earth-quake (lateral loading), diagonal tensile and compressive stresses are developed within the joint by the equilibrating forces from beams and columns (Figure 22). For the purpose of sustaining these forces, provision of adequate shear reinforcement and high bond stresses among the joint concrete and the longitudinal bars is required. Since poor hysteretic properties are exhibited by both conven-tional shear reinforcements and bond mechanisms, beam-column joints cannot be incorporated as primary energy dissipating sources. Installation of strain gauges on shear reinforcement bars of DCM-CONVEN specimen recording limited tensile strain values that proved this claim.
Neverthe-Damage State Descriptions Damage Index
Latin A m erican Journal of Solids and Structures 12 (2015) 787-807
less, significant inelastic tensile deformations were recorded by steel strain gauges installed on shear reinforcements of DCM-SINGLE and DCM-DOUBLE specimens in compare with conventional specimen. Further, the strain values were recorded by concrete strain gauges installed at joint re-gions experienced different performance. The DCM-SINGLE and DCM-DOUBLE specimens expe-rienced lower strain values compared to DCM-CONVEN. The strain values within the joint region and shear reinforcement versus storey drifts diagrams are depicted in Figures 23 and 24 respective-ly. It is noteworthy to mention that a great contribution is made by both elastic and inelastic shear deformations of joints to storey drifts in frames.
Figure 22:Tensile stresses in case of lateral loading.
0 1000 2000 3000 4000 5000 6000
0 0.005 0.01 0.015 0.02 0.025 0.03 0.035 0.04
S
tr
a
in
(m
ic
ro
-s
tr
a
in
)
Storey Drift
DCM-CONVEN P DCM-SINGLE P DCM-DOUBLE P
DCM-CONVEN N DCM-SINGLE N DCM-DOUBLE N
Figure 23: Concrete strains within the joint rejoin vs. drift ratio for the DCM group.
4 SUMMARY AND CONCLUSION REMARKS
In this study, the seismic performance of a new proposed beam-column connection introduced as
m-Latin A m erican Journal of Solids and Structures 12 (2015) 787-807 pared with rectangular spiral (DCM- SINGLE) and conventional (DCM- CONVEN) shear rein-forcement systems. The fundamental acceptance criteria chosen for seismic assessment of the con-nections in this research were according to ACI 318-08. The following conclusions have been drawn regarding the experimental and numerical results of this study:
0 1000 2000 3000 4000 5000 6000 7000 8000 9000
0 0.005 0.01 0.015 0.02 0.025 0.03 0.035 0.04
S
tr
a
in
(
m
ic
ro
-s
tr
a
in
)
Storey Drift
DCM-CONVEN P DCM-SINGLE P DCM-DOUBLE P
DCM-CONVEN N DCM-SINGLE N DCM-DOUBLE N
Figure 24: Strains in shear reinforcement vs. drift ratio for the DCM Group.
i) The failure mode of RC beam-column connections, whether fairly ductile flexural failure or
highly ductile flexural failure, is significantly affected by the angle between the shear rein-forcement and shear cracks. Hence, developing higher capacity of the connected beam was ob-served for the DCM- DOUBLE and DCM- SINGLE specimens compared to that of the con-ventional (DCM- CONVEN) shear reinforcement system.
ii) A 3.5% drift angle was achieved by all DCM- DOUBLE, DCM- SINGLE and DCM-CONVEN
specimens having relative energy dissipations of at least 1/8. Nevertheless, higher levels of seismic performance were met through the use of rectangular spiral reinforcement in the speci-mens.
iii) The DCM- DOUBLE specimen demonstrated a higher energy dissipation capacity than the
DCM- SINGLE specimen. This higher energy dissipation capacity is due to the presence of double spiral transverse reinforcements in each section of the beam-column connection, which resist effectively to cyclic loading.
iv) The shear transverse pattern greatly affected the overall deflection and crack opening of the
specimens. A higher duEctility is resulted from the rectangular spiral reinforcement which pro-vides significant deflections. Both the DCM- DOUBLE and DCM- SINGLE specimens showed widespread crack distributions compared to the DCM- CONVEN one.
v) Application of rectangular spiral shear reinforcement pattern includes some advantages that
Latin A m erican Journal of Solids and Structures 12 (2015) 787-807 Acknowledgements
This project was funded by a research grant provided by the Malaysian government, under the supervision of Universiti Teknologi Malaysia (UTM). Any opinions, findings, and conclusions ex-pressed in this paper are those of the authors. Moreover, all nine full-scale beam-column connection prototypes were constructed and tested in the Laboratory of Structures and Materials, Universiti Teknologi Malaysia (UTM).
References
Acceptance Criteria for Moment Frames Based on Structural Testing (ACI T1.1-01). American Concrete Institute. ACI-Committee318, (2008). Building code requirements for structural concrete and commentary. ACI 318-08, Ameri-can Concrete Institute, Farmington Hills, Detroit, 465.
Azimi, M., Adnan, A.B. et al., (2014). Energy Absorption Capacity of Reinforced Concrete Beam-Column Connec-tions, with Ductility Classes Low. American Journal of Civil Engineering and Architecture 2(1): 42-52.
CEN-EC8, E. C. f. S., (2004). Design of structures for earthquake resistance, part 1: General rules, seismic actions and rules for buildings. EN 1998-1, Eurocode 8 Brussels.
Considere, A., (1903). Experimental researches on reinforced concrete. Leon S. Moisseiff, trans. and comp., McGraw Publishing Co.: p. 188p.
Ghosh, S., Datta, D. et al., (2011). Estimation of the Park–Ang damage index for planar multi-storey frames using equivalent single-degree systems. Engineering Structures 33(9): 2509-2524.
Hindi, R.A., (2004). Cross Spirals Reinforcement to Confine Reinforced Concrete Columns Provisional Patent Appli-cation. Application No. 60/571,641, May.
Kakaletsis, D., Karayannis, C. et al., (2011). Effectiveness of rectangular spiral shear reinforcement on infilled R/C frames under cyclic loading. Journal of Earthquake Engineering 15(8): 1178-1193.
Karayannis, C.G., Chalioris C.E., (2013). Shear tests of reinforced concrete beams with continuous rectangular spiral reinforcement. Construction and Building Materials 46: 86-97.
Karayannis, C.G., Chalioris, C.E., Mavroeidis, P.D., (2005a). Shear capacity of RC rectangular beams with continu-ous spiral transversal reinforcement. WIT Trans Modell Simul 41: 379-386.
Karayannis, C., Sirkelis, G., (2005a). Response of columns and joints with spiral shear reinforcement. WIT Trans Modell Simul: 41: p. 455–463.
Karayannis, C., Sirkelis, G., (2005b). Seismic behaviour of reinforced concrete columns with rectangular spiral shear reinforcement. 3rd International conference on construction in the 21st century (CITC-III), Advancing Engineering, Management and Technology, Athens.
Karayannis, C., Sirkelis, G., (2008). Strengthening and rehabilitation of RC beam–c”lum“ j”i“ts usi“g carb”“‐FRP jacketing and epoxy resin injection. Earthquake Engineering & Structural Dynamics 37(5): 769-790.
Karayannis, C., Sirkelis, G., Mavroeidis, P., (2005b). Improvement of seismic capacity of external beam-column joints using rectangular spiral shear reinforcement. Proc. of the Fifth International Conference on Earthquake Re-sistant Engineering Structures.
Mander, J., Priestley, M. et al., (1988). Observed stress-strain behavior of confined concrete. Journal of Structural Engineering 114(8): 1827-1849.
Park, R., Paulay, T., (1973). Behaviour of reinforced concrete external beam-column joints under cyclic loading. Proceedings.
Park R, Paulay, T., (1975). Reinforced concrete structures. John Wiley & Sons.
Park, Y.J., Ang, A.H.-S., (1985). Mechanistic seismic damage model for reinforced concrete. J. of Structural Engi-neering ASCE 111(4): pp. 722-739.
Latin A m erican Journal of Solids and Structures 12 (2015) 787-807 Saatcioglu, M., Razvi, S., (1992). Strength and ductility of confined concrete. J. Struct. Eng. ASCE 118(25): 1590– 1607.
Sheik, S., Toklucu, M., (1993). Reinforced concrete columns confined by circular spirals and hoops. ACI Struct. J. 90(5): 542–553.
Tavárez, F.A., (2001). Simulation of behavior of composite grid reinforced concrete beams using explicit finite ele-ment methods, UNIVERSITY OF WISCONSIN.
Tsonos, A.G., (2007). Cyclic load behavior of reinforced concrete beam-column subassemblages of modern structures. ACI Structural Journal 104(4): 468-478.
Willam, K., Warnke, E., (1975). Constitutive model for the triaxial behavior of concrete. Proceedings, International Association for Bridge and Structural Engineering, ISMES, Bergamo, Italy.
Yang, K.-H. et al., (2011). Shear behavior of continuous reinforced concrete T-beams using wire rope as internal shear reinforcement. Construction and Building Materials 25(2): 911-918.
Appendix A
DCM
BEA
M
Longitudinal bars (L)
C
OLU
M
N
Longitudinal bars (L)
Critical region length hw Critical region length max hc, bc , 0.6 mm, lc 5
min 0.5fctm fyk min 1%
max 0.0018fcd xy d yd, f max 4%
Transverse bars (w) Bars per side 3
Outside critical regions Spacing between restrained bars 200 mm
Spacing sw 0.75d Transverse bars (w)
w
1 2
0.08 fck fyk Outside critical regions
In Critical Regions dbw 6 mm , dbl 4
Spacing sw 8dbl , hw 4 , 24dbw , 225 mm Spacing sw 20dbl , min h bc,c , 400 mm
bw
d 6 mm In critical regions
bw
d 6 mm , dbl 4
Spacing sw 8dbl , b0 2 , 175 mm
Table A1:Connection design formulae for ductility classes medium in EUOROCODE.
where,
ck
f characteristic compressive cylinder strength of concrete at 28 days, fcd design value of concrete
compressive strength, fctm mean value of axial tensile strength of concrete, fyk characteristic yield
strength of reinforcement, fyd design yield strength of reinforcement, fywd design yield of shear
rein-forcement, d effective depth of section, dbl longitudinal bar diameter, dbw diameter of hoop, hw
cross-sectional depth of beam, hc cross-sectional depth of column in the direction of interest, sy d,
design value of steel strain at yield, curvature ductility factor, w shear reinforcement ratio,
compression steel ratio in beams, b0 width (minimum dimension) of confined concrete core (to
cen-treline of hoops).
( )
( )