www.atmos-chem-phys.net/15/2613/2015/ doi:10.5194/acp-15-2613-2015
© Author(s) 2015. CC Attribution 3.0 License.
Quantification of the depletion of ozone in the plume of Mount Etna
L. Surl1, D. Donohoue1,*, A. Aiuppa2,3, N. Bobrowski4, and R. von Glasow1
1Centre for Ocean and Atmospheric Sciences, School of Environmental Sciences, University of East Anglia,
Norwich, NR4 7TJ, UK
2DiSTeM, Università di Palermo, 90123 Palermo, Italy
3Istituto Nazionale di Geofisica e Vulcanologia, Sezione di Palermo, Via La Malfa 153, 90146 Palermo, Italy 4Institut für Umweltphysik, Universität Heidelberg, Im Neuenheimer Feld 229, 69120 Heidelberg, Germany *now at: Department of Chemistry, Lawrence University, Appleton, Wisconsin, 54911, USA
Correspondence to:L. Surl ([email protected])
Received: 26 June 2014 – Published in Atmos. Chem. Phys. Discuss.: 12 September 2014 Revised: 19 January 2015 – Accepted: 12 February 2015 – Published: 9 March 2015
Abstract. Volcanoes are an important source of inorganic halogen species into the atmosphere. Chemical processing of these species generates oxidised, highly reactive, halogen species which catalyse considerable O3 destruction within
volcanic plumes. A campaign of ground-based in situ O3,
SO2and meteorology measurements was undertaken at the
summit of Mount Etna volcano in July/August 2012. At the same time, spectroscopic measurements were made of BrO and SO2columns in the plume downwind.
Depletions of ozone were seen at all in-plume measure-ment locations, with average O3depletions ranging from 11–
35 nmol mol−1(15–45 %). Atmospheric processing times of the plume were estimated to be between 1 and 4 min. A 1-D numerical model of early plume evolution was also used. It was found that in the early plume O3was destroyed at an
approximately constant rate relative to an inert plume tracer. This is ascribed to reactive halogen chemistry, and the data suggests the majority of the reactive halogen that destroys O3in the early plume is generated within the crater,
includ-ing a substantial proportion generated in a high-temperature “effective source region” immediately after emission. The model could approximately reproduce the main measured features of the ozone chemistry. Model results show a strong dependence of the near-vent bromine chemistry on the pres-ence or abspres-ence of volcanic NOxemissions and suggest that
near-vent ozone measurements can be used as a qualitative indicator of NOxemission.
1 Introduction
Volcanoes are known to be a major source of climati-cally important species, trace gases, and aerosol into the at-mosphere, both through explosive eruptions and sustained quiescent degassing (e.g. von Glasow et al., 2009). The largest gaseous components of most eruptions are water, car-bon dioxide and sulphur compounds, followed by hydrogen halides (Symonds et al., 1994). These volcanogenic halides are known to present environmental hazards upon deposition to soils (e.g. Delmelle et al., 2003). Emissions of bromide, while weaker and less well studied than those of fluoride and chloride (Pyle and Mather, 2009), are of interest to at-mospheric chemistry due to the conversion of HBr to very reactive ozone-depleting bromine species (Bobrowski et al., 2003, 2007; Bobrowski and Platt, 2007; Gerlach, 2004; von Glasow et al., 2009; von Glasow, 2010; Oppenheimer et al., 2006; Kern et al., 2009; Roberts et al., 2009, 2014; Kelly et al., 2013).
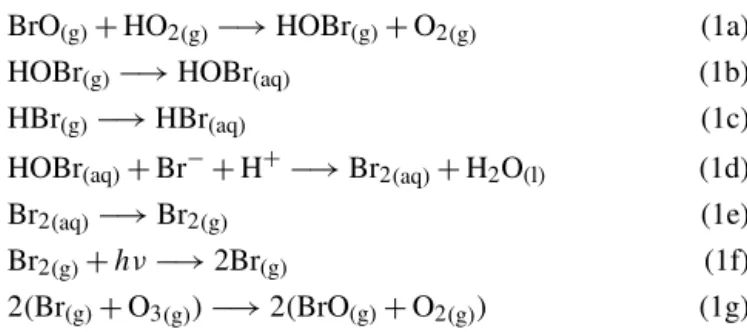
Thebromine explosionis an autocatalytic chemical reac-tion cycle which is known to convert bromine from HBr to very reactive forms (Wennberg, 1999). It is considered to be the reason for detections of elevated BrO associated with de-pleted O3(e.g. von Glasow et al., 2009; Saiz-Lopez and von
BrO(g)+HO2(g)−→HOBr(g)+O2(g) (1a)
HOBr(g)−→HOBr(aq) (1b)
HBr(g)−→HBr(aq) (1c)
HOBr(aq)+Br−+H+−→Br2(aq)+H2O(l) (1d)
Br2(aq)−→Br2(g) (1e)
Br2(g)+hν−→2Br(g) (1f)
2(Br(g)+O3(g))−→2(BrO(g)+O2(g)) (1g)
There is no equivalentchlorine explosionas HCl is less reac-tive than HBr (see von Glasow et al., 2009).
In the troposphere, reactive halogen species catalyse ozone destructive cycles (e.g. Saiz-Lopez and von Glasow, 2012) (X and Y are halogen atoms):
XO(g)+YO(g)−→X(g)+Y(g)+O2(g) (2a)
XO(g)+YO(g)−→XY(g)+O2(g) (2b)
XY(g)+hν−→X(g)+Y(g) (2c)
X(g)+O3(g)−→XO(g)+O2(g) (2d)
Y(g)+O3(g)−→YO(g)+O2(g). (2e)
Reactive halogen chemistry and related O3 depletion has
been studied in detail in the polar and marine boundary layers and over salt lakes (see Saiz-Lopez and von Glasow, 2012, for an overview).
BrO is detectable through spectroscopy, and detection of elevated levels are used as an indicator for the occurrence of reactive bromine chemistry. BrO was first detected in a vol-canic plume by Bobrowski et al. (2003), and has, to date, been detected in the plumes of about 20 different volcanoes. A good overview of ground-based measurements of BrO in volcanic plumes can be found in Boichu et al. (2011) and ref-erences therein. A systematic study of satellite data by Hör-mann et al. (2012) greatly extended the data set of known BrO events detected via satellite measurements.
In both satellite and ground-based studies, in-plume ratios of BrO to SO2have been found to be of the order of 10−5–
several 10−4once the plume has been transported a few km from the source (e.g. Bobrowski et al., 2007; Boichu et al., 2011; Hörmann et al., 2012). Measurements and modelling studies of in-plume BrO/SO2ratios have shown BrO to be
either present at low levels or undetectable within 1 km of volcanic vents whilst the BrO/SO2 ratio a few km
down-wind of the same vent is measured as up to several 10−4 (e.g. Bobrowski et al., 2007; Kern et al., 2009). This suggests the formation of BrO is occurring within the time taken for this downwind transport. SO2is widely used as a tracer for
volcanic emissions due to its high concentration in volcanic plumes, low reactivity, and easily detectable spectroscopic signal (McGonigle et al., 2004).
Volcanoes are known to emit other halogens (F, Cl, I). The HF molecule is expected to be too stable for any in-plume
Table 1.Table of reported depletions of O3in tropospheric volcanic plumes.
Volcano Measurement Reference platform
Augustine airborne Vance et al. (2010) Erebus airborne Oppenheimer et al. (2010)
Boichu et al. (2011) Etna ground-based Vance et al. (2010) Eyjafjallajökull airborne Vance et al. (2010)
Schumann et al. (2011) St. Helens airborne Hobbs et al. (1982) Redoubt airborne Kelly et al. (2013) Sakurajima ground-based Lee et al. (2005)
reactive F chemistry to occur (von Glasow et al., 2009), whilst the magnitudes of volcanic HI emissions are proba-bly too low to have a significant effect on plume chemistry (Aiuppa et al., 2005a). Measurements of oxidised Cl in vol-canic plumes are varied, having been observed at Sakurajima (Lee et al., 2005), Etna (Bobrowski et al., 2007; General et al., 2014), Puyehue-Cordón Caulle (Theys et al., 2014), and Soufière Hills (Donovan et al., 2014). However a DOAS investigation by Kern et al. (2009) specifically looking for oxidised Cl did not detect any in the plume of Masaya Vol-cano. It is unknown whether this reflects natural variability or measurement issues. See Roberts et al. (2009) for a dis-cussion of reactive chlorine formation in volcanic plumes.
The conceptual model of halogen-O3 chemistry within
volcanic plumes is complicated by the very high temper-atures of the plume immediately after emission and mix-ing with the atmosphere. Such high temperature mixtures are believed to reach or approach thermodynamic equilib-rium (Symonds et al., 1994), resulting in the production of non-negligible quantities of oxidised halogen species which may begin the autocatalytic cycles described above (Gerlach, 2004; Bobrowski et al., 2007; Martin et al., 2009). Because of the hazards involved, this “effective source region” within the crater (Bobrowski et al., 2007) cannot be investigated di-rectly. Instead, inventories of volcanic emission species are based mostly on samples of fumarole emissions or crater-rim measurements (Gerlach, 2004). Processes occurring in the effective source region are inferred from these measure-ments, theory, and measurements of the plume further down-wind.
While BrO (and, with greater difficulty, OClO) can be measured remotely using passive spectroscopic techniques, direct measurements of O3depletion within volcanic plumes
have to be made in situ due to the large atmospheric O3
col-umn, and as a result the existing body of literature on the de-pletion of ozone within volcanic plumes is small, see Table 1. Active DOAS measurement of O3 at a volcano is possible,
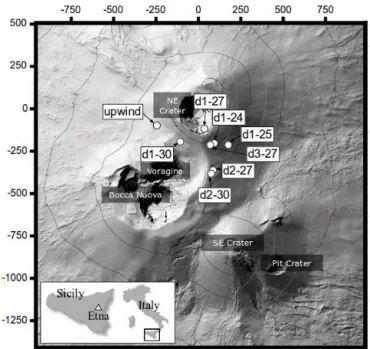
Figure 1.Map of the sampling sites and summit craters. Terrain from Neri et al. (2009). Coordinates are metres displacement from the NE crater.
the only published active DOAS O3measurement at a
vol-cano is Kern et al. (2009). In this investigation, no O3
de-pletion could be determined – the authors of this publication attribute this to the difficulties of isolating a plume O3signal
from that of the background air.
This study expands this small collection of O3
observa-tions. In addition, the O3 depletion data collected are
asso-ciated with simultaneous measurements of an inert plume tracer (SO2). To the authors’ knowledge, no prior data set
exists of simultaneous measurements of O3depletion and a
tracer species within 1 km of volcanic vents. Wind speeds have also been measured, such that processing time can be determined for every datapoint. As in-plume halogen and O3
chemistry are closely linked, from these data we can inves-tigate both qualitatively and quantitatively the fast chemical processes occurring within the early plume.
2 Campaign and data processing 2.1 Location
The measurement campaign was conducted at Mount Etna, Sicily, Italy (37.7◦N, 15.0◦E) with the majority of mea-surements being taken between 24 July and 2 August 2012. Mount Etna is an active stratovolcano with a peak elevation of about 3300 m. At the time of measurement, the volcano was in a passively degassing phase with three active vents (North-East, Voragine and Bocca Nuova) within our survey area. Small Strombolian eruptions and an inner-crateric lava flow were observed at Bocca Nuova but explosive ejecta only
rarely surpassed the crater rim. Due to the vicinity of the Vor-agine and Bocca Nuova craters it was not possible to distin-guish between their plumes. Therefore in this analysis we have considered them to be a single source, which we define as the “central craters”.
Most of the measurements were taken near the crater rim at elevations significantly above the planetary boundary layer. Due to logistical constraints we took these measurements be-tween 08:40 and 12:00 UTC (10:40–14:00 local time). The sky was cloud-free on all days of measurement. The ground-based remote sensing measurements of the plume were taken from locations further downwind with plume ages of up to 30 min.
On all days of near-crater measurements we took measure-ments at a fixed site that was upwind of all summit craters and at 1–3 sites in the plume at varying distances from the craters (Fig. 1). This was done to sample plumes at different processing times. Sampling times at the sites varied between 20 and 60 min (see Table 3).
The names given to the near-crater measurement sites in the figures and in Table 3 indicate the day on which the surements were taken and the order in which they were mea-sured. For example, site “d2-27” was the second downwind site measured on 27 July. All upwind measurements were taken at the same location. In Table 3, the upwind site data sets collected on each day have been treated separately. For example, “30” is the set of measurements taken at the up-wind site on 30 July.
2.2 Instrumentation
Ozone mixing ratios were measured via UV adsorption with a 2B Technologies instrument, model 202. A particle filter was placed on the inlet to prevent aerosols from influencing data or damaging the instrument. Because of the overlap of the O3and SO2adsorption spectra (e.g. Vance et al., 2010)
we also fitted the inlet with two SO2scrubbers in series to
prevent interference in the O3measurements. The scrubbers
were packed with CrO3-coated microfibre filter paper. We
tested the endurance of the scrubbers prior to the campaign. Air with a SO2mixing ratio of 700 µmol mol−1was passed
through the setup at a flow rate of 0.58 L min−1. No SO2
-related signal could be detected on the O3monitor for 2.25 h,
a removal of approximately 15 mg of SO2. This greatly
ex-ceeds the expected SO2exposure of the scrubbers in the field.
New scrubbers and particulate filters were used daily. We calibrated the ozone monitor and inlet setup daily with a 2B Technologies model 306 O3 calibration source.
Lin-ear losses of O3in the inlet/scrubber system was detected,
We measured several gases’ mixing ratios with a portable version of the INGV-type multi-component gas analyser system (MULTIGAS) (Aiuppa et al., 2011, 2012), though only the SO2 measurements have been used in this
anal-ysis. The SO2 measurement used an electrochemical
sen-sor (0–200 µmol mol−1; 3ST/F electrochemical sensor, City Technology Ltd.). A protective particulate filter was included on the instrument inlet. Data were recorded on an on-board data-logger and stored internally. The instrument’s sensors and data-logger were housed in a water-proof box with a 1.2 L min−1pump and a 12V battery. The sensors were cal-ibrated before and after fieldwork with standard calibration gases; the instrument’s accuracy and precision were deter-mined to both be about 20 %. The MULTIGAS was not used for the first 2 days of the campaign (24 and 25 July).
Temperature, humidity and wind vector were measured with a Kestrel 4500 commercial weather station, mounted on a tripod. Prior to the campaign, the device’s relative humidity measurement was calibrated with standardised salt solutions. Each instrument recorded data at a different frequency. Ta-ble 2 shows the instruments’ measurement intervals and pre-cision errors.
At the measurement sites we set up the ozone monitor and MULTIGAS on the same tripod, with the inlet tubes tioned closely together. The weather station tripod was posi-tioned within 5 m of the tripod supporting the in situ instru-ments. The locations of the sites were determined by hand-held GPS. The source of the plume at each downwind site was determined visually.
Remote sensing measurements of the downwind evolution of the volcanic plume with two Mini-MAXDOAS (multi-axis differential optical absorption spectroscopy) instruments were carried out (see Bobrowski et al., 2007, for an instru-ment description). Scans approximately perpendicular to the plume axis were made at distances between 6 and 16.6 km from the craters, corresponding to plume ages between about 8 and 30 min.
2.3 Data processing
The instruments listed in Table 2 each had independent inter-nal clocks which could only be roughly synchronised in the field. The MULTIGAS’ internal clock does not record abso-lute time, but only time since the device was switched on. In the field, we turned the device on at the same time as the other instruments, however it is probable some de-synchronisation of the data sets has occurred because of this. Inspection of the O3and SO2signal suggests that this de-synchronisation
may have been up to 25 s.
We used the upwind site data sets as reference values of the background air. For each downwind site, the O3
concentra-tion time-series was converted to a time-series of O3change
(1O3) using the average O3 mixing ratio measured at the
upwind reference site on that day.
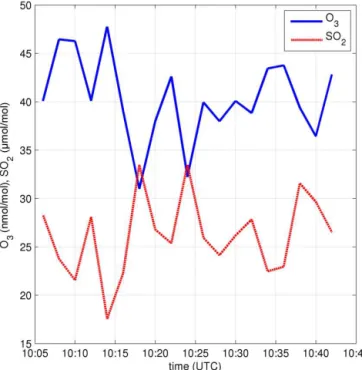
Figure 2.An example time series of measurements: O3and SO2 mixing ratios measured in the plume at site d1-27. Data have been averaged into 120 s bins as described in the text.
As the collection frequency of the instruments differed, the data were binned into 120 s bins. Each 120 s bin there-fore covered several measurements from each instrument and for each parameter a mean value was calculated. The use of 120 s bins reduced the precision error on the resulting data points. Additionally, the use of 120 s bins is expected to re-duce the impact of any potential asynchronisation resulting from either the problem discussed above or from different instrument response times.
Inspection of the signals (e.g. Fig. 2) showed clear anticor-relation between the O3and SO2mixing ratios.
SO2is used as the inert plume tracer, a measure of plume
strength for the bin. Measured background levels of SO2
were negligible in comparison to in-plume measurements, and SO2 is expected to be effectively chemically inert. For
each 120s measurement bin a ratio 1O3/SO2 (change in
molecules O3 per molecule inert plume tracer) was
calcu-lated, this is a measure of O3change that is attributable to
chemical and not physical processes (a proof of this can be found in the appendix).
Transport times between the craters and the downwind sites were determined from the distances between the sites and the vents, and the measured wind speeds.
Table 2.Instruments used at the near crater sites.
Name Parameter Precision Sampling interval
Kestel 4500
Temperature ±1◦C
30 s Humidity ±3 % RH
Wind speed ±3 % or±1 m s−1(whichever larger)
MULTIGAS SO2 ±20 % 2 s
2B Technologies Model 202 O3 ±3 nmol mol−1 10 s
the SO2values is calculated from the variance of this
quan-tity within the bin and the instrument error. The uncertainty in the O3 values is calculated in the same manner, and for
1O3measurement additionally factor in the variance in the
O3measurement in the corresponding background
measure-ment. These errors are manifest in the y axis error bars of Figs. 3 and 4, and are combined to give theyaxis error bars of Fig. 5.
Gaseous elemental mercury is known to be emitted by Etna (Bagnato et al., 2007) and has the potential to cause in-terference with UV-based ozone monitors (EPA, 1999), giv-ing false O3 signal when in the sampled air. The inlet and
CrO3scrubbers were not tested against mercury interference.
If elemental mercury was entering the monitor in the mixing ratios observed by Bagnato et al. (2007), and causing inter-ference of the magnitudes seen by EPA (1999), it would have caused us to make underestimations of the depletion of O3on
the order of 10 nmol mol−1. However, this would assume that all the mercury emitted from the volcano was primarily in the elemental form. This is unlikely as modelling studies (von Glasow, 2010) indicated that much on the mercury is oxi-dised within the plume. In addition, mercury measurements at Etna contemporaneous with our campaign (T. A. Mather and M. L. Witt, personal communication, 2014) indicate that the mercury loading of the craters’ plumes were significantly less than that which was measured by Bagnato et al. (2007) in 2004–2007 and confirmed that much of the observed mer-cury was in an oxidised or particulate form. It is also probable that the two CrO3scrubbers scavenged or oxidised much of
the elemental mercury in the sampled air, as the system is not heated and the scrubbers are changed daily it is unlikely that mercury scavenged by the scrubber would be re-volatilised as elemental mercury. No compensation for this potential ef-fect was made in the post-processing as we believe that the potential for this interference is very low and because the observed anti-correlation of the O3 and SO2 signals is the
inverse of what would be expected from such interference. The MAXDOAS data were evaluated for BrO and SO2
with the WinDOAS V2.10 software package (van Roozen-dael and Fayt, 2001) which uses a nonlinear least-square method (Stutz and Platt, 1996). A BrO/SO2 ratio was
cal-culated for each measurement day by a correlation plot of the daily data set. The plume ages at the point of measurement were calculated from the wind speed and lateral distance
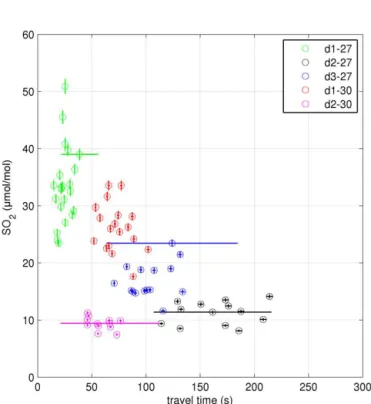
Figure 3.SO2mixing ratios against calculated processing time at the in-plume measurement sites. Error bars are 1 standard deviation, accounting for both variance in the values over the 120 s of each bin and known errors of the instruments.
from the craters. In the absence of wind speed data at Etna, speeds from soundings taken at Trapani (37.91◦N, 12.50◦E, data from http://weather.uwyo.edu/upperair/sounding.html) were used. The 220 km distance between the location of the soundings and the volcano means that there is a relatively large and unquantifiable uncertainty in the calculated plume ages.
3 Results
An overview of the near-crater results from this campaign can be seen in Table 3. Calculated plume ages were found to be of the order 1–4 min.
The plume was observed to be grounded at all downwind sites, enabling measurement. As both O3and SO2are known
in-Table 3.Overview of results from Etna summit measurement campaign.
Site Upwind/ Plume Distance to Date Time (UTC) Average Values
Downwind Source source/m Temp./ Humidity/ [SO2]/ [O3]/ 1[O3] /
◦C % µmol mol−1 nmol mol−1 nmol mol−1
up-24 Upwind – – 2012-07-24 09:10–09:35 3 49 3 n.m. 86 –
d1-24 Downwind Central 300 2012-07-24 10:05–11:30 7 64 7 n.m. 69 −18
up-25 Upwind – – 2012-07-25 11:05–11:30 7 63 7 n.m. 83 –
d1-25 Downwind Central 440 2012-07-25 09:52–10:30 11 60 11 n.m. 58 −25
up-27 Upwind – – 2012-07-27 08:41–09:02 9 59 9 0 77 –
d1-27 Downwind NEC 150 2012-07-27 09:26–10:16 11 49 11 34 46 −31
d2-27 Downwind NEC 380 2012-07-27 10:34–11:06 13 42 13 11 50 −26
d3-27 Downwind NEC 240 2012-07-27 11:20–11:50 13 34 13 17 41 −35
up-30 Upwind – – 2012-07-30 09:12–09:34 12 <5 12 0 73 –
d1-30 Downwind Central 240 2012-07-30 10:05–10:43 16 6 16 26 40 −32
d2-30 Downwind Central 300 2012-07-30 11:07–11:41 15 5 15 9 62 −11
n.m.:SO2was not measured on these days.
Figure 4.1O3against calculated processing time at the in-plume measurement sites. Error bars are 1 standard deviation, accounting for both variance in the values over the 120 s of each bin and known errors of the instruments.
struments to be perturbed by this physical process. However the ground at the peak of Etna is rocky and devoid of vege-tation and could be classed in the scheme of Wesely (1989) as “barren land”. The bulk surface resistance of this category sufficiently high that, even if the aerodynamic and sublayer resistances are low, the deposition velocity will be too low to cause a significant perturbation during the transport from crater rim to the measurement sites.
Ozone depletion of up to 45 % was observed at all seven downwind sites. SO2decreases with transport time (Fig. 3),
as would be expected due to dilution. The low SO2 mixing
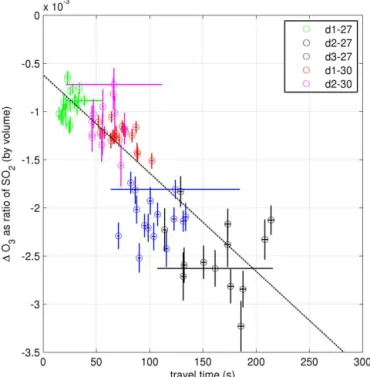
Figure 5.1O3/SO2against calculated processing time at the in-plume measurement sites. The gradient of the linear line of best fit is−(1.02±0.07)×10−5s−1and the y-intercept is(−6.2±0.5)× 10−4. Error bars are 1 standard deviation, accounting for both vari-ance in the values over the 120 s of each bin and known errors of the instruments.
ratios at site d2-30 suggest this site was at the plume edge, this is consistent with visual observations of the plume. A plot of1O3against transport time (Fig. 4) shows no
compa-rable trend as chemical destruction of O3 and dilution with
background air occur simultaneously.
In Fig. 5,1[O3]/[SO2] vs. transport time is plotted. The
linear trend is indicative of chemical destruction of O3
The data on Fig. 5 appear to fit a linear trend. This in-dicates, that as a ratio to the inert plume tracer, the rate of chemical O3 destruction is constant within the first few
minutes of plume evolution. In the expected chemical cycles Eq. (2), the rate of O3destruction is dependant on the
concen-tration of halogens in highly reactive (non-hydrogen halide) forms. Therefore a constant rate of reaction indicates that the ratio of these species to SO2is approximately constant
dur-ing the first few minutes of plume evolution.
Depletion of ozone occurred on 30 July even when the rel-ative humidity was<10 %. This is below the crystallisation point of any major aerosol component that would be expected to be present in the plume. It would therefore be expected that at such low humidities aqueous phase reactions (such as reaction 1d) would occur at a much slower rate, preventing the bromine explosion from converting HBr to very reactive forms of bromine. On inspection of the humidity measure-ments (Table 3), no significant increase in humidity due to volcanic H2O was observed at the downwind sites (the
hu-midity variation between up-24 and d1-24 could be volcanic in origin, however it is also in the range of normal meteo-rological variability). The possible impacts of a short-lived elevated humidity within the crater due to volcanogenic H2O
are considered with the “dry” model runs in Section 4 of this paper.
Data points from all measurement sites appear to approx-imately fit the same line-of-best fit on Fig. 5. This is despite the measurements spanning 2 separate days and these 2 days having very different circumstances. On 27 July the measure-ments were made in the plume of the North-East crater, and on 30 July the measurements were made in the plume of the central craters. The different craters are known to exhibit dif-fering emission compositions (Aiuppa et al., 2005a). In ad-dition, the relatively humidity on these 2 days was markedly different. It is unknown whether the cause of these two data sets’ approximate alignment in Fig. 5 is due to mechanistic reasons relating to the “effective source region” (see below) or coincidence.
A linear line of best fit was calculated using a Williamson– York iterative bivariate analysis (Cantrell, 2008), its gradi-ent is(−1.02±0.07)×10−4s−1.Ther2value of this fit is 0.76. This linear trend can be interpreted as there being a rate of destruction of O3within the plume of approximately
10−4molecules per molecule of SO2(the inert plume tracer)
per second in the first few minutes of plume evolution. SO2
is only used as a measure of plume intensity, SO2 does not
play a role in O3destruction.
Extrapolating the line of best fit on Fig. 5 results in an intercept of the x axis of approximately −60 s. Assuming chemical O3destruction is not instantaneous in the plume,
it would be expected that the line of best fit would pass through the origin. We determine that this offset is most likely the result of inaccuracy in the calculation of process-ing time. Firstly, the calculation assumes that air travels in a straight line between vent and sampling point; however, the
path length is likely to be greater than this due to turbulence, the topology of the mountaintop, and variation in wind di-rection. Second, the distances between vents and sampling points were calculated only from their lateral displacement and did not consider the time taken for vertical transport from the vent to the crater rim. From our visual observations of the plume, we estimate this vertical transport time is likely to have been of the order of a minute.
Table 4 lists the composition of volcanic volatiles. These figures are calculated from June 2012 values of SO2,
HF, HCl, and HBr measured using various alkaline traps (Wittmer et al., 2014) (Bocca Nuova crater), as well as the MULTIGAS measurements of CO2 and SO2 made on the
main campaign (using all available data). As complete char-acterisation of the volcanic volatiles could not be made from the June 2012 measurements alone, the ratio of the gases to CO2 were used in these calculations with absolute
val-ues of H2O and CO2 calculated from the values reported
in (Aiuppa et al., 2005b). Additionally, H2/SO2was taken
from (Aiuppa et al., 2011), and H2S/SO2 was calculated
from the values reported in (Aiuppa et al., 2005b). These val-ues were then normalised to ensure that the sum equals unity. The remote sensing results are shown in Table 5, along with the correlation between the BrO and SO2columns and
the estimated plume age (based upon distance from the crater and wind speed, see Sect. 2.3). The BrO/SO2column
ra-tios are within the range typically measured both in the Etna plume (Bobrowski and Giuffrida, 2012) and volcanic plumes in general (Boichu et al., 2011; Hörmann et al., 2012), though they are at the lower end of these ranges.
4 Modelling study
We used a vertically resolved 1-D numerical model MISTRA to simulate the chemical evolution of the volcanic plume in the atmosphere and to test the model’s performance against the data presented above. The model is the same as used in von Glasow (2010) with minor modifications. Based on pre-vious work (Gerlach, 2004; Martin et al., 2006; von Glasow, 2010) we used the thermodynamic equilibrium model HSC (Roine, 2007) to calculate the composition of the mixture of volcanic volatiles and ambient air in the “effective source re-gion” which is located in the crater where temperatures are high enough so that the assumption of immediate thermody-namic equilibrium is still largely valid but also enough am-bient air has been entrained to oxidise the main volcanic re-duced gases (mainly H2S and H2) which leads to a dramatic
change in halogen speciation. Recent studies (e.g. Aiuppa et al., 2007; Martin et al., 2012) have shown that the assump-tion of thermodynamic equilibrium is incorrect for a number of compounds, especially for H2S and NOxwhich makes the
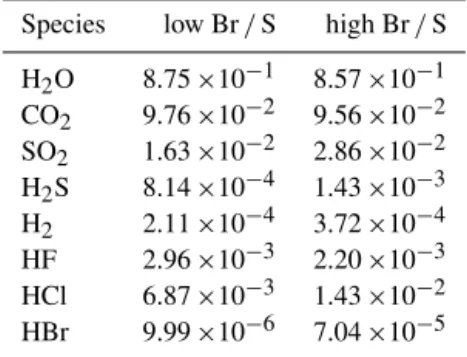
equili-Table 4. Fractional composition (by volume) of pure volcanic volatiles of Mt. Etna in June 2012 (“low Br/S”) and in 2005 (“high Br/S”). These compositions were used to initialise the HSC calcu-lations (for results see Table S1). “High Br/S” refers to the plume composition used in von Glasow (2010).
Species low Br/S high Br/S
H2O 8.75×10⁻¹ 8.57×10⁻¹ CO2 9.76×10⁻² 9.56×10⁻² SO2 1.63×10⁻² 2.86×10⁻² H2S 8.14×10⁻⁴ 1.43×10⁻³ H2 2.11×10⁻⁴ 3.72×10⁻⁴ HF 2.96×10⁻³ 2.20×10⁻³ HCl 6.87×10⁻³ 1.43×10⁻² HBr 9.99×10⁻⁶ 7.04×10⁻⁵
bration. See also related comments in Roberts et al. (2014). Compared to von Glasow (2010) we used a higher ratio of volcanic volatiles : ambient air (95 : 5), which is very rich in volcanic volatiles but already oxidised.
The model is run in Lagrangian mode, following the evo-lution of a “puff” of plume downwind of the volcano and explicitly modelling the interaction of the plume with back-ground air (see von Glasow, 2010). The modelled wind speed is 10 m s−1, and the plume dispersal is assumed to be Gaus-sian and follows Kärcher (1999) using the Pasquill–Gifford scheme to calculate the parameters of the Gaussian plume (see e.g. Seinfeld and Pandis, 2006).
The S and Br elemental ratios of the volcanic volatiles used in the HSC calculation are taken from the average val-ues measured at the crater rim (Table 4, column “low Br/S”) on 26 and 27 June 2012. We also did a second set of model runs initialised with a much higher Br/S ratio (Table 4, col-umn “high Br/S”) based on unpublished data from Alessan-dro Aiuppa. Table S1 in the Supplement gives the compo-sition of the volcanic volatiles and the results of the HSC calculations used as input for the 1-D model.
The relative humidity varied significantly during the cam-paign (see Table 3), which is important as the bromine explo-sion is efficient in the presence of aqueous aerosol.
Following Seinfeld and Pandis (2006) a crystallisation hu-midity of 40 % for sulphate-containing particles is assumed in the model, but other studies suggest sulphate-containing particles to be liquid for lower relative humidities (e.g. Mar-tin et al., 2003).
Regardless of the exact composition and crystallisation hu-midity of the volcanic aerosol present on the days of this study when simultaneous SO2 and O3 measurements were
made, we wanted to test the implications of crystallised aerosol in the model. We therefore ran the model at the fol-lowing three different settings regarding the deliquescence of the aerosol:
1. “moist”: relative humidity∼57 % (above the sulphate crystallisation humidity assumed in the model); aerosol aqueous phase chemistry occurs throughout the plume; 2. “dry”: relative humidity ∼21 % (below the assumed sulphate crystallisation humidity); aerosol aqueous phase chemistry consequently disabled; exception is the first∼1 min, where water from the volcano elevates the humidity within the plume;
3. “noHet”: where all heterogeneous chemical reactions were deactivated.
Being remote from major sources of anthropogenic pol-lution and above the planetary boundary layer, the ambient NOx levels at Etna are expected to be negligible compared
to the amount of nitrogen oxides (NOx) that thermodynamic
models such as HSC predict would be formed in the effective source regions of volcanic vents. However Kaschka (2007) and Martin et al. (2012) discussed the problems associated with this, mainly that the time required to reach equilibrium for NOxunder the given temperatures in the effective source
region is, by far, too long. The generation of NOxcould
sig-nificantly perturb bromine chemistry due to the formation of BrNO2(see e.g. Fig. 2 in von Glasow, 2010). A detailed
dis-cussion of volcanic plume Br–NOx chemistry, including a
modelling study that includes additional BrNO2 reactions,
can be found in Roberts et al. (2014). Use of their scheme would likely result in less bromine being present as BrNO2
and might lead to somewhat different O3development. For
each of the three aerosol settings described above, two model runs were done – one with volcanic NOxin the quantities
pre-dicted in the thermodynamic model and one with no volcanic NOx. These six runs were performed for both of the plume
initialisations shown in Table 4.
4.1 “Low Br/S” modelled plume
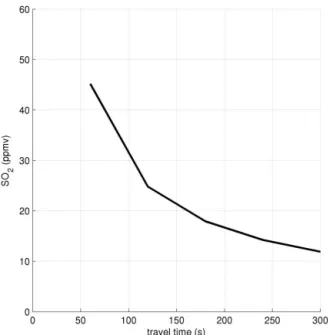
Model results are shown for the core of the plume which is most appropriate for the grounded plume measured in our campaign. Comparison of modelled and measured plume SO2mixing ratios, shown in Figs. 6 and 3, respectively, show
the plumes to be of similar intensity. Differences in SO2
mix-ing ratio between the six model runs are negligible. In order to approximately reproduce the measured SO2mixing ratios
at the crater rim, the “initial dilution” ratio of the HSC output with ambient air (see Materials and Methods in von Glasow, 2010) was set to a factor of 9×.
The 0–60 s section of the following figures are not plotted as the first data output from the model occurs at 60 s after plume release.
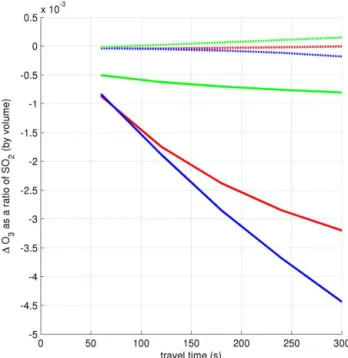
Figure 7 shows the modelled ozone depletion in the six runs. Figure 8 shows this as a ratio to SO2mixing ratio (c.f.
Figs. 4 and 5, respectively).
Table 5.Spectroscopic measurements of the Mount Etna plume. These data are also plotted on Fig. 11.R2refers to the correlation of BrO and SO2within the measurements.
Date BrO/SO2 R2 Distance Wind speed Plume age (km) (m s−1) (min)
2012-07-24 0.9×10⁻⁴ 0.94 11 8.7 21 2012-07-24 0.7×10⁻⁴ 0.80 6.3 8.7 12 2012-07-25 1.2×10⁻⁴ 0.66 10.4 6.2 28 2012-07-25 1.3×10⁻⁴ 0.52 6.8 6.2 18 2012-07-26 1.1×10⁻⁴ 0.64 17 9.3 30 2012-07-26 1.0×10⁻⁴ 0.90 8.8 9.3 16 2012-07-27 1.2×10⁻⁴ 0.48 16 22 12 2012-07-28 0.8×10⁻⁴ 0.47 12 13 15 2012-07-28 0.9×10⁻⁴ 0.50 9.0 13 11 2012-07-31 0.6×10⁻⁴ 0.72 5.9 5.7 17 2012-08-02 1.0×10⁻⁴ 0.48 6.0 12 8.1
Figure 6. Modelled SO2 mixing ratio in the plume core (“low Br/S” initialisation).
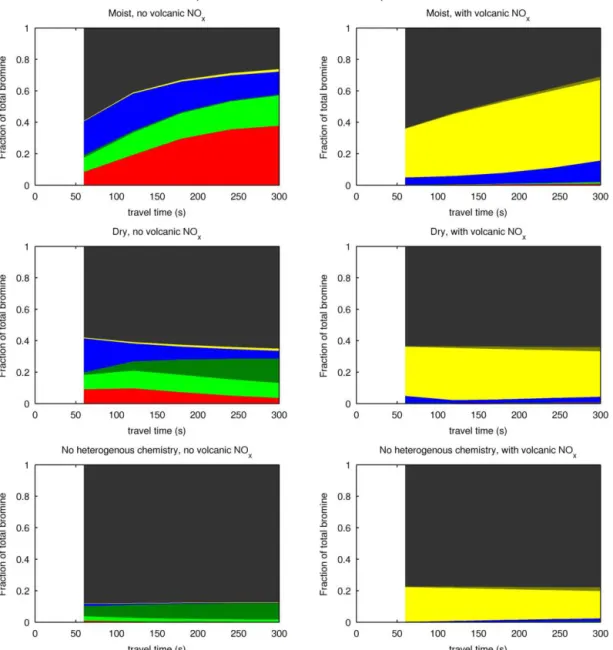
the modelled bromine chemistry can be investigated directly; Fig. 9 shows the speciation of bromine in the six different runs.
In all three runs with volcanic NOx, the bromine almost
entirely partitions to BrNO2. BrNO2 does not contribute to
O3 depletion. As shown in Fig. 7, in these runs the net O3
change is almost zero for all runs and is actually positive in the “noHet” and “dry” cases as a consequence of O3
-generating NOxchemistry.
The bromine explosion, as evidenced by conversion of HBr to other forms of bromine can be seen in the “moist” runs and has also occurred between 0 and 60 s of the “dry” run (where volcanic H2O is modelled to increase the plume’s
Figure 7.Evolution of1O3in the core of the plume for the six model scenarios discussed in the text (“low Br/S” initialisation).
humidity). In the “noHet” runs and in the “dry” runs after the volcanic humidity increase has ended, the processes that convert HBr to other forms are effectively halted.
In all three NOx-free runs, O3 is depleted. Reactive
bromine is generated by the high-temperature processes of the effective source region in all three runs. In the “moist” case, and to a slightly reduced extent in the “dry” case, this is supplemented by the generation of reactive bromine species via the bromine explosion, to the extent that in the “moist” case the O3 depletion is near 100 %. The consequences of
Figure 8.Evolution of1O3/SO2in the core of the plume for the six model scenarios discussed in the text (“low Br/S” initialisa-tion). The colour code is the same as in Fig. 7.
seen on Fig. 8, where the1[O3]/[SO2] ratios diverge over
the first few minutes.
A comparison of the O3 depletion (Figs. 7 and 8) after
60 s for the “noHet” run with that for the “dry” and “moist” runs shows the comparative influence of different processes within the crater. The ozone depletion in the “noHet” case must be due to reactive halogen generated in high temper-ature processes as heterogeneous reactions are required for low-temperature reactive bromine generation (the bromine explosion). The additional ozone depletion at 60 s in the “dry” and “moist” cases can therefore be attributed to the bromine released via the bromine explosion within the crater. As the plume moves away from the crater, the heterogeneous bromine explosion can only occur in the “moist” run so the increasing differences between the “moist” and “dry” runs are due to the continued bromine explosion in the “moist” run.
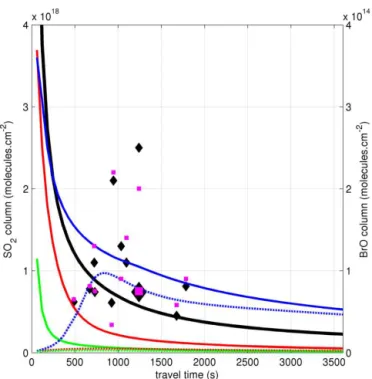
The model results can also be used to calculate vertical columns of BrO and SO2 (Fig. 10) and the corresponding
ratios (Fig. 11). These figures show these data over the first 60 min of plume evolution and are also overlayed with the spectroscopic observations listed in Table 5. Due to logis-tical constraints, we have concurrent near-crater and down-wind data only for 27 July; this datapoint is highlighted on Fig. 11. As can also be seen in Fig. 9, only the “moist” runs maintain significant amounts of volcanic bromine as BrO and show column BrO/SO2 ratios comparable with
mea-surements. Also notable is the rise in the column ratio in the “moist-withNOx” run after a few minutes. After
signifi-cant dilution of the plume has occurred, the dominance of the BrNO2reservoir diminishes. Thus volcanic NOx, if present,
delays but does not prevent in-plume reactive bromine chem-istry.
4.2 “High Br/S” modelled plume
The elemental emissions ratio of Etna is known to vary be-tween craters and over time (Aiuppa et al., 2005a). Figure 12 shows the evolution of modelled1O3for the six runs where
they have been initialised using the “high Br/S” ratios (see Table 4). Further plots relating to these are shown in the sup-plemental material to this paper (Figs. S1–S5 in the Supple-ment). As for the runs described previous, in order to ap-proximately reproduce the measured SO2 mixing ratios at
the crater rim (and those from the prior runs) an “initial dilu-tion” ratio was again used, in these runs it was set to a factor of 15×dilution.
The increase in the amount of volcanic bromine has a sig-nificant impact on the chemistry. In the NOx-free runs the
reactive bromine generated by the effective source region is sufficient to destroy almost all of the O3within the plume
and the plume chemistry is O3-limited. As can be seen in
Table 1 of the supplementary material, the NOx/S ratio is
very similar for the “low Br/S” and “high Br/S” cases. As a consequence the Br/NOx is very different, being 0.0875
in the “low Br/S” runs and 3.35 in the “high Br/S” runs. Whereas in the “low Br/S” runs with volcanic NOxalmost
all reactive Br had partitioned to BrNO2, in the
correspond-ing “high Br/S” the partitioning of the reactive bromine to BrNO2is more moderate and a significant amount of reactive
bromine in other forms remains. This results in moderate O3
depletion in the early plume, with similar variation between the humidity cases as discussed above.
4.3 Comparison with measured data
This modelling study shows that the plume chemistry is highly sensitive to several factors: the presence of volcanic NOx, the magnitude and composition of the primary volcanic
emissions, and heterogeneous processes which are dependant on aerosol and humidity. Any comparison between the model results and the measurements must be made with caution. The following points should be stressed:
– Volcanic volatile Br/S ratios are known to vary con-siderably both over time and between Etna’s different craters (Aiuppa et al., 2005a). The composition of the volcanic volatiles used in the “low Br/S” modelling study was based on measurements which were taken a month prior to the O3and SO2measurements. It is
Figure 9.Speciation of bromine for the six model scenarios discussed in the text (“low Br/S” initialisation). Red – Br; light green – BrO; dark green - HOBr; blue – Br2; yellow – BrNO2; grey – HBr.
– Over the time that measurements were taken, the mag-nitude and composition of the volcanic emissions may have varied significantly. This cannot be reproduced in the model.
– We focussed on model output from the plume core. However, the varying wind velocity at the measurement sites mean that sampling will have been from varying parts of the plume.
As such it is not possible to conclude definitively from the comparison of the measurement and modelling studies the exact chemical processes that were occurring within the plume at the time of the measurement campaign. Neverthe-less, the modelling study shows that the reactive bromine
generated in the effective-source region is sufficient to cause appreciable ozone depletion within the early plume, however the effect is stronger and more sustained when further reac-tive bromine can be generated by the bromine explosion.
The model runs which are the best fit for the near-crater O3and SO2measurements are not the same runs which best
match the BrO/SO2columns measured further downwind.
Figure 10.Evolution of vertical column SO2and BrO for the six model scenarios discussed in the text (“low Br/S” initialisation). SO2is plotted against the left axis scale in black (variation between the scenarios is minimal). The BrO columns are plotted against the right axis scale using the same colour code as in Fig. 7. The black diamonds represent the spectroscopic measurements of SO2, the magenta squares represent the spectroscopic measurements of BrO. The larger markers represent the 2012-07-27 measurement contem-poraneous with near-crater measurements of both O3and SO2.
5 Conclusions
In this study of chemical evolution in the plumes of Mount Etna during a passively degassing phase we have confirmed O3 depletion to occur less than a few minutes after
emis-sion. This extends the limited data set regarding volcanic O3
depletion and is the first data set to date based on ground-based data to include simultaneous measurements of O3and
a plume tracer. The depletion process is ongoing over this time period, and the data suggests it occurred at an approx-imately constant rate. For the Etna craters measured in late July 2012, this rate was found to be a depletion of approxi-mately 10−4molecules of O3per molecule of SO2(the inert
plume tracer) per second.
Substantial depletion of O3was observed within minutes
after emission, and occurred at very low humidities at which the heterogeneous processes of the bromine explosion would be significantly slowed. On the basis of this, an approxi-mately constant rate of ozone depletion (as a ratio of the inert tracer), and analysis of our modelling study we con-clude that most of the very reactive halogens that caused the observed O3 depletion within the 1–4 min old plume
were not a product of chemical cycling in the plume once
Figure 11.Evolution of vertical column BrO/SO2 ratios for the six model scenarios discussed in the text (“low Br/S” initialisa-tion). The colour code is the same as in Fig. 7. The black diamonds represent the spectroscopic measurements listed in Table 5, the red diamond represents the 2012-07-27 measurement contemporaneous with near-crater measurements of both O3and SO2.
it had emerged from the crater but rather generated in effec-tive source regions near the vents in high-temperature pro-cesses that ceased shortly after emission, and/or very fast low-temperature chemical processes within the crater. This is in agreement with the thermodynamic modelling studies of Gerlach (2004), Martin et al. (2009), and von Glasow (2010) which predict oxidised halogens being produced by high-temperature effective source regions in volcanoes. The in situ measurements in this study were taken at distances less than 500 m from the vents. Measurements of BrO/SO2at such
distances tend to be low compared to those measured further downwind (Bobrowski et al., 2007; Boichu et al., 2011). That substantial O3depletion can occur in such regions suggests
these low levels of reactive bromine (and possibly chlorine) species that are generated within the crater are sufficient to cause the O3depletion observed in this study.
We have also shown that further downwind, contem-poraneous spectroscopic observation of the plume shows BrO/SO2columns are within the typical range that has been
observed within volcanic plumes. Our near-crater measure-ments are therefore likely to be typical for Mount Etna in its passively degassing phase.
Results from our modelling study suggest that a signifi-cant factor influencing the bromine-ozone chemistry in the very early plume is the presence or absence of volcanic NOx
and, if it is present, its source strength relative to that of Br. The modelling study shows that volcanic NOxwould be
ex-pected to significantly retard early O3depletion and therefore
plume O3 and Br data could be compared to model output
to yield information on NOxwithin a plume. The measured
data from this campaign are insufficient to definitively as-certain whether or not volcanic NOxgeneration is occurring
but it appears unlikely to be the case as near-crater O3
deple-tion was observed whilst volcanic NOxemissions suppressed
such O3 depletion in the modelling study. The modelling
study also shows how variations in humidity, and the con-sequent variations in heterogeneous chemistry, may impact the plume chemistry in detectable ways. A comparison of the results from our three different humidity/heterogeneous chemistry cases gives an indication as to the extents that O3 depletion can be ascribed to reactive halogens
Appendix A: Proof that1O3/SO2is a measure of
chemical change only.
The following is a proof that 1A/ 1B cannot be changed by physical plume mixing processes, and thus any change observed in the ratio is the result of chemical change only.
Starting with a generic plume dispersal equation for a change in concentration due to mixing (von Glasow et al., 2003),
dc dt
mix
= − 1 Ap
Ap
dt(c−cbg) = −ω(c−cbg),
whereApis the cross-sectional area of the plume,ω=ω(t )
is the mixing parameter,candcbgare the concentration of the
species in the plume and the background air, respectively. Discretising,
δc δt
mix
= −ω(c−cbg).
Letcibe the concentration of the species at timeti:
c2=c1+
δc
δtδt=c1−ω(c1−cbg)δt.
We define 1ci=ci−cbg.
Therefore,
1c2=c1−ω(c1−cbg)δt−cbg
=1c1−1c1ωδt=1c1(1−ωδt ).
Taking the ratio of gas A and gas B, 1cA2
1c2B =1c
A
1(1−ωδt )
1cB1(1−ωδt ) =1c
A 1
1cB1.
In the volcanic case as in this study, A=O3and B=SO2.
The concentration of SO2outside of the plume is negligible
in comparison to in-plume measurements, SO2bg≈0 thus
1SO2=SO2and1O3/1SO2 =1O3/SO2. Therefore,
1O3,1
SO2,1
=1O3,2 SO2,2
.
Therefore, if no chemical change in O3occurs between time
The Supplement related to this article is available online at doi:10.5194/acp-15-2613-2015-supplement.
Acknowledgements. The authors would like to thank Istituto Nazionale di Geofisica e Vulcanologia (INGV) Palermo and Giancarlo Tamburello of the University of Palermo for field support on the July/August 2012 campaign and David Walter, MPI (Max Planck Institute) Mainz, Germany for help in June 2012. We would also like to thank colleagues at the University of East Anglia, in particular Ricky Herd, for their comments on the development of this paper. The campaign was funded by NERC project NE/G015600/1 and Luke Surl’s PhD studentship is NERC-funded. Nicole Bobrowski was supported financially by DFG project DFG BO3611/1-1. Allesandro Aiuppa acknowledges funding from the European Research Council under the European Union’s Seventh Framework Programme (FP7/2007/2013)/ERC grant agreement n1305377.
Edited by: R. Sander
References
Aiuppa, A., Federico, C., Franco, A., Giudice, G., Gurri-eri, S., Inguaggiato, S., Liuzzo, M., McGonigle, A. J. S., and Valenza, M.: Emission of bromine and iodine from Mount Etna volcano, Geochem. Geophy. Geosy., 6, Q08008, doi:10.1029/2005gc000965, 2005a.
Aiuppa, A., Inguaggiato, S., McGonigle, A., O’Dwyer, M., Oppen-heimer, C., Padgett, M., Rouwet, D., and Valenza, M.: H2S fluxes from Mt. Etna, Stromboli, and Vulcano (Italy) and implications for the sulfur budget at volcanoes, Geochim. Cosmochim. Ac., 69, 1861–1871, doi:10.1016/j.gca.2004.09.018, 2005b.
Aiuppa, A., Franco, A., von Glasow, R., Allen, A. G., D’Alessandro, W., Mather, T. A., Pyle, D. M., and Valenza, M.: The tropospheric processing of acidic gases and hydro-gen sulphide in volcanic gas plumes as inferred from field and model investigations, Atmos. Chem. Phys., 7, 1441–1450, doi:10.5194/acp-7-1441-2007, 2007.
Aiuppa, A., Shinohara, H., Tamburello, G., Giudice, G., Liuzzo, M., and Moretti, R.: Hydrogen in the gas plume of an open-vent vol-cano, Mount Etna, Italy, J. Geophys. Res.-Sol. Ea., 116, B10204, doi:10.1029/2011jb008461, 2011.
Aiuppa, A., Giudice, G., Liuzzo, M., Tamburello, G., Allard, P., Calabrese, S., Chaplygin, I., McGonigle, A. J. S., and Taran, Y.: First volatile inventory for Gorely volcano, Kamchatka, Geo-phys. Res. Lett., 39, L06307, doi:10.1029/2012gl051177, 2012. Bagnato, E., Aiuppa, A., Parello, F., Calabrese, S., D’Alessandro,
W., T.A., M., McGonigle, A., Pyle, D., and Wängberg, I.: De-gassing of gaseous (elemental and reactive) and particulate mer-cury from Mount Etna volcano (Southern Italy), Atmos. Envi-ron., 41, 7377–7388, doi:10.1016/j.atmosenv.2007.05.060, 2007. Bobrowski, N. and Giuffrida, G.: Bromine monoxide / sulphur dioxide ratios in relation to volcanological observations at Mt. Etna 2006–2009, Solid Earth, 3, 433–445, doi:10.5194/se-3-433-2012, 2012.
Bobrowski, N. and Platt, U.: SO2/BrO ratios studied in five volcanic plumes, J. Volcanol. Geoth. Res., 166, 147–160, doi:10.1016/j.jvolgeores.2007.07.003, 2007.
Bobrowski, N., Hönninger, G., Galle, B., and Platt, U.: Detection of bromine monoxide in a volcanic plume, Nature, 423, 273–276, doi:10.1038/nature01625, 2003.
Bobrowski, N., von Glasow, R., Aiuppa, A., Inguaggiato, S., Louban, I., Ibrahim, O. W., and Platt, U.: Reactive halogen chem-istry in volcanic plumes, J. Geophys. Res.-Atmos., 112, D06311, doi:10.1029/2006jd007206, 2007.
Boichu, M., Oppenheimer, C., Roberts, T. J., Tsanev, V., and Kyle, P. R.: On bromine, nitrogen oxides and ozone depletion in the tropospheric plume of Erebus volcano (Antarctica), Atmos. Envi-ron., 45, 3856–3866, doi:10.1016/j.atmosenv.2011.03.027, 2011. Cantrell, C. A.: Technical Note: Review of methods for linear least-squares fitting of data and application to atmospheric chemistry problems, Atmos. Chem. Phys., 8, 5477–5487, doi:10.5194/acp-8-5477-2008, 2008.
Delmelle, P., Delfosse, T., and Delvaux, B.: Sulfate, chloride and fluoride retention in Andosols exposed to volcanic acid emissions, Environ. Pollut., 126, 445–457, doi:10.1016/s0269-7491(03)00196-9, 2003.
Donovan, A., Tsanev, V., Oppenheimer, C., and Edmonds, M.: Reactive halogens (BrO and OClO) detected in the plume of Soufrière Hills Volcano during an eruption hiatus, Geochem. Geophy. Geosy., 15, 3346–3363, doi:10.1002/2014GC005419, 2014.
General, S., Bobrowski, N., Pöhler, D., Weber, K., Fischer, C., and Platt, U.: Airborne I-DOAS measurements at Mt. Etna: BrO and OClO evolution in the plume, J. Volcanol. Geoth. Res., doi:10.1016/j.jvolgeores.2014.05.012, in press, 2014.
Gerlach, T. M.: Volcanic sources of tropospheric ozone-depleting trace gases, Geochem. Geophy. Geosy., 5, Q09007, doi:10.1029/2004gc000747, 2004.
Hobbs, P. V., Tuell, J. P., Hegg, D. A., Radke, L. F., and Eltgroth, M. W.: Particles and Gases in the Emissions from the 1980–1981 Volcanic-Eruptions of Mt St-Helens, J. Geophys. Res.-Oc. Atm., 87, 1062–1086, doi:10.1029/JC087iC13p11062, 1982.
Hörmann, C., Sihler, H., Bobrowski, N., Beirle, S., Penning de Vries, M., Platt, U., and Wagner, T.: Systematic investigation of bromine monoxide in volcanic plumes from space by using the GOME-2 instrument, Atmos. Chem. Phys., 13, 4749–4781, doi:10.5194/acp-13-4749-2013, 2013.
Kaschka, T.: Chemical modelling of volcanic plumes, Diplomar-beit, Universität Heidelberg, Germany, 2007.
Kelly, P. J., Kern, C., Roberts, T. J., Lopez, T., Werner, C., and Aiuppa, A.: Rapid chemical evolution of tropospheric volcanic emissions from Redoubt Volcano, Alaska, based on observations of ozone and halogen-containing gases, J. Volcanol. Geoth. Res., 259, 317–333, doi:10.1016/j.jvolgeores.2012.04.023, 2013. Kern, C., Sihler, H., Vogel, L., Rivera, C., Herrera, M., and Platt, U.:
Halogen oxide measurements at Masaya Volcano, Nicaragua us-ing active long path differential optical absorption spectroscopy, B. Volcanology, 71, 659–670, doi:10.1007/s00445-008-0252-8, 2009.
Lee, C., Kim, Y. J., Tanimoto, H., Bobrowski, N., Platt, U., Mori, T., Yamamoto, K., and Hong, C. S.: High ClO and ozone depletion observed in the plume of Sakurajima volcano, Japan, Geophys. Res. Lett., 32, L21809, doi:10.1029/2005gl023785, 2005. Martin, R. S., Mather, T. A., and Pyle, D. M.: High-temperature
mixtures of magmatic and atmospheric gases, Geochem. Geo-phys. Geosyst., 7, Q04006, doi:10.1029/2005GC001186, 2006. Martin, R. S., Roberts, T. J., Mather, T. A., and Pyle, D. M.: The
im-plications of H2S and H2kinetic stability in high-T mixtures of magmatic and atmospheric gases for the production of oxidized trace species (e.g., BrO and NOx), Chem. Geol., 263, 143–150, doi:10.1016/j.chemgeo.2008.12.028, 2009.
Martin, R. S., Ilyinskaya, E., and Oppenheimer, C.: The enigma of reactive nitrogen in volcanic emissions, Geochim. Cosmochim. Ac., 95, 93–105, doi:10.1016/j.gca.2012.07.027, 2012.
Martin, S. T., Schlenker, J. C., Malinowski, A., Hung, H.-M., and Rudich, Y.: Crystallization of atmospheric sulfate-nitrate-ammonium particles, Geophys. Res. Lett., 30, 2102, doi:10.1029/2003GL017930, 2003.
McGonigle, A. J. S., Delmelle, P., Oppenheimer, C., Tsanev, V. I., Delfosse, T., Williams-Jones, G., Horton, K., and Mather, T. A.: SO2depletion in tropospheric volcanic plumes, Geophys. Res. Lett., 31, L13201, doi:10.1029/2004gl019990, 2004.
Neri, M., Casu, F., Acocella, V., Solaro, G., Pepe, S., Barardino, P., Sansosti, E., Caltabiano, T., Lundgren, P., and Lanari, R.: Deformation and eruptions at Mt. Etna (Italy): A lesson from 15 years of observations, Geophys. Res. Lett., 36, L02309, doi:10.1029/2008GL036151, 2009.
Oppenheimer, C., Tsanev, V. I., Braban, C. F., Cox, R. A., Adams, J. W., Aiuppa, A., Bobrowski, N., Delmelle, P., Bar-clay, J., and McGonigle, A. J. S.: BrO formation in vol-canic plumes, Geochim. Cosmochim. Ac., 70, 2935–2941, doi:10.1016/j.gca.2006.04.001, 2006.
Oppenheimer, C., Kyle, P., Eisele, F., Crawford, J., Huey, G., Tanner, D., Kim, S., Mauldin, L., Blake, D., Beyersdorf, A., Buhr, M., and Davis, D.: Atmospheric chemistry of an Antarc-tic volcanic plume, J. Geophys. Res.-Atmos., 115, D04303, doi:10.1029/2009jd011910, 2010.
Pyle, D. M. and Mather, T. A.: Halogens in igneous pro-cesses and their fluxes to the atmosphere and oceans from volcanic activity: A review, Chem. Geol., 263, 110–121, doi:10.1016/j.chemgeo.2008.11.013, 2009.
Roberts, T. J., Braban, C. F., Martin, R. S., Oppenheimer, C., Adams, J. W., Cox, R. A., Jones, R. L., and Grif-fiths, P. T.: Modelling reactive halogen formation and ozone depletion in volcanic plumes, Chem. Geol., 263, 151–163, doi:10.1016/j.chemgeo.2008.11.012, 2009.
Roberts, T. J., Martin, R. S., and Jourdain, L.: Reactive bromine chemistry in Mount Etna’s volcanic plume: the influence of total Br, high-temperature processing, aerosol loading and plume-air mixing, Atmos. Chem. Phys., 14, 11201–11219, doi:10.5194/acp-14-11201-2014, 2014.
Roine, A.: HSC chemistry 6.1., Outotec, available at: http://www. outotec.com/en/Products--services/HSC-Chemistry/, 2007. Saiz-Lopez, A. and von Glasow, R.: Reactive halogen
chem-istry in the troposphere, Chem. Soc. Rev., 41, 6448–6472, doi:10.1039/c2cs35208g, 2012.
Schumann, U., Weinzierl, B., Reitebuch, O., Schlager, H., Minikin, A., Forster, C., Baumann, R., Sailer, T., Graf, K., Mannstein, H.,
Voigt, C., Rahm, S., Simmet, R., Scheibe, M., Lichtenstern, M., Stock, P., Rüba, H., Schäuble, D., Tafferner, A., Rautenhaus, M., Gerz, T., Ziereis, H., Krautstrunk, M., Mallaun, C., Gayet, J.-F., Lieke, K., Kandler, K., Ebert, M., Weinbruch, S., Stohl, A., Gasteiger, J., Groß, S., Freudenthaler, V., Wiegner, M., Ansmann, A., Tesche, M., Olafsson, H., and Sturm, K.: Airborne observa-tions of the Eyjafjalla volcano ash cloud over Europe during air space closure in April and May 2010, Atmos. Chem. Phys., 11, 2245–2279, doi:10.5194/acp-11-2245-2011, 2011.
Seinfeld, J. H. and Pandis, S. N.: Atmospheric Chemistry and Physics, John Wiley & Sons, New York, Chichester, Weinheim, 2006.
Stutz, J. and Platt, U.: Numerical analysis and estimation of the sta-tistical error of differential optical absorption spectroscopy mea-surements with least-squares methods, Appl. Optics, 35, 6041– 6053, doi:10.1364/ao.35.006041, 1996.
Symonds, R. B., Rose, W. I., Bluth, G. J. S., and Gerlach, T. M.: Volcanic gas studies – methods, results, and applications, vol. 30 of Reviews in Mineralogy, 1–66, Mineralogical Society of Amer-ica, USA, 1994.
Theys, N., De Smedt, I., Van Roozendael, M., Froidevaux, L., Clarisse, L., and Hendrick, F.: First satellite detection of volcanic OClO after the eruption of Puyehue-Cordón Caulle, Geophys. Res. Lett., 41, 667–672, doi:10.1002/2013GL058416, 2014. US EPA: Laboratory study to explore potential interferences to air
quality monitors, Research Triangle Park, N.C. : The United States Environmental Protection Agency, Office of Air Qual-ity Planning and Standards, Research Triangle Park, NC 27711, EPA-454/C-00-002, 1999.
van Roozendael, M. and Fayt, C.: WinDOAS 2.1 Software User Manual, BIRA-IASB, available at: http://bro.aeronomie.be/ WinDOAS-SUM-210b.pdf, 2001.
Vance, A., McGonigle, A. J. S., Aiuppa, A., Stith, J. L., Turn-bull, K., and von Glasow, R.: Ozone depletion in tropo-spheric volcanic plumes, Geophys. Res. Lett., 37, L22802, doi:10.1029/2010GL044997, 2010.
von Glasow, R.: Atmospheric chemistry in volcanic plumes, P. Natl. Acad. Sci. USA, 107, 6594–6599, doi:10.1073/pnas.0913164107, 2010.
von Glasow, R., Lawrence, M. G., Sander, R., and Crutzen, P. J.: Modeling the chemical effects of ship exhaust in the cloud-free marine boundary layer, Atmos. Chem. Phys., 3, 233–250, doi:10.5194/acp-3-233-2003, 2003.
von Glasow, R., Bobrowski, N., and Kern, C.: The effects of vol-canic eruptions on atmospheric chemistry, Chem. Geol., 263, 131–142, doi:10.1016/j.chemgeo.2008.08.020, 2009.
Wennberg, P.: Atmospheric chemistry – Bromine explosion, Nature, 397, 299–301, doi:10.1038/16805, 1999.
Wesely, M.: Parameterization of surface resistances to gaseous dry deposition in regional-scale numerical models, Atmos. Environ., 23, 1293–1304, doi:10.1016/0004-6981(89)90153-4, 1989. Wittmer, J., Bobrowski, N., Liotta, M., Giuffrida, G., Calabrese,