Genetic differentiation of
Macrodon ancylodon
(Sciaenidae, Perciformes)
populations in Atlantic coastal waters of South America as revealed by
mtDNA analysis
Simôni Santos, Horacio Schneider and Iracilda Sampaio
Núcleo de Estudos Costeiros, Campus Universitário de Bragança, Universidade Federal do Pará,
Pará, Brazil.
Abstract
The king weakfish (pescada-gó in Portuguese - Macrodon ancylodon (Sciaenidae), a demersal (bottom-feeding) species found in South America Atlantic coastal waters from the Gulf of Paria in Venezuela to Baia Blanca in Argentina, is an economically important species because of its abundance and wide acceptance by consumers. Because of its wide distribution this fish may be subject to geographic isolation and this may have resulted in distinct populations along its coastal range. Considering that this species represents an important economic resource, confirmation of whetherM. ancylodon is a single species or there are different genetic stocks spread over its wide distribution would be an important contribution to conservation policies and population management of the king weakfish. To investigate differences between king weakfish populations we used the cytochromeb and 16S rRNA genes to characterizeM. ancylodon specimens caught throughout its South American range from Venezuela to Argentina. Our results clearly distinguished two genetically different groups which show nucleotide divergence and genetic structuring patterns that strongly suggest they may be different species, disagreeing with the widely accepted traditional taxonomy that accepts only one species ofMacrodon in the western Atlantic.
Key words: Macrodon ancylodon, Sciaenidae, Perciformes, 16S rRNA, cytochromeb, genetic differentiation.
Received: August 29, 2002; accepted: February 6, 2003.
Introduction
The family Sciaenidae contains about 70 genera and 270 species and is an important world fish resource (Nel-son, 1984), this family being represented in South Atlantic waters by about 21 genera and 57 species, of which more than 30 are found along the Brazilian coast. A member of this family, Macrodon ancylodon Bloch and Schneider, 1801 (The king weakfish,pescada-góin Portuguese) is a demersal (bottom-feeding) marine species found in South American Atlantic coastal waters from the Gulf of Paria in Venezuela to Baia Blanca in Argentina and is economically important because of its abundance and wide consumer ac-ceptance (Cervigón, 1993; Haimovici et al., 1996; Isaac and Braga, 1999).
Because of its wide distribution,M. ancylodonmay be subject to geographic isolation with the consequent for-mation of distinct populations. In a study of the meristic and morphometric traits ofM. ancylodoncaught in south-eastern and southern coastal waters of Brazil between latitudes 18°36’ S and 32°10’ S, Yamaguti (1979)
distin-guished fourM. ancylodonpopulations with different mo-saic patterns and spawning periods and restricted migration patterns, and suggested that there might be low gene flow between the populations and that geographic differentiation in the area studied might be caused by distinct environmen-tal characteristics such as temperature and salinity. How-ever, despite these meristic and morphometric findings genetic differentiation betweenM. ancylodonpopulations has not yet been investigated.
According to Brandini et al. (1997) differences in coastal geomorphology and oceanography influence the environmental characteristics of coastal waters as well as the composition, spatial distribution and temporal dynam-ics of the marine organisms which occur in such areas. At-lantic coastal waters of South America have distinct geomorphology and oceanographic features, with the dis-tribution of coastal fishes in the western Atlantic being in-fluenced by the discharge of large rivers and oceanic currents such as the North Brazil (Guyana), Brazil and Falklands currents as well as resurgence zones (Castro and Miranda, 1998; Palacio, 1982, Cervigónet al., 1993). In marine environments the geographic structure of popula-tions may be influenced by local environmental condipopula-tions and the life history of the species, hence the potential for
Genetics and Molecular Biology, 26, 2, 151-161 (2003) Copyright by the Brazilian Society of Genetics. Printed in Brazil www.sbg.org.br
species dispersal does not always predict the amount of gene flow between geographically separated populations (Burton, 1983; Palumbi, 1995). Several factors are known to influence the dispersion of marine species (Palumbi, 1995), including spawning behavior, sharp temperature changes, salinity gradients and larval retention mechanisms (Sinclair, 1988). The geographical structure of a species is due not only to present gene flow but, more importantly, to historical gene flow between geographically separate popu-lations (Slatkin, 1993).
Mitochondrial DNA has been extensively studied in fish and techniques based on mitochondrial DNA success-fully applied to taxonomic questions, the well characterized cytochromebgene having been particularly useful for the analysis of the relationship between recently diverged taxa such as populations and species (Stepien and Kocher, 1997) as well as being one of the genes most studied in fish sys-tematics and Perciformes phylogeography (Roe et al., 1997; Briolayet al., 1998; Durandet al.,1999; Allergruci et al., 1999; Akihito et al., 2000; Farias et al., 2001; Streelmanet al., 2002; Galboet al., 2002). The 16S rRNA mitochondrial gene has also been shown to be a good marker to differentiate fish species, and has been used in comparative intergeneric and interspecific studies in sev-eral families of Perciformes (Ritchieet al.,1997; Tringali et al.,1999; Bernardiet al.,2000; Hanel and Sturmbauer, 2000; Fariaset al.,2000; Craiget al.,2001; Streelmanet al.,2002).
For any species, the success of conservation pro-grams and the creation of effective management policies depends on determining the levels of genetic divergence within and between populations and developing strategies to maintain genetic diversity. BecauseM. ancylodonis an important economic resource, confirmation of whether or not it is a single species in the western Atlantic or whether different genetic stocks occur in over its wide distribution would represent a great contribution to conservation poli-cies and population management. In the work reported in this paper, we used cytochromeband 16S rRNA genes to characterizeM. ancylodonpopulations throughout the geo-graphic distribution of this species in South American coastal waters. The results clearly show two genetically dif-ferent groups which have nucleotide divergence levels and genetic structuring patterns that suggest they may be differ-ent species, disagreeing with the traditional taxonomic sys-tem which allocates only one species to the genus Macrodonin the western Atlantic.
Materials and Methods
Sampling
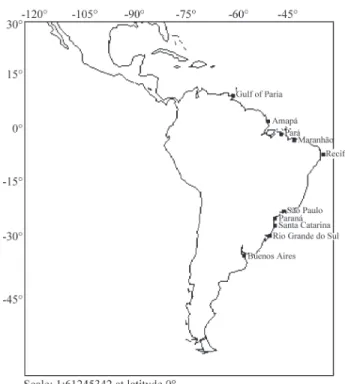
A total of 69Macrodon ancylodonBloch and Schnei-der 1801 specimens were collected from the northern ex-treme of its range off the coast of Venezuela (five specimens), the coastal waters of eight Brazilian states
(Amapá, Pará, Maranhão, Pernambuco, São Paulo, Paraná, Santa Catarina and Rio Grande do Sul) (59 specimens) and from its southern limit off the coast of Argentina (five spec-imens) (Figure 1). The fish were identified according to the descriptions of Menezes and Figueiredo (1980) and Cervigónet al. (1993) and muscle tissue fragments col-lected and conserved in absolute alcohol or frozen in a freezer until DNA extraction.
DNA extraction, amplification and sequencing
Total DNA was isolated by the standard ribonuclease/ proteinase/phenol/chloroform extraction method, followed by precipitation by sodium acetate/isopropanol (Sambrook et al.,1989). The polymerase chain reaction (Mullis and Faloona, 1987) was used to amplify≈500 base pair (bp) fragments of mitochondrial 16S ribosomal (16Sr) RNA and
≈800 bp fragments of the cytochrome b gene, Table 1 showing the primers and amplification conditions. Each 100µL reaction mixture contained 16µL DNTP (5 mM), 10µL buffer solution (10x), 8µL MgCl2(25 mM), 1µL of
each primer (200 ng/µL), 3-5µL of sample DNA, 1U Taq DNA polymerase and sufficient purified water to complete the final volume (All reagents from Gibco BRL, USA). The PCR product was purified using the ExoSAP-IT enzyme (Amersham Pharmacia Biotech Inc., UK.) and sequenced by the chain-termination method (Sangeret al., 1977) using the ABI PrismTMDye Terminator Cycle Sequencing Read-ing Reaction ‘Big Dye kit’ (Applied Biosystems, USA) fol-lowing the manufacturer’s instructions, the sequencing primers being the same as those used for the PCR. An
nal 5’-CATTGGAGTAGTACTCTTCC-3’ primer (GoCitbint, designed by I. Sampaio (pers. comm.)) was used to complete the 810 bp cytochromeb sequence. Se-quencing was performed in an automatic ABI 377 se-quencer (Perkin Elmer) using a fast 3.5 h run at 2400 V. The nucleotide sequence data determined for the present paper was deposited in GenBank under accession numbers AY253536-AY253656.
Phylogenetic analyses
Sequences were aligned by eye and edited in the XESEE program (Eyeball Sequence Editor, Cabot and Beckenbach, 1989). A Paretroplus polyactis (Cichlidae) cytochrome b sequence (Genbank AF370628) and a Cynoscion arenarius (Sciaenidae) 16S rRNA sequence (AF081679) were used as outgroups in the phylogenetic analyses which was accomplished using the molecular evo-lutionary genetics analysis (MEGA) version 2.0 (Kumaret al., 2001) and phylogenetic analysis using parsimony (PAUP*) version 4.0 (Swofford, 2002) programs, the data analysis in molecular biology and evolution (DAMBE) program (Xia and Xie, 2001) being used to perform the sat-uration test and the MODELTEST program 3.06 version (Posada and Crandall, 1998) to choose the nucleotide sub-stitution models suitable for this study. Estimation of the number of nucleotide substitutions was conducted for both genes using the method of Tamura and Nei (1993), the pa-rameter of the gamma distribution (0.2752) being used only for the cytochromebgene. Cladograms reflecting similari-ties between the populations were constructed using the distance matrix and maximum-parsimony techniques, dele-tions and inserdele-tions being treated as a fifth base in the parsi-mony analyses. The length of the trees (L), consistency index (CI), re-scaled consistency index (RC) and the homoplasy index (HI) were estimated for each case. The degree of confidence for the groups on the maximum-parsimony tree was evaluated by 1000 bootstrap replicates (Felsenstein, 1985).
Correlation between genetic distance and geographic distance
The Mantel clustering test, with 1000 permuta-tions, was used to assess the correlation between the ge-netic distance and the geographic distance between populations (Mantel, 1967) using the Genetix program 4.02 version (Belkhir, 2001). Only the cytochrome b
gene was used in this type of analysis, the genetic dis-tance matrix being obtained using the method of Tamura and Nei (1993) and the geographic distance matrix con-structed by transforming the latitude of the geographic coordinates of the sample points into kilometers, with the help of a program available on the site www.vsp.usp.br/ grass/coop.html.
Results
Nucleotide composition
Table 2 shows that 29 different cytochrome b se-quences were obtained from 53M. ancylodonspecimens, 766 of the 810 aligned sites being constant, 44 variable and 33 phylogenetically informative for parsimony. The nucle-otide composition of the cytochrome b sequences was 23.6% adenine, 28.8% thymine, 32.8% cytosine and 14.8% guanine. A transition/transversion rate of 2.4 was observed in the first codon position, 1.6 in the second position and 3.0 in the third position, while the mean rate of transi-tion/transversion substitution considering all the positions of the codon was 2.8.
Table 3 shows that 14 different 16S rRNA gene se-quences were obtained from 68M. ancylodonspecimens, 14 of the 520 alignment sites being variable and 12 phylo-genetically informative for parsimony. The mean base composition of this gene was 28.7% adenine, 23.6% thy-mine, 24.4% cytosine and 23.4% guanine, and the transi-tion/transversion rate was 3.
Nucleotide divergence
Tables 4 and 5 present the nucleotide divergence ma-trices constructed using the method of Tamura and Nei (1993) for the two segments analyzed in the present study. The nucleotide divergence within each locality sampled was less than 1% for both genes. However, genetic dis-tances between tropical (Venezuela to Pernambuco) and subtropical (São Paulo to Argentina) groups varied from 3.2% to 4.3% for the cytochromebgene and from 2.0% to 2.4% for the 16S rRNA gene.
Figure 2 shows 24 nucleotide sites (45, 46, 55, 138, 174, 189, 198, 219, 234, 258, 270, 285, 321, 327, 372, 375, 414, 456, 457, 504, 558, 621, 627,726) in the cytochromeb gene that can be clearly distinguished in the tropical and subtropicalMacrodongroups. Site 264 could also be con-sidered a good marker, as all the individuals of the tropical
Genetic differentiation ofMacrodonrevealed by mtDNA 153
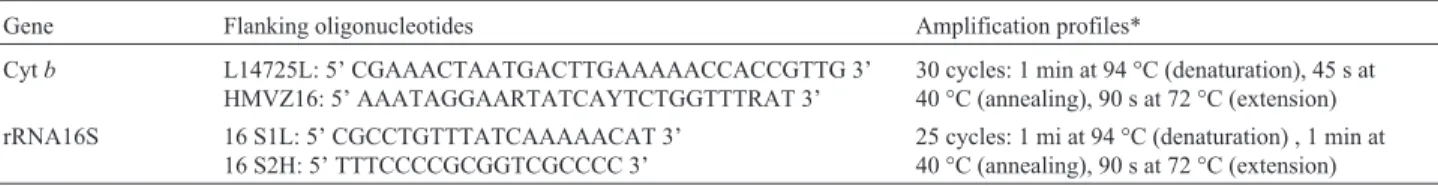
Table 1- PCR conditions for isolating cytochromeband 16S rRNA genes ofMacrodon ancylodon.
Gene Flanking oligonucleotides Amplification profiles*
Cytb L14725L: 5’ CGAAACTAATGACTTGAAAAACCACCGTTG 3’ HMVZ16: 5’ AAATAGGAARTATCAYTCTGGTTTRAT 3’
30 cycles: 1 min at 94 °C (denaturation), 45 s at 40 °C (annealing), 90 s at 72 °C (extension) rRNA16S 16 S1L: 5’ CGCCTGTTTATCAAAAACAT 3’
16 S2H: 5’ TTTCCCCGCGGTCGCCCC 3’
25 cycles: 1 mi at 94 °C (denaturation) , 1 min at 40 °C (annealing), 90 s at 72 °C (extension)
group possess adenine, while the nucleotide sites (except for RS2 and ARG3) from the subtropical group possess guanine. Similarly, Figure 3 shows the 11 diagnostic sites (4, 19, 30, 35, 93, 112, 124, 244, 269, 281, 373) of the 16S rRNA gene which differentiate the twoMacrodongroups.
Phylogenetic analyses
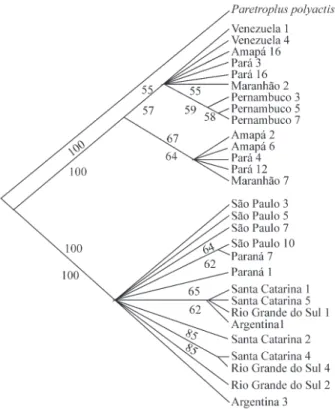
The two DNA segments studied did not show any in-dication of saturation in their sequences, so that both could be used in the phylogenetic analyses. Maximum-parsimony analyses considering all the taxa and the three codon posi-tions of the cytochromebgene resulted in six equally parsi-monious trees (L = 193, CI = 0.964, RC = 0.945, HI = 0.036) and the consensus tree shown in Figure 4, while analysis of the 16S rRNA gene resulted in the single most-parsimonious tree (L = 50; CI = 0.98; RC = 0.964, HI = 0.02) shown in Figure 5. The maximum-parsimony
and neighbor-joining trees for the two genes presented ba-sically the same topology, showing two distinct clades (Figures 4 and 5), one clade included the specimens from the tropical group (Venezuela to Pernambuco) and the other included the populations from the subtropical group (São Paulo to Argentina). All the groupings were supported by significant bootstrap values greater than 93%.
Because of the low population genetic variability in the 16S rRNA and cytochrome b genes, clearly defined subgroups could not be identified in the tropical and sub-tropical groups either in the neighbor-joining or maxi-mum-parsimony trees, so that that each group formed a highly polytomous clade.
Geographic distance versus genetic distance
The Mantel test used to assess the correlation between the genetic distances (of the cytochromebgene) and geo-graphic distances of the populations sampled resulted showed high correlation (r = 0.852), these results showing that there is a significant correlation (p) between geo-graphic and genetic distances but only for the two main groups (tropical and subtropical) not for populations inside each group.
Discussion
Genetic characterization ofM. ancylodon
From a commercial point of view,M. ancylodonis one of the most important Sciaenidae species found in South American Atlantic coastal waters, especially those off the northern and southern coasts of Brazil. Genetic
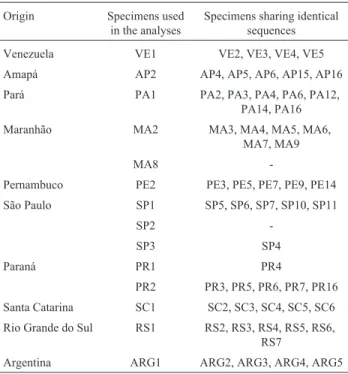
char-Table 3- Specimens of Macrodonancylodon whose 16S rRNA was analyzed.
Origin Specimens used in the analyses
Specimens sharing identical sequences
Venezuela VE1 VE2, VE3, VE4, VE5 Amapá AP2 AP4, AP5, AP6, AP15, AP16
Pará PA1 PA2, PA3, PA4, PA6, PA12, PA14, PA16 Maranhão MA2 MA3, MA4, MA5, MA6,
MA7, MA9
MA8
-Pernambuco PE2 PE3, PE5, PE7, PE9, PE14
São Paulo SP1 SP5, SP6, SP7, SP10, SP11
SP2
-SP3 SP4
Paraná PR1 PR4
PR2 PR3, PR5, PR6, PR7, PR16
Santa Catarina SC1 SC2, SC3, SC4, SC5, SC6 Rio Grande do Sul RS1 RS2, RS3, RS4, RS5, RS6,
RS7
Argentina ARG1 ARG2, ARG3, ARG4, ARG5 Table 2- Specimens ofMacrodonancylodon whose cytochromebwas
analyzed.
Origin Specimens used in the analyses
Specimens sharing identical sequences
Venezuela VE1 VE2, VE3, VE5
VE4
-Amapá AP2
-AP6
-AP16 AP15, AP4, AP3
Pará PA3 PA14
PA4
-PA12
-PA16
-Maranhão MA2 MA3, MA4, MA5, MA6, MA9
MA7
-Pernambuco PE3 PE9
PE5 PE14
PE7
-São Paulo SP3
-SP5
-SP7
-SP10 SP11
Paraná PR1 PR5
PR7 PR6, PR16
Santa Catarina SC1
-SC2
-SC4
-SC5 SC6
Rio Grande do Sul RS1 RS6, RS7
RS2
-RS4
-Argentina ARG1 ARG2, ARG4, ARG5
-Genetic
differentiation
of
Macrodon
revealed
by
mtDNA
155
Table 4- Pairwise nucleotide divergence matrix estimated according to Tamura & Nei (1993) based on 810 base pairs of the cytochrome b gene for 29 sequences ofMacrodon.
Out VE 1
VE 4
AP 2
AP 6
AP 16
PA 3
PA 4
PA 12
PA 16
MA 2
MA 7
PE 3
PE 5
PE 7
SP 3
SP 5
SP 7
SP 10
PR 1
PR 7
SC 1
SC 2
SC 4
SC 5
RS 1
RS 2
RS 4
ARG 1
Outgroup
Venezuela1 22.5
Venezuela4 23.0 0.2
Amapá2 22.8 0.4 0.6
Amapá6 22.8 0.4 0.6 0.2
Amapá16 22.5 0.0 0.2 0.4 0.4
Pará3 22.5 0.0 0.2 0.4 0.4 0.0
Pará4 22.7 0.4 0.6 0.2 0.2 0.4 0.4
Pará12 22.6 0.2 0.5 0.1 0.1 0.2 0.2 0.1
Pará16 22.7 0.1 0.4 0.5 0.5 0.1 0.1 0.5 0.4
Maranhão2 22.5 0.0 0.2 0.4 0.4 0.0 0.0 0.4 0.2 0.1
Maranhão7 22.6 0.2 0.5 0.1 0.1 0.2 0.2 0.1 0.0 0.4 0.2
Pernambuco3 22.5 0.1 0.4 0.5 0.5 0.1 0.1 0.5 0.4 0.2 0.1 0.4
Pernambuco5 22.2 0.4 0.6 0.7 0.7 0.4 0.4 0.7 0.6 0.5 0.4 0.6 0.2
Pernambuco7 22.3 0.6 0.9 1.0 1.0 0.6 0.6 1.0 0.9 0.7 0.6 0.9 0.5 0.5
São Paulo3 22.8 3.4 3.7 3.6 3.6 3.4 3.4 3.6 3.4 3.6 3.4 3.4 3.6 3.7 4.1
São Paulo5 23.0 3.7 3.9 3.8 3.8 3.7 3.7 3.8 3.7 3.7 3.7 3.7 3.8 3.9 4.3 0.4
São Paulo7 22.6 3.3 3.6 3.4 3.4 3.3 3.3 3.4 3.3 3.4 3.3 3.3 3.4 3.6 4.0 0.1 0.3
São Paulo10 22.4 3.4 3.7 3.6 3.6 3.4 3.4 3.6 3.4 3.6 3.4 3.4 3.6 3.7 4.1 0.2 0.4 0.1
Paraná1 22.6 3.3 3.6 3.4 3.4 3.3 3.3 3.4 3.3 3.4 3.3 3.3 3.4 3.6 4.0 0.1 0.3 0.0 0.1
Paraná7 22.4 3.4 3.7 3.6 3.6 3.4 3.4 3.6 3.4 3.6 3.4 3.4 3.6 3.7 4.1 0.2 0.4 0.1 0.0 0.1
Santa Catarina1 22.6 3.6 3.9 3.7 3.7 3.6 3.6 3.7 3.6 3.7 3.6 3.6 3.7 3.8 4.0 0.4 0.5 0.2 0.4 0.2 0.4
Santa Catarina2 22.4 3.2 3.5 3.3 3.3 3.2 3.2 3.3 3.2 3.3 3.2 3.2 3.3 3.4 3.8 0.2 0.4 0.1 0.2 0.1 0.2 0.4
Santa Catarina4 22.7 3.4 3.7 3.6 3.6 3.4 3.4 3.6 3.4 3.6 3.4 3.4 3.6 3.7 4.1 0.4 0.5 0.2 0.4 0.2 0.4 0.5 0.4
Santa Catarina5 22.6 3.5 3.7 3.6 3.6 3.5 3.5 3.6 3.4 3.5 3.5 3.4 3.6 3.7 4.1 0.2 0.4 0.1 0.2 0.1 0.2 0.1 0.2 0.4
Rio Grande do Sul1 22.6 3.4 3.7 3.6 3.6 3.4 3.4 3.6 3.4 3.6 3.4 3.4 3.6 3.7 4.1 0.2 0.4 0.1 0.2 0.1 0.2 0.1 0.2 0.4 0.0
Rio Grande do Sul2 22.6 3.2 3.5 3.3 3.3 3.2 3.2 3.3 3.2 3.3 3.2 3.2 3.3 3.4 3.8 0.2 0.4 0.1 0.2 0.1 0.2 0.4 0.2 0.4 0.2 0.2
Rio Grande do Sul4 22.8 3.4 3.7 3.6 3.6 3.4 3.4 3.6 3.4 3.6 3.4 3.4 3.6 3.7 4.1 0.4 0.5 0.2 0.4 0.2 0.4 0.5 0.4 0.0 0.4 0.4 0.4
Argentina1 22.6 3.4 3.7 3.6 3.6 3.4 3.4 3.6 3.4 3.6 3.4 3.4 3.6 3.7 4.1 0.2 0.4 0.1 0.2 0.1 0.2 0.1 0.2 0.4 0.0 0.0 0.2 0.4
acterization of species of commercial interest is a primary condition for any fishing control policy, the study described in this paper being the first on the molecular characteriza-tion of theM. ancylodonpopulations throughout their geo-graphic distribution. When the three cytochromeb codon positions were analyzed separately they differed greatly in base composition, the first position showing no bias but the second and third positions exhibiting a strong tendency to-wards decreased guanine content, this being especially true for the third codon where the guanine composition was only 5%. These values are similar to results obtained in sev-eral other groups of fish (Fariaset al.,2001; Durandet al., 1999; Johns and Avise, 1998; Briolay et al., 1998; Allergruciet al.,1999; Roeet al.,1997). Saturation was not observed in the 16S rRNA sequences.
Genetic differences in theMacrodonpopulations
The nucleotide divergence of the cytochromeb and 16S rRNA genes was very low at the interpopulational level (< 1%) and this was randomly distributed in the tropi-cal and subtropitropi-cal clades. Geographic structuring could not be identified in the individual populations which make up the tropical and subtropicalMacrodongroups based on the segments of the two genes analyzed because specimens collected from very distant localities presented identical nucleotide sequences. Taking the genetic divergence re-sults for the cytochromebgene as an example, specimens from Venezuela (VE1), Amapá (AP16), Pará (PA3) and Maranhão (MA2) had sequences which were 100% similar (Table 4) and the results for the 16S rRNA gene were simi-lar (Table 5), suggesting that there are no barriers prevent-ing continuous genetic flow between the populations within each group. The low nucleotide divergence values
for the two genes are often observed in closely related taxa, our results with the cytochromeb gene being similar to population studies on fish such as Dicentrarchus labrax (Allergruci et al., 1999) and Epinephelus marginatus (Gilleset al.,2000).
When we compared the nucleotide sequences of the tropical Macrodon group with the subtropical group we found, surprisingly, high nucleotide divergence, with val-ues reaching 4.3% for the cytochromebgene and 2.6% for the 16S rRNA gene. Twenty-five sites of the 810 bp of the cytochromebgene and 11 of the 520 bp of the 16S rRNA gene are diagnostic in terms of separating the tropical and subtropicalMacrodongroups (Figures 2 and 3), nucleotide divergence being of the same magnitude as the values de-tected for intrageneric comparisons in Perciformes. For the cytochromebgene close-related species ofSelene(Selene setapinis, S. orstedi and S. dorsalis, Carangidae) and Scarus (Scarus coelestinus and S. guacamaia, Scaridae) show nucleotide divergence values varying from 2% to 4% (Reedet al., 2001; Streelmanet al., 2002). Additionally, the 16S rRNA shows divergences varying from 1 to 4% be-tween different Perciformes species of the same genus as observed in the centropomidCentropomus(Tringaliet al., 1999), in the cichlidsGeophagus,Satanoperca,Retroclus andAequidens(Fariaset al.,2000), in the sparidsDentex, Diplodus, Pagellus and Pagrus (Hanel and Sturmbauer, 2000), in the pomacentrids Stegastes, Pomacentrus, Chromis, AmphriprionandAbudefduf(Tang, 2001), in the scaridsChororus, ScarusandSparisoma(Bernardi et al., 2000; Streelmanet al., 2002) and the serranidsEpinephelus (Craiget al.,2001). The level of variation detected by us between the tropical and subtropicalMacrodon groups is
Table 5- Pairwise nucleotide divergence matrix estimated according to Tamura & Nei (1993) based on 520 base pairs of the 16S rRNA gene for 14 sequences ofMacrodon.
Out VE AP PA MA2 MA8 PE SP1 SP2 SP3 PR1 PR2 SC RS
Outgroup
Venezuela 8.6
Amapá 8.6 0.0
Pará 8.6 0.0 0.0
Maranhão2 8.6 0.0 0.0 0.0
Maranhão8 8.8 0.2 0.2 0.2 0.2 Pernambuco 8.6 0.0 0.0 0.0 0.0 0.2
São Paulo1 8.6 2.2 2.2 2.2 2.2 2.4 2.2 São Paulo2 8.3 2.4 2.4 2.4 2.4 2.6 2.4 0.2 São Paulo3 8.3 2.0 2.0 2.0 2.0 2.2 2.0 0.2 0.4
Paraná1 8.3 2.0 2.0 2.0 2.0 2.2 2.0 0.2 0.4 0
Paraná2 8.6 2.2 2.2 2.2 2.2 2.4 2.2 0.0 0.2 0.2 0.2
Santa Catarina 8.6 2.2 2.2 2.2 2.2 2.4 2.2 0.0 0.2 0.2 0.2 0.0
strong evidence indicating that these two groups should not be considered as a single species.
Phylogenetic analyses
The neighbor-joining (NJ) and maximum-parsimony (MP) trees for the two genes had the same topology and gave two distinct clades, one for the tropical group and one for the subtropical group (Figures 4 and 5), all the trees be-ing supported by highly significant bootstrap values (≥93%). There was no perfect geographic structuring of the sampled populations in the clades, as is shown by speci-mens from one locality grouping with specispeci-mens from an-other, geographically distant, locality. Gilleset al.(2000) used cytochromebgene sequences to study Epinephelus marginatus(Serranidae) populations and observed that in
spite of high nucleotide similarity between French and Tunisian populations there was a certain geographic struc-turing of the specimens and that cladograms showed sepa-rate French and Tunisian populations. Allergruci et al. (1999), studyingDicentrarchus labrax, also observed that in spite of the high level of nucleotide similarity in the cytochrome b gene sequences there was a certain geo-graphic structuring within MediterraneanD. labrax popu-lations, with populations from the northwest (French waters) and east (Greek and Egyptian waters) being clearly distinct from Tyrrenian populations. In our work, the lack of geographic structuring in the Macrodon populations within each group is indicative of recent genetic flow.
Our data corroborates the existence of two panmitic and genetically isolated Macrodon populations, one, the tropical group, being distributed from Venezuela to Pernambuco and the other, the subtropical group, occurring from São Paulo to Argentina.
Based on morphometric traits, Yamaguti (1979) dis-tinguished fourM. ancylodonpopulations in southeastern and southern Brazilian coastal waters but our results, based on specimens collected in the same regions, did not agree with these findings even when the rapidly evolving cytochromeb gene was considered, as can be seen in the MP and NJ trees shown in Figure 4.
Isolation of theMacrodonpopulations
According to Dawson et al. (2001) intra and interspecific diversity patterns are greatly influenced by historically established barriers to marine animal
move-Genetic differentiation ofMacrodonrevealed by mtDNA 157
Figure 3- Mitochondrial 16S rRNA informative sites that discriminate tropical (Venezuela to Pernambuco) and subtropical (São Paulo to Argen-tina)Macrodongroups. . The dots represent the same nucleotide as occurs in the first sequence for that site in the outgroup species Cynoscion arenarius(CAR). Deletions are represented by dashes. The codes on the left refer to the geographic location where theMacrodon ancylodon speci-mens were caught: VE, Venezuela; AP, Amapá; PA, Pará; MA, Ma-ranhão; PE, Pernambuco; SP, São Paulo; PR, Paraná, SC; Santa Catarina; RS, Rio Grande do Sul; ARG, Argentina.
Figure 2- Cytochromebinformative sites that discriminate tropical (Ven-ezuela to Pernambuco) and subtropical (São Paulo to Argentina)
Macrodongroups. The dots represent the same nucleotide as occurs in the first sequence for that site in the outgroup speciesParetroplus polyactis
(PPO). The codes on the left refer to the geographic location where the
ment created by circulation patterns, temperature regimens and coastal topography. In our study, we observed that there is marked geographic structuring in the genus Macrodonthat diverges at the Brazilian northeast into two genetically distinct clades (tropical and subtropical). This pattern of separation between the groups fits the type I phylogeographic pattern proposed in the recent classifica-tion by Avise (2000) where the lines are defined by haplotype groups spatially separated by an effective barrier to genetic flow.
The Mantel test showed a positive correlation be-tween genetic and geographic distances, although signifi-cant geographic structuring forM. ancylodonwas detected only between, not within, the tropical and subtropical groups, indicating that factors other than isolation by dis-tance could be contributing to differentiation in this spe-cies. A possible cause for the marked genetic differentiation of the tropical and subtropical Macrodon groups could be patterns of oceanic circulation caused by surface marine currents,e.g.the North Brazil and Brazil currents that diverge at the Brazilian northeast and influ-ence different regions of the coast. The North Brazil current influences part of the northeastern and all the northern coast of Brazil as far as Venezuela, while the Brazil current influ-ences part of the northeastern coast and the southeastern and southern coast of Brazil and some regions of the
Argen-tinean coast (Castro and Miranda, 1998; Brandini et al., 1997; Palacio, 1982). Our analyses showed that the two Macrodongroups consist of populations from areas that are influenced by different surface currents and therefore we can suggest that this is one of the barriers that prevents ge-netic flow and isolates theMacrodon populations of the tropical and subtropical groups.
Another factor that could be isolating theMacrodon groups is the difference in sea water temperature in the tropical and subtropical regions, temperatures ranging from 24 to 28 °C in the tropical regions (Castro and Miranda, 1998; Cervigón, 1993) while the subtropical waters are characterized by lower temperatures which range from 27 °C to 18 °C and can reach 16 °C in the Campos basin of the Brazilian state of Rio de Janeiro (Castro and Miranda, 1998). TheMacrodonpopulations in the two groups proba-bly developed mechanisms to adapt to the type of environ-ment where they lived and this served as a barrier enhancing the geographical isolation of the populations. In-deed, Lowe-Mcconnell (1999) states that water tempera-ture is one of the main factors that affect the distribution of marine fish, while Schrothet al.(2002) observed that water temperature is one of the main factors that affect distribu-tion and genetic differentiadistribu-tion in medusa jelly fish (Aureliasp.) and suggests that ecological data indicates that adaptation to local climatic conditions may have forced the diversification of this organism during its evolutionary his-tory. Stepien (1995) has suggested that the barrier of warm water in the south of the Gulf of California is the cause of the isolation and consequent genetic divergence which
oc-curs among spotted sand bass (Paralabrax
Figure 4- Phylogenetic tree forMacrodonpopulations based on 810 base pairs of cytochromeb. When above 50%, numbers in the nodes indicate the percentage of trees out of 1000 bootstrap replicates for the maxi-mum-parsimony (MP, above) and neighbor-joining (NJ, bellow) trees.
Paretropuls poplyactiswas used as outgroup.
Figure 5- Phylogenetic tree forMacrodonpopulations based on 520 base pairs of 16S rRNA. When above 50%, numbers in the nodes indicate the percentage of trees out of 1000 bootstrap replicates for the maximum-parsimony (MP, above) and neighbor-joining (NJ, bellow) trees.
maculatofasicatus) populations in the Gulf of California and the Pacific coast.
According to some authors, population isolation can occur during strong alterations in environmental condi-tions, such as climatic changes and geological phenomena (Stepienet al.,2001; Brunneret al.,2001; Lundberget al., 1998). The ice ages are also considered one of the phenom-ena that caused changesinenvironmental conditions, re-sulting in isolation and later differentiation of populations (Beheregarayet al.,2002; Brunneret al.,2001). According to Yamaguti (1979),M. ancylodon, originally from a tropi-cal region, arrived at the cooler southern Brazilian waters during the postglacial periods and by successive adaptive radiations became adapted to these new environments. The occupation of cooler water environments may have caused the development of adaptation mechanisms to these envi-ronments and later isolation of tropical and subtropical populations.
Another important factor affectingMacrodon isola-tion could be the difference in reproductive periods. Studies carried out in the tropical and subtropical regions of Brazil have shown that this species has distinct reproduction peri-ods, December and February in the South (Juras and Yamagguti, 1989; Yamaguti, 1967; Vazzoler, 1963) and July-August and October-December in the north (Camargo-Zorro, 1999).
Macrodon ancylodon: a single species in the western Atlantic?
According to the allopatric speciation model, tempo-rary geographic isolation is required to form reproductive barriers (Sturmbaueret al.,1997). Futuyma (1997) postu-lated that low levels of genetic flow and population isola-tion are important for speciaisola-tion to take place. Several studies have assessed the degree of genetic differentiation of fish populations based on mitochondrial DNA se-quences, especially cytochrome b and D-loop region se-quences (Dawson et al., 2001; Gilles et al., 2000; Allergruciet al.,1999).
The low divergence values which we found in theM. ancylodonpopulations within the tropical and subtropical groups suggest high intra-group genetic flow. In the phylo-genetic trees (Figures 4 and 5), the populations cannot be separated because individuals belonging to very distant geographical regions group together. Even when speci-mens from the same or close geographic regions compose a clade, the grouping is not statistically supported. Con-versely, high genetic divergence was observed between the tropical and subtropical groups, and this is also confirmed by the separation of these groups in the phylogenetic trees with the nodes being supported by high bootstrap values (Figures 4 and 5). The levels of divergence found between tropical and subtropicalM. ancylodongroups for the two segments of the mitochondrial genome studied are of the same magnitude, or greater than, those found for individual
specimens of different species within the same genus. These results suggest that these two groups have already reached a stage of sufficient genetic differentiation to be considered as distinct species and not just as a single spe-cies for the western Atlantic, as is traditionally accepted in the current taxonomy based on morphological data. The ev-idence presented in this paper indicates that the taxonomic status ofMacrodon ancylodonshould be revised, and that strategies for management and conservation of stocks from different regions of the Brazilian coast should take in con-sideration the results of the present investigation.
Acknowledgments
This paper is contribution n. 50 to the Mangrove Dy-namics and Management (MADAM) project which is sup-ported by the German Ministry for Education, Science, Research and Technology (BMBF) (Project number 03F0154A) and the Brazilian Conselho Nacional de Desenvolvimento Científico e Tecnologico (CNPq). The project is coordinated by the Center for Tropical Marine Ecology (ZMT, Bremen, Germany) and the Universidade Federal do Pará (UFPA, Brazil). Simôni Santos received a Master MADAM program Scholarship from CNPq from February 2000 to January 2002. This work was possible with the valuable help of the many people who supplied samples of M. ancylodon, including Ernesto Medina, Muzenilha Carvalho, Dioniso Sampaio, Cristiana Maciel, Roberta Ikeda, Henry Spach, Patrícia Sunyé, Ricardo Perrota.
References
Akihito IA, Kobayashi T, Ikeo K, Imanishi T, Ono H, Umehara Y et al.(2000) Evolutionary aspects of gobioid fishes based upon a phylogenetic analysis of mitochondrial cytochromeb genes. Gene 259:5-15.
Allergruci G, Caccone A and Sbordoni, V (1999) Cytocrhomeb sequence divergence in the European sea bass (Dicentrarchus labrax) and phylogenetic relationships among some Perciformes. J Zool Syst Evol Res 37(3):149-156.
Avise JC (2000) Phylogeography: The History and Formation of Species. Havard University Press, Cambridge, MA, 447 pp. Beheregaray LB, Sunnucks P and Briscoe DA (2002) A rapid fish
radiation associated with the last sea-level changes in south-ern Brazil: the silverside Odontesthes perugiae complex. Proc R Soc Lond B Biol Sci 269:65-73.
Belkhir K (2001) GENETIX, logiciel sous WindowsTM pour la génétique des populations. Laboratoire Génome et Popula-tions, CNRS UPR 9060, Université de Montpellier II, Montpellier (France).
Bernardi G, Robertson DR, Clifton KE and Azurro E (2000) Mo-lecular systematics, zoogeography, and evolutionary ecol-ogy of the Atlantic parrotfish genus Sparisoma. Mol Phylogenet Evol 15(2):292-300.
Brandini FP, Lopes RM, Gutseit KS, Spach HL and Sassi R (1997) Planctonologia na Plataforma Continental do Brasil: Diagnose e Revisão Bibliográfica. Avaliação do Potencial
Sustentável de recursos Vivos da Zona Econômica Exclu-siva - REVIZEE, Rio de Janeiro, 196 pp.
Briolay J, Galtier N, Brito M and Bouvet Y (1998) Molecular phy-logeny of Cyprinidae inferred from cytochromebDNA se-quences. Mol Phylogenet Evol 9(1):100-108.
Brunner PC, Douglas MR, Osinov A, Wilson CC and Bernatchez L (2001) Holartic phylogeography of Arctic charr (Salvelinus alpinusL.) inferred from mitochondrial DNA sequences. Evolution 55(3):573-586.
Burton RS (1983) Protein polymorphism and genetic differentia-tion of marine invertebrate populadifferentia-tions. Mar Biol 4:193-206.
Cabot EL and Beckenbach AT (1989) Simultaneous editing of multiple nucleic acid and protein sequences with ESEE. Comp Applic Biosci 5(3):233-234.
Camargo-Zorro M (1999) Biologia e estrutura populacional das espécies da família Sciaenidae (Pisces: Perciformes), no estuário do rio Caeté município de Bragança, Pará - Brasil. M.Sc. Thesis, Universidade Federal do Pará, Belém. Castro BM and Miranda LBde (1998) Physical oceanography of
the western Atlantic Continental Shelf located between 4° N and 34° S coastal segment (4,W). In: Robinson A R and Brink K H (eds) The Sea. V II. John Wiley and Sons. Inc., pp 209-251.
Cervigón F (1993) Los Peces Marinos de Venezuela. V. II. 2 ed. Fundación Científica Los Roques, Caracas, Venezuela, 498 pp.
Cervigón F, Cipriani RF, Fischer W, Garibaldi L, Hendrickx M, Lemus AJ, Máerquez Ret al. (1993) FAO Species Identifi-cation Sheets for Fishery Purposes. Field Guide to the Com-mercial Marine and Brackish-Water Resources of the Northern Coast of South America. Rome FAO, 513 pp. Craig MT, Pondella DJ, Franck JPC and Hafner JC (2001) On the
status of the serranid fish genusEpinephelus: evidence for paraphyly based upon 16S DNA sequence. Mol Phylogenet Evol 19(1):121-130.
Dawson MN, Staton JL and Jacobs DK (2001) Phylogeography of the tidewater goby, Eucyclogobius newberryi (Teleostei, Gobiidae), in coastal California. Evolution 55(6):1167-1179.
Durand JD, Templeton AR, Guinand B, Imsiridou A and Bouvet I (1999) Nested clade and phylogeographic analyses of de Chub, Leuciscus cephalus (Teleostei, Cyprinidae), in Greece: implications for Balkan Peninsula biogeography. Mol Phylogenet Evol 13(3):566-580.
Farias IP, Ortí G, Sampaio I, Schneider H and Meyer A (2001) The cytochromebgene as a phylogenetic marker: the limits of resolution for analyzing relationships among cichlid fishes. J Mol Evol 53:89-103.
Farias IP, Meyer A and Orti G (2000) Total evidence: molecules, morphology and the phylogenetics of cichlids fishes. Mol Dev Evol 288:76-92.
Felsenstein J (1985) Confidence limits on phylogenies: an ap-proach using the bootstrap. Evolution 39:783-791. Futuyma DJ (1997) Biologia Evolutiva. 2 ed. Sociedade
Brasileira de Genética/CNPq. Ribeirão Preto, São Paulo, 631 pp.
Galbo AM Lo, Carpenter KE and Reed DL (2002) Evolution of trophic types in emperor fishes (Lethrinus, Lethrinidae, Percoidei) based on cytochromebgene sequence variation. J Mol Evol 54: 754-762.
Gilles A, Miquelis A, Quignard JP and Faure E (2000) Molecular phylogeography of western Mediterranean dusky grouper Epinephelus marginatus. C R Acad Sci Paris, Sciences de La Vie / Life Sciences 323:195-205.
Haimovici M, Martins AS and Vieira PC (1996) Distribuição e Abundância de peixes teleósteos demersais sobre a platafor-ma continental do sul do Brasil. Rev Bras Biol 56(1):27-50. Hanel R and Sturmbauer C (2000) Multiple recurrent evolution of
trophic types in northeastern Atlantic and Mediterranean seabreams (Sparidae, Percoidei ). J Mol Evol 50:276-283. Isaac VJ and Braga TMP (1999) Rejeição de pescado nas
pesca-rias da costa norte do Brasil. Arquivos de Ciências do Mar 32:39-54.
Johns GC and Avise J (1998) A comparative summary of genetic distances in the vertebrates from the mitochondrial cytochromebgene. Mol Biology Evol 15(11):1481-1490. Juras AA and Yamaguty N (1989) Sexual maturity, spawning and
fecundity of King weakfishMacrodon ancylodon, caught off Rio Grande do Sul State (southern coast of Brazil). Bolm. Inst. Oceanogr., São Paulo 37(1):51-58.
Kumar S, Tamura K, Jacobsen IB and Nei M (2001) MEGA2: Molecular Evolutionary Genetics Analysis software. Bio-informatics 17:1244-1245.
Lowe-Mcconnell RH (1999) Estudos Ecológicos de Comuni-dades de Peixes Tropicais. Edusp, São Paulo, 535 pp. Lundberg JG, Marshall LG, Guerrero J, Horton B, Malabarba
MCSL and Wesselingh F (1998) The stage for neotropical fish diversification: a history of tropical South American rivers. In: Malabarba LR, Reis RE, Varri RP, Lucena ZM and Lucena CAS (eds) Phylogeny and Classification of Neotropical Fishes. Edipucrs. Porto Alegre, Brasil, pp 13-48.
Mantel N (1967) The detection of disease clustering and general-ized regression approach. Cancer Res 27:209-220. Menezes NA and Figueiredo JL (1980) Manual de Peixes
Mari-nhos do Sudeste do Brasil. IV. Teleostei (3). Museu de Zoologia da Universidade de São Paulo, São Paulo, 96 pp. Mullis K and Faloona F (1987) Specific synthesis of DNAin vitro
via a polymerase catalyzed chain reaction. Methods Enzymol 55:335-350.
Nelson JS (1984) Fishes of the World. 3rd edition. John Wiley and Sons, Inc, New York, NY, 600 pp.
Palacio FJ (1982) Revisión zoogeográfica marina del sur del Brasil. Bol. Inst. Ocean., São Paulo. 31(1):69-92.
Palumbi SR (1995) Using genetics as an indirect estimator of lar-val dispersal. In: McEdward LR (ed) Ecology of Marine In-vertebrate Larvae. CRC Press, Boca Raton, Fl, pp 369-387. Palumbi S, Martin A, Romano S, Mcmillian WO, Stice L and Grabowski G (1991) The simple fool’s guide to PCR. Uni-versity of Hawaii, Honolulu, 46 pp.
Posada D and Crandall KA (1998) MODELTEST: testing the model of DNA substitution. Bioinformatics 14(9):817-818. Reed DL, deGravelle MJ and Carpenter KE (2001) Molecular systematics ofSelene(Perciformes: Carangidae) based on cytochromebsequences. Mol Phylogenet Evol 21(3):468-475.
Ritchie AP, Lavoué S and Lecointre G (1997) Molecular phylo-genetics and the evolution of Antarctic notothenoid fishes. Comp Biochem Physiol 118A(4):1009-1025.
trophic-types in ‘Cichlasoma (Amphilophus)’ and ‘C. (Thorichthys)’. Mol Phylogenet Evol 7:366-376.
Sambrook J, Fritcsh EF and Maniatis T (1989) Molecular Clon-ing: A Laboratory Manual. 2 ed. Cold Spring Harbor Labo-ratory Press, New York.
Sanger F, Nichlen S and Coulson AR (1977) DNA sequencing with chain-termination inhibitors. Proc Natl Acad Sci USA 74:5463-5468.
Schroth W, Jarms G, Streit B and Schierwater B (2002) Speciation and phylogeography in the cosmopolitan marine moon jelly, Aureliasp. BMC Evol Biol 2:1-10.
Sinclair M (1988) Marine Populations: an Essay on Population Regulation and Speciation. University of Washington Press, Seatle.
Slatkin M (1993) Isolation by distance in equilibrium and non-equilibrium populations. Evolution 47:264-279.
Smith, MF and Patton JL (1993) The diversification of South American Murid Rodents: evidence from mitochondrial DNA sequence data for the Akodontine tribe. Biol J Linn Soc Lond 50:149-177.
Stepien CA, Rosenblatt RH, and Bargmeyer BA (2001) Phylogeography of the spotted sand bass, Paralabrax maculatofasciatus: divergence of Gulf of California and Pa-cific coast populations. Evolution 55(9):1852-1862. Stepien CA and Kocher TD (1997) Molecules and morphology in
studies of fish evolution. In: Koocher TD and Stepien C (eds) Molecular Systematics of Fishes. Academic Press, USA, pp 1-11.
Stepien CA (1995) Population genetic divergence and geographic patterns from DNA sequences: examples from marine and freshwater fishes. In: Nielsen JL (ed) Evolution and the Aquatic Ecosystem: Defining Unique Units in Population Conservation. American Fisheries Society Symposium 17, Bethesda, Maryland, pp 263-287.
Streelman JT, Alfaro M, Westneat MW, Bellwood DR and Karl SA (2002) Evolutionary history of the parrotfishes: bio-geography, ecomorphology, and comparative diversity. Evolution 56(5):961-971.
Sturmbauer C, Verheyen E, Ruber L and Meyer A (1997) Phylo-geographic patterns in populations of cichlid fishes from rocky habitats in lake Tanganyika. In: Koocher TD and Stepien C (eds) Molecular Systematics of Fishes. Academic Press, USA, pp 97-111.
Swofford DL (2002) PAUP* Phylogenetic analysis using parsi-mony and other methods, version 4. Sinauer Associates, Sunderland, Massachussets.
Tamura F and Nei M (1993) Estimation of the number of nucleo-tide substitutions in the control region of mitochondrial DNA in humans and chimpanzees. Mol Biol Evol 10:512-526.
Tang KL (2001) Phylogenetic relationships among Damselfishes (Teleostei: Pomacentridae) as determined by mitochondrial ribosomal DNA data. Copeia 3:591-601.
Tringali MD, Bert TM, Seyoum S, Bermingham E and Bartolacci D (1999) Molecular phylogenetics and ecological diversifi-cation of the transisthmian fish genusCentropomus (Perci-formes: Centropomidae). Mol Phylogenet Evol 13(1):193-207.
Vazzoler AEA de M (1963) Sobre a fecundidade e a desova da pescada-foguete. Bol Inst Ocean, São Paulo 13(2):33-40. Xia X and Xie Z (2001) DAMBE: data analysis in molecular
biol-ogy and evolution. J Hered 92:371-373.
Yamaguti N (1967) Desova da pescada-foguete, Macrodon ancylodon.Bol Inst Ocean, São Paulo 16(1):101-106. Yamaguti N (1979) Diferenciação Geográfica de Macrodon
ancylodon(Bloch andSchneider, 1801) na Costa Brasileira entre as Latitudes 18°36’ S e 32°10’ S, etapa I.Bol Inst Ocean, São Paulo 28(1):53-118.
Editor: Sérgio Furtado dos Reis