Cortical Network Model
Louis-Emmanuel Martinet, Denis Sheynikhovich, Karim Benchenane, Angelo Arleo*
Laboratory of Neurobiology of Adaptive Processes, UMR 7102, CNRS - UPMC Univ P6, Paris, France
Abstract
The interplay between hippocampus and prefrontal cortex (PFC) is fundamental to spatial cognition. Complementing hippocampal place coding, prefrontal representations provide more abstract and hierarchically organized memories suitable for decision making. We model a prefrontal network mediating distributed information processing for spatial learning and action planning. Specific connectivity and synaptic adaptation principles shape the recurrent dynamics of the network arranged in cortical minicolumns. We show how the PFC columnar organization is suitable for learning sparse topological-metrical representations from redundant hippocampal inputs. The recurrent nature of the network supports multilevel spatial processing, allowing structural features of the environment to be encoded. An activation diffusion mechanism spreads the neural activity through the column population leading to trajectory planning. The model provides a functional framework for interpreting the activity of PFC neurons recorded during navigation tasks. We illustrate the link from single unit activity to behavioral responses. The results suggest plausible neural mechanisms subserving the cognitive ‘‘insight’’ capability originally attributed to rodents by Tolman & Honzik. Our time course analysis of neural responses shows how the interaction between hippocampus and PFC can yield the encoding of manifold information pertinent to spatial planning, including prospective coding and distance-to-goal correlates.
Citation:Martinet L-E, Sheynikhovich D, Benchenane K, Arleo A (2011) Spatial Learning and Action Planning in a Prefrontal Cortical Network Model. PLoS Comput Biol 7(5): e1002045. doi:10.1371/journal.pcbi.1002045
Editor:Olaf Sporns, Indiana University, United States of America
ReceivedDecember 20, 2010;AcceptedMarch 20, 2011;PublishedMay 19, 2011
Copyright:ß2011 Martinet et al. This is an open-access article distributed under the terms of the Creative Commons Attribution License, which permits unrestricted use, distribution, and reproduction in any medium, provided the original author and source are credited.
Funding:This work was granted by the European Union (http://cordis.europa.eu/fp7/ict/cognition/), Project ICEA (Integrating Cognition, Emotion and Autonomy), N. IST-027819-IP. It was also funded by the French National Agency for Research (ANR, http://www.agence-nationale-recherche.fr/), Project EvoNeuro, N. ANR-09-EMER-005-01. The funders had no role in study design, data collection and analysis, decision to publish, or preparation of the manuscript.
Competing Interests:The authors have declared that no competing interests exist.
* E-mail: [email protected]
Introduction
Spatial cognition requires long-term neural representations of the spatiotemporal properties of the environment [1]. These representations are encoded in terms of multimodal descriptions of the animal-environment interaction during active exploration. Exploiting these contextual representations (e.g. through reward-based learning) can produce goal-oriented behavior under different environmental conditions and across subsequent visits to the environment. The complexity of the learned neural representations has to be adapted to the complexity of the spatial task and, consequently, to the flexibility of the navigation strategies used to solve it [2,3]. Spatial navigationplanning—defined here as the ability to mentally evaluate alternative sequences of actions to infer optimal trajectories to a goal— is among the most flexible navigation strategies [3]. It can enable animals to solve hidden-goal tasks even in the presence of dynamically blocked pathways (e.g. detour navigation tasks, [4]). Experimental and theoretical works have identified three main types of representations suitable for spatial navigation planning, namely route-based, topological, and metrical maps [2,3,5–7]. Route-based representations encode sequences of place-action-place associations independently from each other, which does not guarantee optimal goal-oriented behavior (e.g. in terms of capability of either finding the shortest pathway or solving detour tasks). Topological maps merge routes into a common goal-independent representation that can be understood as a graph whose nodes and edges encode spatial
locations and their connectivity relations, respectively [2]. Topological maps provide compact representations that can generate coarse spatial codes suitable to support navigation planning in complex environments. Metrics-based maps go beyond pure topology in the sense they embed the metrical relations between environmental places and/or cues —i.e. their distances and angles— within an allocentric (i.e. world centered) reference frame [5]. Here, we model a spatial memory system that primarily learns topological maps. In addition, the resultant representation also encodes directional-related information, allow-ing some geometrical regularities of the environment to be captured. The encoding of metric information favors the computation of novel pathways (e.g. shortcuts) even through unvisited regions of the environment. In contrast to the qualitative but operational space code provided by topological maps, metrical representations form more precise descriptions of the environment that are available only at specific locations until the environment has been extensively explored [5]. However, purely metric representations are prone to errors affecting distance and angle estimations (e.g. path integration [8]). Behavioral and neurophys-iological data suggest the coexistence of multiple memory systems that, by being instrumental in the encoding of routes, topological maps and metrical information, cooperate to subserve goal-oriented navigation planning [9].
processing mediated by a network of brain structures that interact to promote effective spatial behavior [3,9–11]. An extensive body of experimental work has investigated the neural bases of spatial cognition, and a significant amount of evidence points towards a prominent role of the hippocampal formation [12]. This limbic region has been thought to mediate spatial learning functions ever since location-selective neurons —namely hippocampal place cells [1], and entorhinal grid cells [13]— and orientation-selective neurons —namely head-direction cells [14]— were observed by means of electrophysiological recordings from freely moving rats. Yet, the role of the hippocampal formation in goal representation and reward-dependent navigation planning remains unclear [15]. On the one hand, the hippocampus has been proposed to encode topological-like representations suitable for action sequence learning [16] (see [15] for a review of models). This hypothesis mainly relies on the recurrent dynamics generated by the CA3 collaterals of the hippocampus [17]. On the other hand, the hippocampal space code is likely to be highly redundant and distributed [18], which does not seem adequate for learning compact topological representations of high-dimensional spatial contexts. Also, the experimental evidence for high-level spatial representations mediated by a network of neocortical areas (e.g. the posterior parietal cortex [19] and the prefrontal cortex [20]) suggests the existence of an extra-hippocampal action planning system shared among multiple brain regions [21,22]. The model presented here relies on the hypothesis of a distributed spatial cognition system in which the hippocampal formation would contribute to navigation planning by conveying redundant spatial representations to higher associative areas, and a cortical network would elaborate more compact representations of the spatial context —accounting for motivation-dependent memories, action cost/risk constraints, and temporal sequences of goal-directed behavioral responses [23].
Among the cortical areas involved in map building and action planning, the prefrontal cortex (PFC) is likely to play a central role, as suggested by anatomical PFC lesion studies showing impaired navigation planning in rats [24,25] and neuroimaging studies [26,27]. Also, the anatomo-functional properties of the PFC seem
appropriate to encode multimodal contextual memories that are not merely based on spatial correlates. The PFC receives direct projections from sub-cortical structures (e.g. the hippocampus [28], the thalamus [29], the amygdala [30] and the ventral tegmental area [31]), and indirect connections from the basal ganglia through the basal ganglia - thalamocortical loops [32]. These projections convey multidimensional information onto the PFC, including (but not limited to) emotional and motivational inputs [33], reward-dependent modulation [34], and action-related signals [32]. The PFC seems then well suited to(i)process manifold spatial information [35], (ii) encode the motivational values associated to spatiotemporal events [15], and(iii)perform supra-modal decision making [36,37]. Also, the PFC may be involved in integrating events in the temporal domain at multiple time scales [38]. Indeed, its recurrent dynamics, regulated by the modulatory action of dopaminergic afferents, may maintain patterns of activity over long time scales [39]. Finally, the PFC is likely to be critical to detecting cross-temporal contingencies, which is relevant to the temporal organization of behavioral responses, and to the encoding of retrospective and prospective memories [38].
This article presents a neurocomputational model of the PFC columnar organization [40] and focuses on its possible role in spatial navigation planning. The cortical column model generates compact topological maps from afferent redundant spatial representations encoded by the hippocampal place cell activity patterns as modeled by Sheynikhovich et al. [41]. The model exploits the multimodal coding property offered by the possibility to refine the cortical architecture by adding a sublevel to the column, i.e. the minicolumn. It also exploits the recurrent nature of the columnar organization to learn multilevel topological maps accounting for structural regularities of the environment (such as maze alleys and arms). It shows how specific connectivity principles regulated by unsupervised Hebbian mechanisms for synaptic adaptation can mediate the learning of topological neural representations in the PFC. Then, the model uses the underlying topological maps to plan goal-directed pathways through a neural implementation of a simple breadth-first graph search mechanism called activation diffusion or spreading activation [42–44]. The activation diffusion process is based on the propagation of a reward-dependent signal from the goal state through the entire topological network. This propagation process enables the system to generate action sequences (i.e. trajectories) from the current position towards the goal. We show how the modeled anatomo-functional interaction between the hippocampal formation and the prefrontal cortex can enable simulated rats to learn detour navigation tasks such as Tolman & Honzik’s task [4]. The model presented here aims at shedding some light on the link between single-cell activity and behavioral responses. We perform a set of statistical and information theoretical analyses to characterize the encoding properties of hippocampal and PFC neuronal activity — in terms of both main correlates (e.g. location, distance-to-goal, and prospective coding) and functional time course changes. We interpret and validate the results of these analyses against available experimental data (e.g. extracellular electrophysiological record-ings of PFC units).
Materials and Methods
Cortical column model for spatial learning and navigation planning
Cortical maps consist of local circuits —i.e. the cortical columns [40]— that share common features in sensory, motor and associative areas, and thus reflect the modular nature of cortical
Author Summary
organization and function [45]. Cortical columns can be divided in six main layers including: layer I, which mostly contains axons and dendrites; layers II-III, called supragranularlayers, which are specialized in cortico-cortical connections to both adjacent and distant cortical zones; layer IV, which receives sensory inputs from sub-cortical structures (mainly the thalamus) or from columns of cortical areas involved in earlier stages of sensory processing; and layers V–VI, calledinfragranularlayers, which send outputs to sub-cortical brain areas (e.g. to the striatum and the thalamus) regulating the ascending information flow through feedback connections. According to the cytoarchitectonic properties of the rat medial PFC [32], no layer IV is considered in the model of cortical column described henceforth. Neuroanatomical findings (see [45] for a review; see [46,47] for anatomical data on rat PFC) suggest that columns can be further divided into several minicolumns, each of which consists of a population of intercon-nected neurons [48]. Thus, a column can be seen as an ensemble of interrelated minicolumns receiving inputs from cortical and sub-cortical areas. It processes these afferent signals and projects the responses both within and outside the cortical network. This twofold columnar organization has been suggested to subserve efficient computation and information processing [45,49]. Several models have been proposed to study the cortical columnar architecture, from early theories on cortical organization [50–52] to recent computational approaches (e.g. the blue brain project [53]). These models either provide a detailed description of the intrinsic organization of the column in relation to cytological properties and cell differentiation or focus on purely functional aspects of columnar operations.
The approach presented here attempts to relate the columnar organization to decision making and behavioral responses using a highly simplified neural architecture which does not account for cell diversity and biophysical properties of PFC neurons. Fig. 1A shows an overview of the model architecture based on this notion of cortical column organization. As aforementioned, the underly-ing hypothesis is that the PFC network may mediate a sparsification of the hippocampal place (HP) representation to encode topological maps and subserve goal-directed action planning. The model exploits the anatomical excitatory projec-tions from hippocampus to PFC [28] to convey the redundantHP state-space representationSto the columnar PFC network, where a sparse state-action codeS|Ais learned. Within a column, each minicolumn becomes selective to a specific state-action pair (s,a)[S|A, with actions a[A representing allocentric motion
directions to perform transitions between two statess,s0[S. Each
column is thus composed by a population of minicolumns that represent all the state-action pairs (s,a1 aN)[S|A
experi-enced by the animal at a locations. This architecture is consistent with data showing that minicolumns inside a column have similar selectivity properties [54] and that some PFC units encode purely cue information while others respond to cue-response associations [55].
The model employs the excitatory collaterals between mini-columns [45,56] to learn multilevel topological representations. Egocentric self-motion information (provided by proprioceptive inputs) biases the selectivity properties of a subpopulation of columns to capture morphological regularities of the environment. Unsupervised learning also modulates the recurrent projections between minicolumns to form forward and reverse associations between states. During planning, the spreading of a reward signal from the column selective for the goal through the entire network mediates the retrieval of goal-directed pathways. Then, a local competition between minicolumns allows the most appropriate goal-directed action to be inferred.
The following sections provide a functional description of the model columnar structure, connectivity and input-output func-tional properties. A more comprehensive account –including equations, parameter settings and explanatory figures– can be found in Supplementary Text S1.
Encoding topological maps by a network of columns.
Every column in the model (Fig. 1B) has a highly simplified structure consisting of three units s,p,v and of a population of minicolumns, each of which is composed of two unitsqandd. The activity of each of these units (see Supplementary Text S1) represents the mean firing rate of a population of pyramidal neurons either in supragranular layers II–III (p,v,q units) or in infragranular layers V–VI (s,dunits).
As exploration proceeds,sneurons become selective to spatial locations —due to the driving input from hippocampal place cells (Fig. 1B). In the model, hippocampal representations integrate visual and self-motion cues, and result in populations of Gaussian-shaped place fields (see [41,57,58] for detailed accounts). During spatial learning, at each location visited by the simulated animal, an unsupervised Hebbian scheme reinforces the projections from the subset of active place cells to the most active s unit (see Supplementary Text S1). As a result, the population activity ofs units tends to encode more compact state-space representations than hippocampal place fields. Note that the unsupervised learning scheme begins to reinforce afferent connections tosunits only when the place field representation has become stable (i.e. every place is encoded by a sub-population of place cells, see Supplementary Text S1 Sec. Spatial learning: encoding topolog-ical representations).
Within each column one neuron v encodes goal information related to a specific state, whereas neuronsqencode the relation between actions and goal. Neuronesqandvback-propagate the goal signal through the cortical network and their discharge correlates to the distance to the goal. Neurones p forward-propagate the selected path signal (i.e. the planned trajectory) from a given position towards the goal. Neuronesdintegrate spatial and reward-related information and compete for local action selection. Their activity triggers a motor command tuned to a specific allocentric motion direction. Inter- and intra-column connectivity (Fig. 1B, see also Supplementary Text S1) involves plastic and non-plastic projections, respectively, whose synaptic efficacies are modeled as scalar weight matricesw[½0,1. Plastic synapses are
randomly initialized to low efficacy values within½0,0:1, i.e. the cortical network starts with weak interconnectivity. As the simulated animal explores the environment, plastic projections are modified through unsupervised Hebbian learning to encode either states or forward and reverse associations between adjacent states (i.e. environment topology). For instance, whenever the simulated rat moves from one place to another, collateral projections wpd and wqv (Fig. 1B) are updated to reflect to connectedness between the two places.
retrieve optimal trajectories to the goal. The motivation signal elicits the activity of thevneuron in the column corresponding to the goal location. This reward-based activity is then back-propagated through reverse associations mediated by the lateral projections wqv(Fig. 1B). When the back-propagated goal signal reaches the column selective for the current position, the coincidence of sandqactivity triggers the discharge of neurons d. Thedactivation, in turns, activates the forward propagation of a goal-directed signal through projectionswpd. Sinceqneurons are already active, successive discharges ofdandpneurons allow the path signal to spread forward to the goal column. A competitive winner-take-all scheme, which locally selects the motor action a[A associated to the most active neuron d, reads out
goal-directed trajectories.
It is worth mentioning that projectionswqvattenuate the back-propagating activity such that the smaller is the number of synaptic relays, the stronger is the goal signal received by theq neurons of the column corresponding to the current location. Thus, the activation diffusion mechanism produces an exponential decrease of the intensity of the goal signal that propagates along the network of columns. Since the receptive fields of the model columns tend to be evenly distributed over the environment, the intensity of the goal signal at a given place does correlate with the distance to the rewarding location. In other words, the columnar network encodes goal-related metrical information allowing the shortest pathway to the target to be selected.
Recurrent cortical processing for multilevel topological mapping. The model can learn hierarchical state-space representations by employing recurrent projections between
columns [45,56]. As shown in Fig. 1 (but see Supplementary Text S1 for more details), this multistage processing can simply be understood in terms of the interaction between two subpopulations of cortical columns. The first populationC1receives and processes
direct spatial inputs from the hippocampus. The second population C2 receives already processed state information from neurons
s[C1, but the dynamics of the neuronss[C2is also modified by a
putative proprioceptive signal w, modulating their electrores-ponsiveness and the synaptic plasticity between neurons s[C1
ands[C2. Thiswsignal encodes the probability of sharp motion
direction changes at a particular location. Thus, while moving along a corridor for instance, the signal remains constant and allows for the potentiation of synapses between multiple neuronss[C1and
one units[C2. At a turning point, the signalwchanges its value
which may result in the recruitment of a new C2 column (see
Supplementary Text S1 for implementation details). As a consequence the selectivity of neuronss[C2accounts for the presence of structural
features of the environment such as alleys and corridors. The spatial resolution of the resultant multilevel representation can then adapt to the structural complexity of the maze.
TheC2columnar network, which is learned similarly to theC1
network, also supports the activation diffusion mechanism to plan goal-directed trajectories (Supplementary Text S1). After learning, collateral projections wvv and wpp allow C2 to modulate the
activity of neuronsp,v[C1during planning (Fig. 1B). Spatial learning tasks and statistical analyses
We demonstrate the ability of the model to learn topological representations and plan goal-oriented trajectories by considering
Figure 1. Overview of the model architecture and connectivity.(A) Model hippocampal place (HP) cells are selective to allocentrically-encoded positions. The prefrontal cortex (PFC) columnar network takes HP cell activities as input to learn a sparse state-action codeS|Areflecting the topological organization of the environment. The model employs recurrent excitatory collaterals between minicolumns of two subpopulations (C1andC2) to implement multilevel spatial processing capturing morphological regularities of the environment. (B) Each model column uses three unitss,p,vand a population of minicolumns, each of which is composed of two unitsqandd. Neuronssreceive inputs from HP cells throughwsh synapses to encode spatial locations. Forward and backward associations between locations are encoded bywpdandwqvconnections, respectively, so that the minicolumn corresponding to the execution of an action in a given place is linked to the place visited after movement. The model uses a motivational signal conveyed bywvmsynapses to encode goal information. The population of neuronsdprojects to motor output, where a winner-take-all competition takes place to select actions locally. Collateral projections between columns (wss, wpp, wvv and wqq) together with a proprioceptive signalwallow the model to implement multilevel spatial processing.
a navigation task: the Tolman & Honzik’s detour task. The behavioral responses of simulated rats are constraint by intersect-ing alleys, which, in contrast to open field mazes, generate clear decision points and permit dynamic blocking of goal-directed pathways.
Tolman & Honzik’s detour task. The classical Tolman & Honzik’s maze (Fig. 2) consisted of three narrow alleys of different lengths (Paths 1, 2, and 3) guiding the animals from a starting location to a feeder location. Tolman & Honzik’s experiment aimed at corroborating the hypothesis that rodents, while undergoing a navigation task, can predict the outcomes of alternative goal-directed trajectories in the presence of dynamically blocked pathways. We implemented Tolman & Honzik’s experimental setup within the Webotssimulator. The latter provided a realistic three dimensional environment where simulated rats could process visual and proximity information (provided by whisker-like sensors), as well as self-motion (proprioceptive-like) signals. Simulated rats were moving at constant speed (15 cm/s). We ran a series of numerical simulations to emulate the experimental protocol originally designed by Tolman & Honzik:
Thetraining periodlasted 168 trials (that correspond to 14 days with 12 trials per day), during which the simulated animals could explore the maze to elaborate topological representations and learn navigation policies. In the following, we refer to 12 training trials as a ‘‘day’’ of simulation.
NDay 1. A series of 3 forced runswas carried out in which the simulated rats were forced to go through P1, P2, and P3 successively. Then, during the remaining 9 trials, the subjects
were allowed to explore the maze freely. At the end of Day 1, a preference for P1 was expected to be already established [4].
NDay 2 to 14. On each trial, a block was introduced at location A (Block A, Fig. 2) to induce a choice between P2 and P3. Entrances to P2 and P3 were also blocked in order to force the animals to go first to Block A. When the simulated rats reached block A and returned back to the first intersection, doors were removed and subjects had to decide between P2 and P3. Every day, 10 runs with a block at A were mixed with 2 non-successive free runs to maintain the preference for P1.
Theprobe testlasted 7 trials (Day 15) with a block at location B (Block B, Fig. 2) to interrupt the portion of pathway shared by P1 and P2. Animals were forced to decide between P2 and P3 when returning to the first intersection point. Both training and probe trials ended when the simulated animal reached the goal, i.e. when it crossed the entrance to the food box.
To assess the invariance of the model performance with respect to the size of the environment, we implemented the above experimental protocol for two different maze scales, 1:1 and 4:1. We took the dimensions of the simulated mazes so as to maintain the proportions of Tolman & Honzik’s setup.
We employed a population of 40 simulated rats for each experimental protocol. We quantified the statistical significance of the results by means of an ANOVA analysis (Pv0:001 was
considered significant).
Statistical analysis of neural activities. We analyzed the activity patterns of simulated neurons in relationship to electrophysiological data. This study aimed at elucidating the link between cell activity and behavior and it stressed the importance of relating the time course profile of single cell discharges to decision-related behavioral responses. This was done by: (i) characterizing the spatial selectivity properties of single cell types; (ii) comparing the density —and other correlated measures such as sparseness and redundancy— of the spatial population codes learned by simulated animals (we recall that one of the aims of the cortical column model was to build spatial codes less redundant than hippocampal place field representations); (iii) differentiating the coding properties of purely reward-related neurons (q and v populations) vs. purely spatial units (s population); (iv) quantifying and comparing the reliability of neural spatial representations (both at level of single cell and population code) in terms of information content —i.e. how much can we infer about either the animal’s position or a particular phase of the task by observing neural responses only? See supplementary Text S2, for details on the statistical measures and parameters employed to perform data analyses.
Besides relating our simulation results to literature experimental data, we studied the consistency between model neural responses and a set of PFC electrophysiological recordings from navigating rats. In these experiments —carried out at S.I. Wiener’s laboratory; see detailed methods in [59,60]— extracellular recordings were performed from medial PFC pyramidal cells of Long-Evans rats solving a spatial memory task. The analysis presented here investigated whether the coding properties of all types of neurons in the cortical network model could actually be observed in the PFC during spatial learning.
Results
Spatial behavior in Tolman & Honzik’s detour task
We first examined the behavioral responses ofn~40simulated animals solving the 1:1 version of Tolman & Honzik’s task (see Sec. sec:tolmantask and Fig. 2 for details on the experimental apparatus and protocol). The qualitative and quantitative results
Figure 2. Spatial navigation tasks used to test the capability of inferring detours.The Tolman & Honzik’s maze (adapted from [4]) consists of three pathways (Path 1, Path 2 and Path 3) with different lengths. The original maze fits approximately within a rectangle of 1.2061.55 m. Two blocks can be introduced to prevent animals from navigating through Path 1 (Block A) or both Path 1 and Path 2 (Block B). The gate near the second intersection prevents rats from going from right to left.
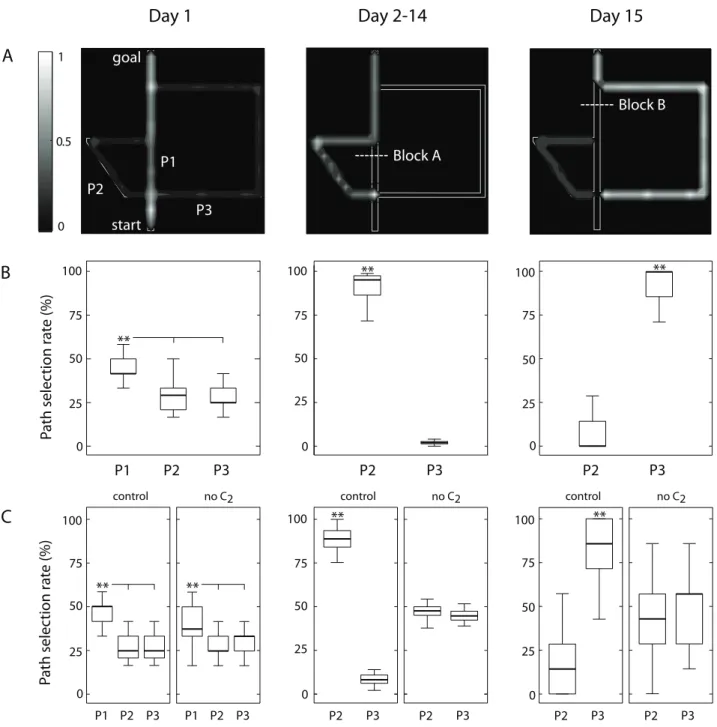
shown on Figs. 3A and B, respectively, demonstrate that the model reproduced the behavioral observations originally reported by Tolman & Honzik [4].
During the first 12 training trials (Day 1) the simulated animals learned the topology of the maze and planned their navigation trajectories in the absence of blocks A and B. Similar to Tolman & Honzik’s findings, the model selected the shortest pathway P1 significantly more than alternative paths P2 and P3 (ANOVA, Pv0:0001; Figs. 3A,B left column).
During the following 156 training trials (Days 2–14), a block at location A forced the animals to update their topological maps dynamically, and plan a detour to the goal. The results reported by
Tolman & Honzik provided strong evidence for a preference for the shortest detour path P2. Consistently, we observed a significantly larger number of transits through P2 compared to P3 (ANOVA,Pv0:0001; Figs. 3A,B central column).
The simulated protocol included 7 probe trials (Day 15) during which the block A was removed whereas a block at location B was added. This manipulation aimed at testing the ‘‘insight’’ working hypothesis: after a first run through the shortest path P1 and after having encountered the unexpected block B, will animals try P2 (wrong behavior) or will they go directly through P3 (correct behavior)? In agreement with Tolman & Honzik’s findings, simulated animals behaved as predicted by the insight hypothesis,
Figure 3. Spatial behavior performance in the Tolman & Honzik’s detour task.Simulation results. Day 1: left column; Day 2–14: central column; Day 15: right column. (A) Occupancy grids representing path selection results qualitatively. (B) Mean path selection rate (averaged over 40 simulated animals) in the 1:1 scale version of the maze. Note that similar to Tolman & Honzik [4] we ignored P1 in Day 2–14 and Day 15 analyses because blocked. (C) Performance of ‘‘control’’ vs. ‘‘noC2’’ animals in the 4:1 version of Tolman & Honzik’s maze.
i.e. they tended to select the longer but effective P3 significantly more often than P2 (ANOVA, Pv0:0001; see Figs. 3A,B, right
column). The patterns of path selection during this task is explained by the ability of the model to choose shortest paths. When a block is added into the environment, the goal propagation signal is also blocked at the level of the column network, and hence the simulated animals choose the shortestunblockedpathways.
We then tested the robustness of the above behavioral results with respect to the size of the environment. We considered a 4:1 scaled version of Tolman & Honzik’s maze and we compared the performances of n~40 simulated animals with intact C1,C2
populations (‘‘control’’ group) against those of n~40 simulated animals lacking theC2 cortical population (‘‘noC2’’ group). The
latter group did not have the multilevel encoding property provided by the C1–C2 recurrent dynamics (see Sec. Recurrent
cortical processing for multilevel topological mapping). Fig. 3C compares the average path selection responses of the two simulated groups across the different phases of the protocol. DuringDay 1(i.e. no blocks in the maze) both groups selected the shortest path P1 significantly more often (ANOVA, Pv0:0001;
Fig. 3C left). However, the action selection policy of subjects without C2 began to suffer from mistakes due to the enlarged
environment, as suggested by lower median value corresponding to P1. DuringDays 2–14(with block A), the group withoutC2did
not succeed in solving the detour task, because no significant preference was observed between P2 (shortest pathway) and P3 (ANOVA,Pw0:001; Fig. 3C center). By contrast, control animals
coped with the larger environmental size successfully (i.e. P2 was selected significantly more often than P3, ANOVA, Pv0:0001).
During the probe trials ofDay 15(with a block at B but not at A), the group withoutC2was impaired in discriminating between P2
and P3 (ANOVA, Pw0:6756; Fig. 3C right), whereas control
subjects behaved accordingly to the insight hypothesis (i.e. they selected the longer but effective P3 significantly more than P2; ANOVA, Pv0:0001). The better performances of control
subjects were due to the fact that back-propagating the goal signal through the cortical network benefited from the higher-level representation encoded by theC2population and from theC1-C2
interaction during planning (see Supplementary Text S1 Sec. Exploiting the topological representation for navigation planning, Fig. S2). Indeed, an intactC2population allowed the goal signal to
decay with a slower rate compared to C1, due to the smaller
number of intermediate columns inC2(i.e. planning could benefit
from a more compact topological representation).
Henceforth we demonstrate how the modeled neural processes can be interpreted as elements of a functional network mediating spatial learning and decision making. We show that the neural activity patterns of all types of neurons in the cortical model are biologically plausible in the light of PFC electrophysiological data [20,35,59–66].
Single cell and population place codes
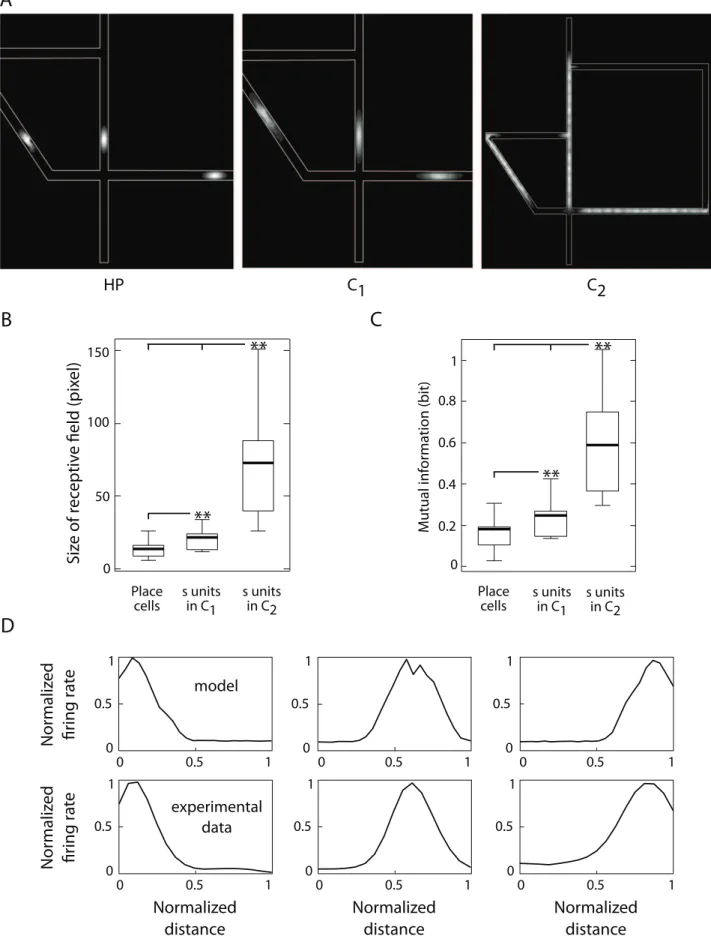
Analysis of single cell receptive fields. To understand how single neurons took part to place coding, we compared the location-selective activities of two types of units of the model: hippocampal place (HP) cells and cortical neurons s[C1,C2
(Fig. 1). We analyzed their discharge patterns while simulated animals were solving the 4:1 version of the Tolman & Honzik’s task. Fig. 4A displays some samples of receptive fields recorded from each of these populations. The representation encoded by unitss[C1was in register with the place field organization ofHP
cells (left and center panels), whereas the activity of neuronss[C2
(right panel) captured some structural properties of the environment (i.e. alley organization). As quantified on Fig. 4B,
the mean size of place fields increased significantly as spatial information was subsequently processed by HP, C1 and C2
populations (ANOVA,Pv0:0001; see also Fig. S3 A for results
based on a kurtosis analysis, Supplementary Text S2). These findings are consistent to experimental data on the sizes of receptive fields of hippocampal and PFC cells recorded from rats solving a navigational task [20].
We also characterized the multistage spatial processing of the model in terms of Shannon mutual information between single unit responses and spatial locations (Supplementary Text S2). As shown on Fig. 4C, the activity of neuronss[C2encoded, on average, the
largest amount of spatial information, followed by neuronss[C1
andHPcells (ANOVA,Pv0:0001). This relationship was due the
fact that the smaller the receptive field is, the larger is the region of the input space for which a neuron remained silent, and then the lesser can be inferred about the entire input set by observing the variability of the neuron discharge. This result was based on the computation of the total amount of information, averaged over all positions. Other authors characterized the spatial locations where cells are most informative, such as the spatial coherence, which estimates the local smoothness of receptive fields [20], or the local information, which is a well-behaved measure of a location-specific information [67,68].
We also compared the location-selective responses of single neurons s[C1 with the discharge patterns of pyramidal cells
recorded from the medial PFC of navigating rats (see Materials and Methods Sec. Statistical analysis of neural activities). Fig. 4D shows three examples of experimental (top) and simulated (bottom) receptive fields evenly distributed on a linear alley. Real and simulated patterns are consistent to each other in terms of both shape and signal-to-noise ratio of the response profiles. These results corroborated the hypothesis that purely location-selective neuronssof the model might find their biological counterpart in real PFC populations.
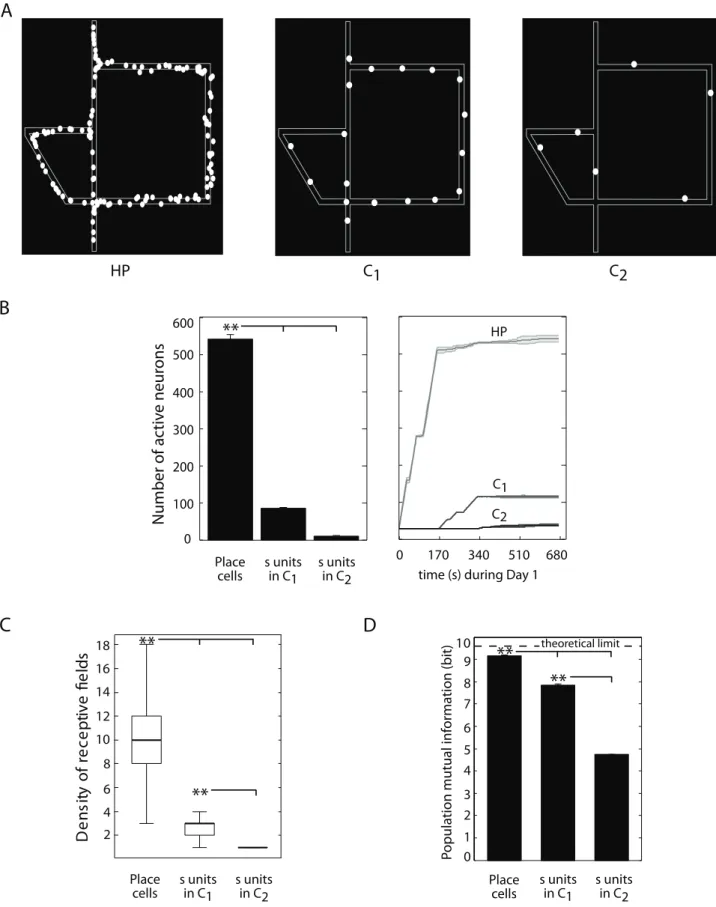
Analysis of population place coding properties. As aforementioned, we modeled the interplay between hippoca-mpus and PFC to produce compact space codes suitable to support navigation planning. Fig. 5 shows how the implemented multistage processing (including the C1–C2 recurrent dynamics)
provided a progressive sparsification of the population place code. Fig. 5A qualitatively compares three examples of distributions of receptive field centers ofHP and s[C1,C2 neural populations
(left, center and right, respectively). Consistently to experimental findings reported by Jung et al. [35], our simulated cortical units produced less redundant place representations thanHPcells. The size of neural populations encoding the Tolman & Honzik’s maze decreased significantly fromHPtoC1and then toC2(ANOVA,
Pv0:0001; Fig. 5B). The sparser nature of cortical place codes
was confirmed by the significant difference between spatial densities of receptive fields (Fig. 5C; see also Figs. S3 B,C for the results of population kurtosis and information sparseness analyses, respectively).
Finally, we measured the Shannon mutual information between population response patterns and spatial locations. The highly redundant HPcode had the largest spatial information content (ANOVA,Pv0:0001; Fig. 5D). Yet, although less redundant, the
population of neurons s[C1 encoded about 85% of the
theoretical upper bound, which proved to be suitable for solving the behavioral tasks. A significant loss of information content was observed for the population code implemented by neuronss[C2.
This is consistent with the functional role of the C2 cortical
network, which could not support navigation planning alone, but rather complemented theC1 representation by encoding higher
Time course analysis of neural responses supporting decision making
Goal distance coding. Besides the spatial correlates of s neurons’ activity, the model cortical representation encoded reward-dependent information. Fig. 6A shows the correlation between the firing rate of unitsv[C1and the shortest
distance-to-goal. The diagram shows that, given a location in the maze, the smaller the length of the shortest goal-directed pathway was, the larger was the mean discharge of thevneuron belonging to the column corresponding to that location. This property was relevant to the decision making process determining the spatial navigation behavior reported in Sec. Spatial behavior in Tolman & Honzik’s detour task. When the exponentially decaying frequency ofvunits reached the basal neural noise level, the action selection policy reduced to random search (see the performance of ‘‘no C2’’
simulated animals on Fig. 3C, central and right panels). The distance-to-goal coding property of v neurons called upon their selective responses in the frequency domain. The population spectral power of Fig. 6B (top) demonstrates that each neuron vi[C1had a unique preferred discharge frequencyficorrelated to
its distance-to-goal (Fig. 6A). Preferred frequencies fi were uniformly distributed over the normalized range ½0,1. Interestingly, when we analyzed the activity of PFC pyramidal cells recorded from navigating rats (see Sec. Statistical analysis of neural activities) we found a subset of neurons with no spatial correlate but with evenly distributed preferred discharge frequencies (see Fig. 6B, bottom, for few examples). To summarize, in contrast to location-selective neurons s of the model, the activity of neurons v had characteristic discharge frequencies and encoded distance-to-reward information. During planning (i.e. the ‘‘mental’’ evaluation of multiple navigation trajectories), this property ofvneurons allowed the value of each state to be assessed with respect to its relevance to goal-oriented behavior, consistently with PFC recordings showing reward-dependent activity patterns [61,63].
Fig. 6C shows how the activity of neuronv belonging to the column associated to the first intersection of Tolman’s maze changed according to the task (phase of the protocol). Recall that the activity of neuronvwas anti-correlated to the shortest distance to the goal among available pathways (Fig. 6A). Thus, when at the end of Day 1 (i.e. Trial 12) the system learned to select the shortest path P1 (no block was present in the maze), neuronvexhibited the largest firing rate. When path P1 was blocked (e.g. Day 14 Trial 12), the length of the shortest available pathway (i.e. P2) increased, as indicated by the lower discharge rate ofv. Finally, the distance to the goal was the largest when both P1 and P2 were blocked (e.g. Day 15 Trial 7). Consequently, the weakest activity of v corresponded to the available path P3. In order to quantify this coding property, we measured the mutual informationItbetween the phases of the task and the discharge patterns of neuronsv(we took neuronssas a control population). As shown in the inset of Fig. 6C, v neurons (unlike s neurons) provided a significant account of abstract task-related information, meaning that the phase of the protocol could be decoded reliably by observing the time course of their discharge patterns.
Coding of action-reward contingency changes. We
studied how the activity of neurons q and d of the model contributed to decision-making. Recall that, after learning, each cortical minicolumn (q,d)[C1,2 encoded a specific state-action
pair(s,a). The analysis reported on Fig. 7 shows the time course of the firing rate of unitsq,dbelonging to the column coding for the first intersection of Tolman & Honzik’s maze. Figs. 7A,B,C focus on the action selection process taking place at the beginning of Day 2 Trial 1 of training (i.e. with block A). During the outward journey, the simulated animal arrived at the intersection point at t^4s. Due to the policy learned during Day 1 of training (i.e. without any block in the maze), at t^4s the unit q1 of the
minicolumn associated to the action leading to P1 discharged with the largest firing rate, followed by unit q2 of the minicolumn
associated to P2, and finally byq3related to P3 (Fig. 7B). Thus,
corresponding neuronsd1,2,3, which combined inputs fromq1,2,3,
respectively, with the location-selective activities of neuronss of the same column, discharged according to the same ranking at t^4s(Fig. 7C). As a consequence, the action driven by d1 was
selected and the simulated animal proceeded along P1. However, when block A was encountered att^5s, the model updated the topological representation (see Supplementary Text S1 Sec. Spatial learning: encoding topological representations), which resulted in a change of action-reward contingencies (withq1firing
rate dropping below that ofq2, meaning that the action leading to
P2 from the intersection point was now better scored, Fig. 7B). This activity update is consistent with findings showing sustained discharge changes highly sensitive to a switch in reward contingencies [37,66]. Thus, when during the backward journey the animal met again the intersection point (att^7s), neurond2
discharged with the largest frequency (Fig. 7A, bottom) leading to the selection of P2.
Similarly, the analysis reported on Figs. 7D,E,F shows how the time course of the relative strengths of the activities of neurons q1,2,3andd1,2,3determined action selection at the beginning of the
probe test, Day 15 Trial 1 (with block A removed and block B inserted). Notice the increased q1 firing frequency at t^6 s
reflecting the re-discovery of the transition blocked at A during Days 2–14 of training.
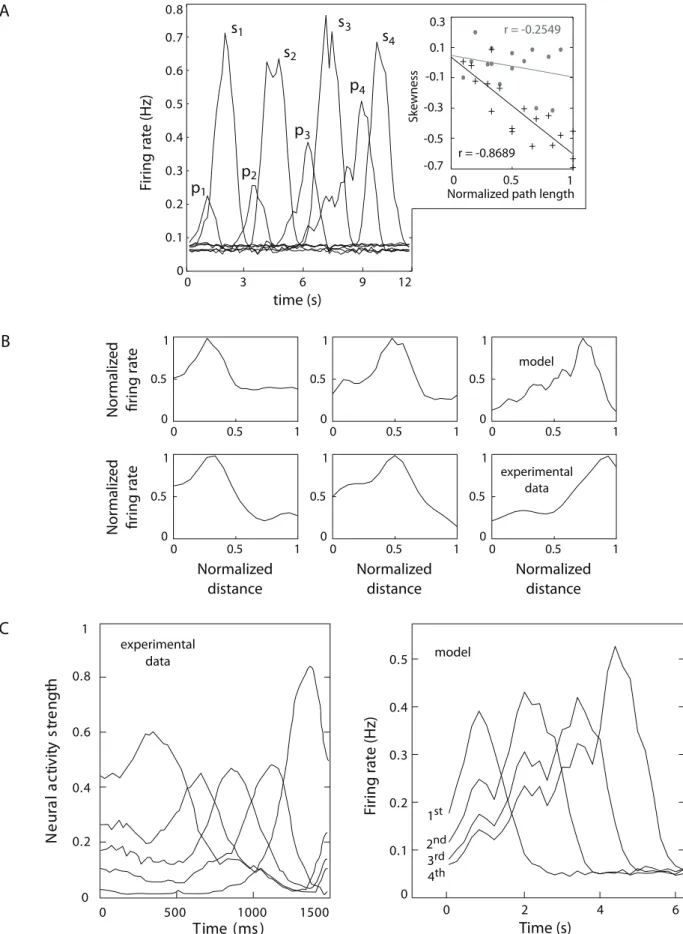
Coding of prospective place sequences. After a local decision was made (based on the competition betweendneurons’ discharges), collateral projections wpd (Fig. 1B and Fig. S2 A) enabled the cortical network to forward propagate the selected state-action sequence. Fig. 8 shows how the time course of p neurons’ firing patterns subserved this propagation process. First, we analyzed the receptive fields ofpunits as the simulated animal proceeded from the starting position towards the goal. Fig. 8A compares the activity profiles of neuronspandsbelonging to the same columns (four different columns are considered in this example). In contrast to the symmetrical receptive fields of neurons s(see also Fig. 4), all neuronsphad asymmetric response profiles with negative skews (i.e. with the left tail of the distribution longer than the right tail). The skewness of these neural responses increased quasi-linearly with the number of synaptic relays forming a mentally planned trajectory (Fig. 8A, top-right inset). When we analyzed PFC data recordings from navigating rats (see Materials and Methods, Sec. Statistical analysis of neural activities), we also found a subset of neurons with asymmetric tuning curves, whose negative skewness seemed to be correlated to the distance traveled by the animal (Fig. 8B).
Another difference between neuronspandsof the model was that the peak discharge frequency of neuronssdid not have any significant modulation, whereas all neurons p had mean peak fields for each neural population, measured in pixels (i.e. 565 cm square regions). (C) Mutual information between single unit responses and spatial input for each population.(D)Location-selective responses of model single neuronss[C1functions of the normalized distance traveled along a
Figure 5. Population place coding analysis.Simulation results. (A) Examples of distributions of place field centroids for the populations of model HP cells (left), cortical neuronssinC1(center) andsinC2(right), when simulated rats were solving the 1:1 version of Tolman & Honzik’s maze. (B) Mean number of active neurones (average over 40 animals) when learning the 4:1 Tolman & Honzik’s maze (left). Evolution of the number of active neurons during the first 12 trials, i.e. Day 1 (right). (C) Mean spatial density (averaged over 40 animals) of receptive fields for each neural population.(D)Mutual information between population responses and spatial input states.
firing rates positively correlated to the distance traveled towards the goal (Fig. 8A). Accordingly, Jung et al. [35] provided experimental evidence for increased neuronal firing rates during the approach to a reward. Finally, an important property of
neuronspof the model is that their discharge tended to temporally anticipate the activity of neuronss (Fig. 8A). In other words, p neurons encoded prospective place information predicting the next state visited by the animal. A cross-correlogram analysis
Figure 6. Coding of distance-to-goal and task-related information.Simulation results and relation to experimental PFC recordings. (A) Relation between the shortest distance of a place to the goal and the firing rate of the neuronvinC1belonging to the column representing that location. Each cross corresponds to one neuronv. Beyond a certain distance, the intensity of the back-propagated goal signal reaches the noise level. As a consequence, neuronsvdischarges become uncorrelated with the distance to the goal, and random decisions are made. (B) Frequency-selective responses of model single neuronsv[C1(top row) and of medial PFC pyramidal cells recorded from navigating rats (bottom row). (C) Relation
between task-related information (Day 1 Trial 12: end of ‘‘no block’’ phase, Day 14 Trial 12: end of ‘‘block A’’ phase and Day 15 Trial 7: end of ‘‘block B’’ phase) and firing rate of the neuronvinC1belonging to the column representing the first intersection point. Inset: mutual information between the phase of the task and single unit responses ofsinC1vs.vinC1.
showed that p neurons’ activity anticipated the discharge of s neurons by a mean time delay t^1:6s, std~+0:6s (given a constant velocity of^15cm=s). The prospective coding property of neurons p is consistent with experimental findings on PFC recordings reported by Rainer et al. [62].
We further studied the predicting nature ofpneurons’ activity in relationship to experimental data on neural encoding of the
serial order of planned sequences before the action begins [65]. In their experiment, Averbeck et al. [65] performed simultaneous recordings of PFC single cell activities from monkeys drawing sequences of lines (i.e. segments forming abstract shapes). Each segment was associated to a distinct pattern of neural activity, and the relative strength of these patternspriorthe actual drawing was shown to predict the serial order of the sequence of segments
actually drawn by monkeys (Fig. 8C left). Consistently, we found that the ranking of the discharge frequencies ofpneuronsbeforethe actual execution of a planned trajectory was a good predictor of the serial order of the states to be visited by the simulated animal (Fig. 8C right). This relationship not only held at timet~0(i.e. at the very beginning of a trajectory), but for every timet, meaning that the ranking ofpneurons’ firing rates could predict the order of future state sequences at any moment.
Comparative analysis of model and experimental PFC population activity patterns
We studied to what extent the neural populations of the model (i.e.s,v,p,qanddneurons) could be quantitatively segregated on the basis of a set of statistical measures. We then compared the results to those obtained by applying the same clustering analysis to a population of neurons recorded from the medial PFC of navigating rats (see Materials and Methods Sec. Statistical analysis of neural activities).
We first gathered all non-silent simulated neurons recorded during the 4:1 version of Tolman & Honzik’s task. All types of units (i.e. s, v, p, q, d) were pulled together in a data set. We characterized each neuron’s discharge by measuring its mean firing rate, standard deviation, skewness, lifetime kurtosis, spatial information per spike and spatial mutual information (see Supplementary Text S2). Then, we performed a principal component analysis (PCA) on the multidimensional space containing the values provided by these measures per each neuron (see Figs. S4 A,C for details). Fig. 9A shows the resulting data distribution in the space defined by the first three principal components. Interestingly, model neurons with different functional roles tended to occupy distinct regions of the PCA space. For instance, neuronsv,q[C1,C2, whose function in the model is to
propagate goal information and code for the distance to the goal, were located within the same portion of the PCA space (blue and cyan crosses and circles). All neuronss[C1, which primarily code
for spatial locations, were also clustered within the PCA space (red crosses). Neurons p,d[C1 (and also p[C2), responsible for
forward signal propagation and local decision making, respective-ly, were aggregated within the same region (gray and black crosses, and black circles). Finally, neurons s,d[C2, mainly involved in
high-level mapping and navigation planning, were also separated from other units in PCA space (gray and red circles).
Figs. 9B,C,D display the mean values, averaged over each population s,d,p,q,v[C1,C2 of the model, of three statistical
measures (out of six) used to perform the PCA. These diagrams can help understanding the data point distribution of Fig. 9A. When considering the mean spatial information per spike (Fig. 9B), at least three groups could be observed: neurons whose activity had nearly no spatial correlate (q,v[C1,C2), neurons conveying
intermediate amounts of spatial information (s,d,p[C1 and
p[C2), and neurons with larger spatial information values
(s,d[C2). The mean firing rate parameter (Fig. 9C) allowed two
distinct groups to be clearly identified: one with low average firing (neurons s,p,d[C1,C2), and one with high firing rates (neurons
q,v[C1,C2). Together with Fig. 9A, this diagram can help
understanding why neurons q,v[C1,C2, which had almost no
spatial correlate and very high firing rates compared to other populations of the model, were well segregated within the same region of the PCA space (Fig. 9A, blue and cyan crosses and circles). Finally, when comparing the mean skewness values of all neural populations (Fig. 9D), neuronsd,p[C1 andp[C2 were
pulled apart, according to their distribution in the PCA space (Fig. 9A, gray and black crosses, and black circles). As a control analysis, we extended the data set used for the PCA by adding a population of neurons with random Poisson activities. As shown in supplementary Figs. S5 A–B, the population of Poisson neurons (light green data points) was well separated from all model neurons within the space defined by the first three principal components, suggesting that the variability of model discharge properties could not be merely explained by a random Poisson-like process.
We then applied an unsupervised clustering algorithm (k-means clustering method withk~3) to partition the distribution of data points of Fig. 9A, based on the discharge characteristics of model neurons. This blind clustering analysis (i.e. without any a priori knowledge on neural populations) allowed us to identify three main groups (Fig. 10A). The first cluster (blue data points) corresponded to non-spatial, reward-related neuronal activities (i.e. neurons q,v[C1,C2). The second cluster (green points)
represented location-selective activity (mainly from neurons s,p,d[C1, but also including some neurons p[C2). The third
cluster (red data points) corresponded to location-selective activity of neurons in the cortical networkC2(i.e. mainlys,d,p[C2). See
supplementary Fig. S6 for details on the composition of the three identified clusters.
We performed the same series of analyses on a dataset of medial PFC neurons recorded from navigating rats (see Materials and Methods, Sec. Statistical analysis of neural activities). We characterized every recorded activity according to the same set of statistical measures used for model neurons (i.e. mean firing rate, standard deviation, skewness, lifetime kurtosis, spatial information per spike and spatial mutual information, see Supplementary Text S2). Then, we applied a PCA on the resulting high dimensional space containing, per each neuron, the resulting values of these measures (see Figs. S4 B,D for details). Finally, we used the same unsupervised k-mean clustering algorithm to partition the data distribution in the space defined by the first three principal components. As for simulated data, the clustering method identified three main classes (Fig. 10B; with red, green, and blue data points corresponding to three subsets of electrophysiologically recorded activities in the PFC). We then compared model and experimental clusters (Figs. 10C,D,E) in order to investigate whether real and simulated data points belonging to the same clusters shared some discharge character-istics. In terms of mean spatial information (Fig. 10C), we found similar non-homogeneous distributions between model and real clusters. Both red clusters encoded the largest spatial information content. Recall that the model red cluster mainly contained activities from location-selective neuronss,d,p[C2(as quantified
in supplementary Fig. S6 B). When looking at mean firing rates averaged over each cluster (Fig. 10D), we found that both real and simulated activities within the blue clusters had significantly larger frequencies than others. The model blue cluster was mainly course profile of its neuron p activity (black crosses) or its neuron s activity (gray dots). (B) Asymmetric responses of model single neuronsp[C1(top
row) and of pyramidal cells recorded from the PFC of navigating rats (bottom row). (C) Sequence order coding carried out by a population of monkey PFC neurons (left; data courtesy of Averbeck et al. [65]). Each curve denotes the strength of the neural activity encoding a specific segment of a planned drawing sequence (the peak of each curve corresponds to the time when the segment is actually being drawn). Similarly, a sequence order coding property was observed when recording neuronspinC1of the model (right). Each curve measures the activity of a neuronpbelonging to a planned trajectory. The peaks of activity represent the times when places are actually visited.
composed by neurons v,q[C1,C2 propagating reward-related
information. Finally, when comparing the mean absolute values of the skewness of receptive fields (Fig. 10E), we found both model and experimental populations with asymmetric fields (i.e. non-zero skewness). Model-wise, the red and green clusters (containing neurons d,p[C1,C2, Fig. S6 B) had the largest mean skewness.
Similarly, experimental red and green subpopulations had larger skewness values than the blue population. As a control analysis, we computed the three mentioned measures (i.e. information per spike, mean firing rate and skewness of the receptive field) for two populations of neurons with random Uniform and Poisson activities. As shown in supplementary Fig. S7, unlike model data, the two populations of random neurons could not explain the experimental data in terms of information content and skewness of the receptive field. Taken together, these results indicated that, within the data set of experimental PFC recordings, subpopula-tions of neurons existed with distinct discharge properties, and that
these subpopulations might be related to distinct functional groups predicted by the model.
Discussion
We presented a model focusing on navigation planning mediated by a population of prefrontal cortical columns. During exploration of a new environment, the model learns a topological representation in which each place is encoded by a neocortical column and strengthening of synapses between columns is used to represent topological links between places. During goal-oriented trajectory planning, an activation diffusion mechanism produces a spread of activity in the column population leading to selection of the shortest path to the goal. Our simulation results demonstrate that the model can reproduce rodent behavior previously attributed to the animals’ ability to experience a cognitive ‘‘insight’’ about the structure of the environment [4]. Moreover,
Figure 9. Principal component analysis of simulated neuronal activities.(A) Simulated neurons represented within the space defined by the first three principal components. (B) Spatial information per spike averaged over each neural population of the model. (C) Mean firing rate averaged over each neural population.(D)Mean absolute skewness average over each population. The color code is the same used in (A).
we show that spatial planning in our model is invariant with respect to the size of the maze. This property relies on the ability of the model to encode cognitive maps with a resolution that fits the structure of the environment (e.g. alleys).
On the neural level, we characterized the activities of model neurons and compared them to electrophysiological data from real PFC neurons. Our neural response analysis suggests how the interplay between the model hippocampus and the prefrontal cortex can yield to the encoding of manifold information pertinent to the spatial planning function, including, for example, distance-to-goal correlates. The model also provides a functional framework for interpreting the activity of prefrontal units observed during performance of spatial memory tasks [20,35,60–63,65,66]. In general, our results are consistent with the hypothesis that cognitive control stems from the active maintenance of patterns of activity in the PFC that represent goals and means to achieve them [64].
Related work
Our model is based upon three main assumptions. First, the model relies on the columnar organization of the cortex. Although
this concept is supported by many experimental studies [45,48], no clear general function for columns has emerged to explain their role in cortical processing [69]. In addition, Rakic [70] stressed that the size, cell composition, synaptic organization, expression of signaling molecules, and function of various types of columns are dramatically different across the cortex, so that the general concept of column should be employed carefully. In our model, we call ‘‘column’’ a local micro-circuit composed by neurons processing common spatial information, and we propose that this columnar organization may be a substrate suitable to implement a topological representation of the environment. Second, our planning model relies on an activation diffusion mechanism. At the neural level, this suggests that strong propagation of action potentials should occur in the neocortex. This is not a strong assumption, since several studies have demonstrated such phenomena as propagating waves of activity in the brain [71,72]. For example, Rubino et al. [73] suggested that oscillations propagate as waves across the surface of the motor cortex, carrying relevant information during movement preparation and execution. Third, the multiscale representation is based on a putative w
Figure 10. Principal component analysis and unsupervised clustering of simulated and real neuronal activities.(A) Clustering of
model activities within the PCA space. The same color scheme (used to discriminate clusters) is applied throughout the entire figure. (B) Blind clustering of real PFC recordings represented in the three first principal components space.(C, D, E)Mean information per spike, firing rate and skewness for real vs. model subpopulations (i.e. clusters).
signal. There are several potential candidates for its implementa-tion in the brain. One of these candidates is habit learning involving the striatum [74,75]. Indeed, if for instance the rat always turns left at a particular location it may acquire a corresponding habit. The neural activity corresponding to this stimulus-response association may serve as the w signal. In this case, the time scale of learning in the C2 population should
correspond to the time scale of habit acquisition (potentially many trials, see e.g. [75]).
Topological map learning and path planning have been extensively studied in biomimetic models (see [6] for a general review; see also [76] for theoretical discussions on hierarchical cognitive maps). These models aimed at either providing more efficient path planning algorithms or, like our work, establishing relations between anatomical substrates, electrophysiology and behavior. In particular, several studies took inspiration from the anatomical organization of the cortex and used the activation diffusion mechanism to implement planning. Burnod [49] proposed one of the first models of the cortical column architecture, called ‘‘cortical automaton’’. He also described a ‘‘call tree’’ process that can be seen as a neuromimetic implementation of the activation diffusion principle. Some subsequent studies employed the cortical automaton concept [77,78], while others used either connectionist architectures [16,79–84] or Markov decision processes [85]. Our approach is similar to that of Hasselmo [44], who also addressed goal-directed behavior by modeling the PFC columnar structure. Both Hasselmo’s and our model architectures employ minicolumns as basic computational units to represent locations and actions, to propagate reward-dependent signals, and mediate decision making. Yet, the two models differ in the encoding principles underlying the learned representations, which generate, conse-quently, distinct behavioral responses. The connectivity layout of Hasselmo’s model allows state-response-state chains to be encoded, with each minicolumn representing either a state or an action. In our model, a state and its related actions are jointly encoded by a set of minicolumns within a column. Similar to Koene and Hasselmo [44,86], we compared the discharge of simulated PFC units against experimental recordings exhibiting place-, action- and reward-related correlates. As explained henceforth, we focused further on the functional relationship between the hippocampus and the PFC in encoding complemen-tary aspects of spatial memory, with a quantitative approach based on the analysis of statistical properties and information content of the neural codes. We also put the emphasis on the time course analysis of neural responses mediating place coding vs. decision making.
Differential roles of PFC and hippocampus in spatial learning
The successful performance of our model in large environments relies on its ability to build a multiscale environment representa-tion. This is in line with the proposal by McNamara et al. [87] who have suggested that humans can solve complex spatial problems by building a hierarchical cognitive map, including multiple representations of the same environment at different spatial scales. Moreover, animals may be able to chunk available information and build hierarchical representations to facilitate learning [88–92]. Recently, multiscale spatial representations have been identified at the neural level. For example in the entorhinal cortex, Hafting et al. [13] have shown that grid cells have spatial fields forming grids with different spacing and place field sizes. Kjelstrup et al. [93] have provided neural recordings of place cell activities in a large maze, supporting the multiscale coding
property in the hippocampus. These entorhinal and hippocampal multiscale representations are likely to encode spatial contextual information at variable resolution. Complementing this code, we suggest that multiscale representations related with space, action and reward should also be found in neocortical areas such as the prefrontal cortex, commonly associated with high-level cognitive processes. Moreover, there are several works suggesting a role of the PFC in the learning of hierarchical representations. For example, Botvinick [94] reviewed how the hierarchical reinforce-ment learning framework [95] could explain the mechanism by which the PFC aggregates actions into reusable subroutines or skills. The multiscale property is applied there for actions instead of states as in our approach. From a biological point of view, recent studies directly pointed out the role of the PFC for hierarchical representations, with a possible anatomical mapping of the hierarchical levels along the rostro-caudal axis of the PFC [96].
In spite of a possible complementary role for the PFC and the hippocampus in multiscale space coding, our work focuses on different roles of the PFC and the hippocampus in the planning process. Namely, we propose that the hippocampus is more involved in the representation of location [1] and, possibly, route learning [97,98], while the PFC is responsible for topological representations and action selection. From a more general perspective, a route could be seen as an example of navigation from a point to another, an episode. In contrast, the more integrated topological representation would be more similar to a set of navigation rules. This hypothesis is in accordance with data showing that the hippocampus would be involved in instance-based episodic memory, whereas the PFC would be linked to rule learning from examples [99–101].
Our model is consistent with recent studies suggesting a role for the PFC in prospective memory [102,103]. Goto and Grace [102] showed that, depending on the dopamine receptors activation, PFC either incorporates retrospective information processed by the hippocampus or processes its own information to effect preparation of future actions. This is in accordance with our model which includes hippocampal information to localize itself in the environment, and then propagates reward signal to generate a goal-directed sequence of action. Moreover, Mushiake et al. [104] showed that activity in the PFC reflects multiple steps of future events in action plans. They suggested that animals may be engaged in planning sequences in a retrograde order (starting from the goal to the first motion), in conjunction with a sequence planning with an anterograde order. At the cognitive level, the activation diffusion planning process provides a capacity of mental simulation of action selection: the back-propagated goal signal allows possible navigation trajectories to be identified, whereas the forward-propagated path signal actually simulates the execution of the selected action sequence. Schacter et al. [103] recently reviewed theories on simulation of future events and neural structures associated with this cognitive ability. They showed that the same core network, which plays a role in remembering, is also implied in mental simulation. This network involves prefrontal as well as medial temporal regions including the hippocampus, which is also involved in prospective and retrospective memory coding ([105,106]; see also [107,108] for theoretical works modeling the role of this core network in memory retrieval and mental imagery).
From neural activity in the PFC to behavior