Aged-Related Changes in Body Composition
and Association between Body Composition
with Bone Mass Density by Body Mass Index
in Chinese Han Men over 50-year-old
Ying Jiang
1,7☯, Ying Zhang
2☯, Mengmeng Jin
1,4, Zhaoyan Gu
4, Yu Pei
3,5*
‡, Ping Meng
6*
‡1Department of Geriatric Endocrinology, PLA General Hospital, Beijing, China,2Department of Geriatric Nephrology, PLA General Hospital, Beijing, China,3Endocrinology Department, PLA General Hospital, Beijing, China,4Hainan Branch Health care Department, PLA General Hospital, Sanya, China,5Hainan Branch Endocrinology Department, PLA General Hospital, Sanya, China,6Health care Department, PLA General Hospital, Beijing, China,7Hainan Branch Nursing Department, PLA General Hospital, Sanya, China
☯These authors contributed equally to this work.
‡These authors contributed equally to this work.
*[email protected](YP);[email protected](PM)
Abstract
Objectives
Aging, body composition, and body mass index (BMI) are important factors in bone mineral
density (BMD). Although several studies have investigated the various parameters and
fac-tors that differentially influence BMD, the results have been inconsistent. Thus, the primary
goal of the present study was to further characterize the relationships of aging, body
compo-sition parameters, and BMI with BMD in Chinese Han males older than 50 years.
Methods
The present study was a retrospective analysis of the body composition, BMI, and BMD of
358 Chinese male outpatients between 50 and 89 years of age that were recruited from our
hospital between 2009 and 2011. Qualified subjects were stratified according to age and
BMI as follows: 50
–
59 (n = 35), 60
–
69 (n = 123), 70
–
79 (n = 93), and 80
–
89 (n = 107) years
of age and low weight (BMI:
<
20 kg/m
2; n = 21), medium weight (20
BMI
<
24 kg/m
2; n =
118), overweight (24
BMI
<
28 kg/m
2; n = 178), and obese (BMI
28 kg/m
2; n = 41).
Dual-energy X-ray absorptiometry (DEXA) was used to assess bone mineral content
(BMC), lean mass (LM), fat mass (FM), fat-free mass (FFM), lumbar spine (L1-L4) BMD,
femoral neck BMD, and total hip BMD. Additionally, the FM index (FMI; FM/height
2), LM
index (LMI; LM/height
2), FFM index (FFMI; [BMC+LM]/height
2), percentage of BMC (%
BMC; BMC/[BMC+FM+LM] × 100%), percentage of FM (%FM; FM/[BMC+FM+LM] ×
100%), and percentage of LM (%LM; LM/(BMC+FM+LM) × 100%) were calculated.
Osteo-penia or osteoporosis was identified using the criteria and T-score of the World Health
Organization.
OPEN ACCESS
Citation:Jiang Y, Zhang Y, Jin M, Gu Z, Pei Y, Meng P (2015) Aged-Related Changes in Body Composition and Association between Body Composition with Bone Mass Density by Body Mass Index in Chinese Han Men over 50-year-old. PLoS ONE 10(6): e0130400. doi:10.1371/journal. pone.0130400
Editor:Jin-Ran Chen, UAMS, UNITED STATES
Received:February 9, 2015
Accepted:May 20, 2015
Published:June 19, 2015
Copyright:© 2015 Jiang et al. This is an open access article distributed under the terms of the
Creative Commons Attribution License, which permits unrestricted use, distribution, and reproduction in any medium, provided the original author and source are credited.
Data Availability Statement:All relevant data are within the paper and its supporting information files.
Funding:The authors received no specific funding for this work.
Results
Although there were no significant differences in BMI among the age groups, there was a
significant decline in height and weight according to age (
p
<
0.0001 and
p
= 0.0002,
respectively). The LMI and FFMI also declined with age (both
p
<
0.0001) whereas the FMI
exhibited a significant increase that peaked in the 80-89-years group (
p
= 0.0145). Although
the absolute values of BMC and LM declined with age (
p
= 0.0031 and
p
<
0.0001,
respec-tively), there was no significant difference in FM. In terms of body composition, there were
no significant differences in %BMC but there was an increase in %FM (
p
<
0.0001) and a
decrease in %LM (
p
<
0.0001) with age. The femoral neck and total hip BMD significantly
declined with age (
p
<
0.0001 and
p
= 0.0027, respectively) but there were no differences in
L1-L4. BMD increased at all sites (all
p
<
0.01) as BMI increased but there were declines in
the detection rates of osteoporosis and osteopenia (both
p
<
0.001). A logistic regression
revealed that when the medium weight group was given a BMI value of 1, a decline in BMI
was an independent risk factor of osteoporosis or osteopenia, while an increase in BMI was
a protective factor for BMD. At the same time, BMD in L1-L4 exhibited a significant positive
association with FMI (
p
= 0.0003) and the femoral neck and total hip BMDs had significant
positive associations with FFMI and LMI, respectively (both
p
<
0.0001).
Conclusions
These data indicate that LMI and FFMI exhibited significant negative associations with
aging in Chinese Han males older than 50 years, whereas FMI had a positive association.
BMD in the femoral neck and total hip declined with age but an increased BMI was
protec-tive for BMD. LMI and FFMI were protecprotec-tive for BMD in the femoral neck and total hip.
Introduction
Because the average life expectancy has increased in recent years, the presence of health
prob-lems in the elderly has become a prevalent issue. Osteoporosis and osteopenia, or a decline in
bone mineral density (BMD) that leads to an increased risk of fracture, are both causes of
mor-tality and disability in elderly adults and represent an enormous cost to health care [
1
].
The nature of the relationships of body composition parameters with variations in BMD
has been highly contentious. Moreover, few studies have investigated the BMDs of different
skeleton sites according to body mass index (BMI) in males. Several studies have demonstrated
that both FM and LM contribute to the determination of bone mass [
7
,
8
] while others have
found that LM has a greater impact on BMD and may protect against the risk of fractures [
9
–
12
]. On the other hand, other studies have suggested that FM, rather than LM, is the most
important determining factor for BMD [
13
–
15
] and that FM might positively contribute to
BMD only in older males [
16
]. The discrepant findings of these studies suggest that BMD is
dependent on a variety of factors including gender, ethnicity, BMI, and age.
Previous studies evaluating the preservation of BMD have found that BMI is an important
indicator of bone tissue structure [
17
–
19
] and that it is related to the risk of osteoporotic
frac-tures [
20
,
21
]. Moreover, BMI is one of the least complicated and most frequently used
indica-tors of health that is significantly related to BMD [
22
]. Relative to a BMI of 25 kg/m
2, a BMI of
20 kg/m
2is associated with a nearly twofold increase in the risk ratio of hip fracture [
23
] while
a BMI of 30 kg/m
2is associated with an only 17% reduction in the risk of hip fracture.
There-fore, a low BMI confers a substantial risk for all fractures that is largely independent of age and
sex but dependent on BMD.
To better characterize this risk, the present study investigated age-related changes in body
composition and BMD and the relationship between BMI and BMD in Chinese Han males
over 50 years of age. Additionally, the relative contributions of various body composition
parameters to BMD at different skeletal sites were evaluated based on BMI. This study aimed
to provide new information regarding potential pharmaceutical targets for the development of
osteoporosis therapies.
Materials and Methods
Subjects
The present study initially recruited and evaluated 392 Chinese male outpatients over
50-year-old who had undergone routine physical check-ups and dual energy X-ray absorptiometry
(DEXA) in our hospital from 2009
–
2011. Exclusion criteria were history of metabolic bone
dis-eases such as chronic liver or renal failure, hyperthyroidism and rheumatoid arthritis; history
of diseases affecting body weights or composition such as thyrotoxicosis, hypothyroidism; the
presence of major debilitating disease; major cardiovascular events; none of the subjects had
primary or secondary low levels of gonadal hormones or had treated with medicine capable of
influencing BMD, weight and body composition such as thyroid hormones,
glucocorticoster-oids, bisphosphonates and anti-obesity drugs within the previous 3 months. In the end, 358
men were included in the analysis and stratified into four age groups: 50
–
59 (n = 35), 60
–
69
(n = 123), 70
–
79 (n = 93), and 80
–
89 (n = 107) years of age. An experienced operator collected
the measurements of body composition parameters, BMI, and BMD.
Ethics Statement
Anthropometric Measurements
A variety of anthropometric measurements, including weight and height, were measured while
the subjects were in light clothing without shoes. Body weight was measured to the nearest 0.1
kg and body height was measured with a hypsometer to the nearest 0.1 cm; both values were
recorded as the mean of three measures. BMI was calculated as follows: [weight (kg)/height
(m
2)]. In China, BMI was divided into three levels as normal weight (18.5
BMI
<
24 kg/m2),
overweight (24
BMI
<
28 kg/m2), and obesity (BMI
28 kg/m2) [
24
–
26
]. According to our
original data, there was no patients`BMI less than 18.5kg/m2. In western countries [
23
], there
was a comparison of BMI
25 kg/m2 and
<
20 kg/m2 in hip fracture. Subsequently, we divided
BMI into four groups, low weight (BMI
<
20 kg/m2;n = 21), medium weight (20
BMI
<
24
kg/m2; n = 118), overweight (24
BMI
<
28 kg/m2; n = 178) and obese (BMI
28 kg/m2;
n = 41) [
27
].
BMD and Body Composition Measurements
All subjects had undergone dual-energy x-ray absorptiometry (DXA) scan (GE Lunar Prodigy
Advance; GE Healthcare, WI, USA), with an in vivo precision (% coefficient of variation) of
<
1% for anterior
–
posterior spinal, femoral, total body BMD and body composition, which is
increasingly used for a variety of clinical and research applications to assess BMD and body
composition.
BMD (g/cm2) was measured in the lumbar spine (L1-L4), femoral neck, and total hip.
[
28
,
29
] The accurate and precise values of these body composition parameters were also
esti-mated from the DXA scan of the total body, which included BMC, LM, FM, and FFM.
Addi-tionally, the FM index (FMI; FM/height2), LM index (LMI; LM/height2), FFM index (FFMI;
[BMC+LM]/height2), percentage of BMC (%BMC; BMC/[BMC+FM+LM] × 100%),
percent-age of FM (%FM; FM/[BMC+FM+LM] × 100%), and percentpercent-age of LM (%LM; LM/(BMC
+FM+LM) × 100%) were calculated. All scans were acquired and analyzed by the same
experi-enced operator, adhering to the guidelines provided by the manufacturer.
Osteopenia or Osteoporosis Diagnoses
The diagnoses of osteopenia and osteoporosis were made using the T-score criteria of the
World Health Organization (WHO; -2.5
<
T-score
<
-1 and T-score
-2.5, respectively). If a
subject had a low T-score based on the BMD of L1-L4, femoral neck, or total hip, then that
sub-ject was classified as having osteoporosis or osteopenia.
Statistical Analysis
All data were entered using Microsoft Excel 2010 for Windows and analyzed with SPSS version
19.0 (IBM Corporation; Armonk, New York). The data are presented as the means ± standard
deviations (SD) for continuous variables and as frequencies for categorical variables. For the
continuous variables, a one-way analysis of variance (ANOVA) was used to compare the
asso-ciations among the anthropometric data, body composition parameters, and absolute values of
the BMDs at different sites among the different age groups. The absolute values of the BMDs in
the different BMI groups and the associations among the body composition parameters and
the BMDs at different sites were also assessed by ANOVA. Chi-squared tests were used to
com-pare the detection rates of osteoporosis or osteopenia among the BMI groups and an ordinal
logistic regression was used to determine whether there were linear relationships among the
detection rates of osteoporosis or osteopenia and the BMI groups. A p value
<
0.05 was
Results
Subject Characteristics
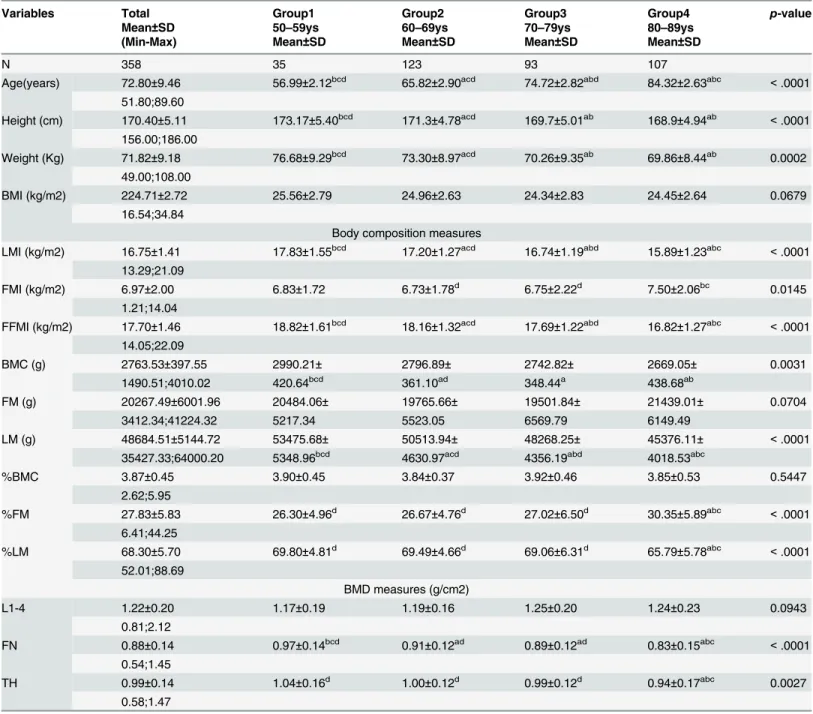
The basic characteristics of the subjects are described in
Table 1
. Although there were no
signif-icant differences in BMI among the age groups, there was a signifsignif-icant decline in height and
weight according to age (
p
<
0.0001 and
p
= 0.0002, respectively). The absolute values for
BMC and LM declined with age (
p
= 0.0031 and
p
<
0.0001, respectively) but there were no
sig-nificant differences in FM (
p
= 0.0704).
Table 1
also shows the changes in BMI, LMI, FMI, and
FFMI according to age. The LMI and FFMI exhibited significant declines with age (both
p
<
0.0001) but there was a significant increase in FMI in the 80
–
89-years age group
(
p
= 0.0145). These changes are also depicted in graphical form (
Fig 1
,
S1 Table
).
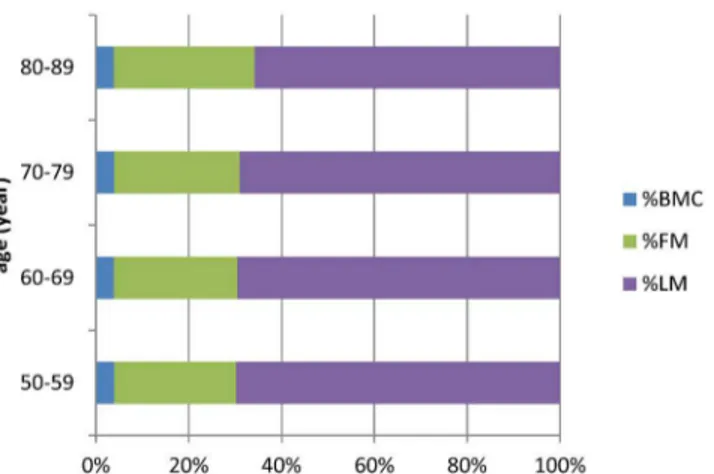
According to the body composition data, there were no significant differences in %BMC
among the age groups (
p
= 0.5447), but there was an increase in %FM (
p
<
0.0001) and a
decrease in %LM (
p
<
0.0001;
Table 1
). Similarly, there was a significant increase in %FM and a
significant decrease in %LM in the 80
–
89-years age group (
Fig 2
,
S2 Table
). BMD in the femoral
neck and total hip exhibited significant declines with age (
p
<
0.0001 and
p
= 0.0027,
respec-tively) but there was no difference in BMD at L1-L4 (
p
= 0.0943;
Table 1
,
Fig 3
,
S3 Table
).
BMI and BMD Analyses
To investigate the interaction between BMI and BMD, the subjects were categorized into four
groups based on BMI. The absolute values of the BMDs at each of the different sites showed
significant positive associations with BMI (all
p
<
0.01;
Table 2
). Additionally, there was a
posi-tive correlation between BMI and the absolute values of the BMDs such that they increased in
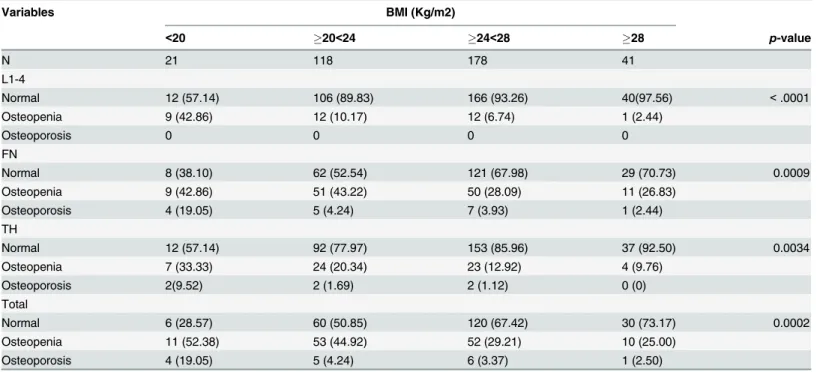
conjunction with each other. The detection rates of osteoporosis and osteopenia had significant
negative associations with BMI but osteoporosis was not correlated with BMD at L1-L4 (all
p
<
0.001;
Table 3
).
Risk Factors
A logistic regression model was used to evaluate the odds ratios (ORs) and 95% confidence
intervals (CIs) of having osteoporosis or osteopenia for each BMI group compared with the
highest group with adjustments for age. The risk of having osteoporosis or osteopenia
progres-sively increased from the highest BMI group to the lowest BMI group. After adjusting for age,
the multivariable adjusted ORs for osteoporosis or osteopenia in the lowest BMI group and the
highest BMI group were 2.69 (95% CI: 1.06
–
6.83,
p
= 0.038) and 0.45 (95% CI: 0.20
–
0.99,
p
= 0.046) compared to the normal BMI group (
Table 4
).
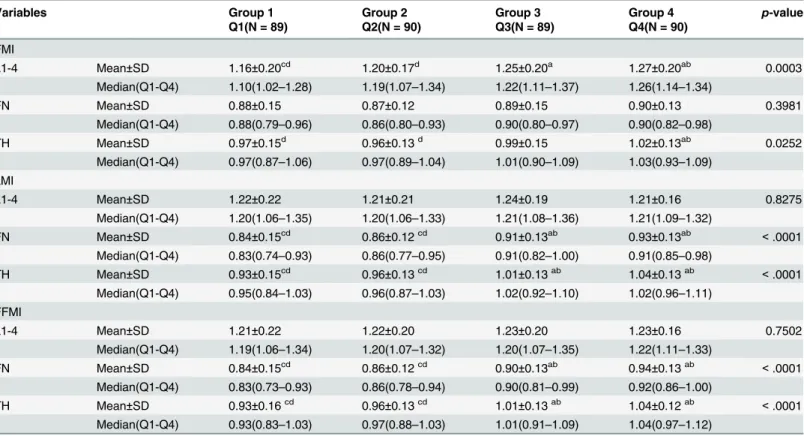
Analysis of body composition parameters and BMD
Table 5
shows the changes in BMD at different sites based on FMI, LMI, and FFMI quartiles.
According to the FMI quartiles, there were no significant differences in BMD in the femoral
neck (
p
= 0.3981) but the BMDs in L1-L4 were significantly higher as the FMI quartiles
increased (
p
= 0.0003). BMD in the femoral neck and total hip also significantly increased as
the LMI and FFMI increased (all
p
<
0.0001).
Discussion
Table 1. Subject characteristics by aging.
Variables Total Group1 Group2 Group3 Group4 p-value
Mean±SD 50–59ys 60–69ys 70–79ys 80–89ys
(Min-Max) Mean±SD Mean±SD Mean±SD Mean±SD
N 358 35 123 93 107
Age(years) 72.80±9.46 56.99±2.12bcd 65.82±2.90acd 74.72±2.82abd 84.32±2.63abc <.0001 51.80;89.60
Height (cm) 170.40±5.11 173.17±5.40bcd 171.3±4.78acd 169.7±5.01ab 168.9±4.94ab <.0001 156.00;186.00
Weight (Kg) 71.82±9.18 76.68±9.29bcd 73.30±8.97acd 70.26±9.35ab 69.86±8.44ab 0.0002 49.00;108.00
BMI (kg/m2) 224.71±2.72 25.56±2.79 24.96±2.63 24.34±2.83 24.45±2.64 0.0679
16.54;34.84
Body composition measures
LMI (kg/m2) 16.75±1.41 17.83±1.55bcd 17.20±1.27acd 16.74±1.19abd 15.89±1.23abc <.0001 13.29;21.09
FMI (kg/m2) 6.97±2.00 6.83±1.72 6.73±1.78d 6.75±2.22d 7.50±2.06bc 0.0145
1.21;14.04
FFMI (kg/m2) 17.70±1.46 18.82±1.61bcd 18.16±1.32acd 17.69±1.22abd 16.82±1.27abc <.0001 14.05;22.09
BMC (g) 2763.53±397.55 2990.21± 2796.89± 2742.82± 2669.05± 0.0031
1490.51;4010.02 420.64bcd 361.10ad 348.44a 438.68ab
FM (g) 20267.49±6001.96 20484.06± 19765.66± 19501.84± 21439.01± 0.0704
3412.34;41224.32 5217.34 5523.05 6569.79 6149.49
LM (g) 48684.51±5144.72 53475.68± 50513.94± 48268.25± 45376.11± <.0001
35427.33;64000.20 5348.96bcd 4630.97acd 4356.19abd 4018.53abc
%BMC 3.87±0.45 3.90±0.45 3.84±0.37 3.92±0.46 3.85±0.53 0.5447
2.62;5.95
%FM 27.83±5.83 26.30±4.96d 26.67±4.76d 27.02±6.50d 30.35±5.89abc <.0001
6.41;44.25
%LM 68.30±5.70 69.80±4.81d 69.49±4.66d 69.06±6.31d 65.79±5.78abc <.0001
52.01;88.69
BMD measures (g/cm2)
L1-4 1.22±0.20 1.17±0.19 1.19±0.16 1.25±0.20 1.24±0.23 0.0943
0.81;2.12
FN 0.88±0.14 0.97±0.14bcd 0.91±0.12ad 0.89±0.12ad 0.83±0.15abc <.0001
0.54;1.45
TH 0.99±0.14 1.04±0.16d 1.00±0.12d 0.99±0.12d 0.94±0.17abc 0.0027
0.58;1.47
Abbreviations: N = number, BMI = body mass index, FMI = fat mass index, LMI = lean mass index, FFMI = fat free mass index, BMC = bone mineral content, FM = fat mass, LM = lean mass, BMD = bone mineral density, L1-4 = lumbar spine1-4, FN = femoral neck, TH = total hip, SD = standard deviation.
p-value is the analysis of variance between groups. ais Group 2,3,4 VS Group1,
p<0.05. bis Group 1,3,4 VS Group2,
p<0.05. c
is Group 1,2,4 VS Group3,p<0.05. dis Group 1,2,3 VS Group4,
p<0.05.
Fig 1. Trend of BMI, LMI, FMI, FFMI with aging.
doi:10.1371/journal.pone.0130400.g001
Fig 2. The proportion of body composition change in different age group.
doi:10.1371/journal.pone.0130400.g002
Fig 3. Trend of BMD at different site with aging.
demonstrated that LM, LMI, %LM and BMC diminished with age, which is consistent with
previous reports [
27
]. FM, another important body composition parameter, did not exhibit
age-related changes but there was a tendency to increase in the 80
–
89-years age group.
More-over, FMI and %FM peaked in the 80
–
89-years age group.
As age increased, there was a decline in body weight that was reflected in the reduced values
of the body composition parameters. There are several factors influencing the body
Table 2. The change of absolute value in BMD at different site by different BMI level.
Variables BMI (Kg/m2)
Group 1 Group 2 Group 3 Group 4 p-value
<20 20<24 24<28 28
N 21 118 178 41
L1-4 1.09±0.21bcd 1.20±0.19ac 1.24±0.20ab 1.25±0.17a 0.0038
FN 0.80±0.17bcd 0.87±0.13ad 0.89±0.13a 0.94±0.14ab 0.0011
TH 0.86±0.17bcd 0.96±0.14acd 1.00±0.13abd 1.05±0.14abc <0.001
Abbreviations: N = number, BMI = body mass index, L1-4 = lumbar spine1-4, FN = femoral neck, TH = total hip. p-value is the analysis of variance between groups.
a
is Group 2,3,4 VS Group1,p<0.05. b
is Group 1,3,4 VS Group2,p<0.05. cis Group 1,2,4 VS Group3,
p<0.05. d
is Group 1,2,3 VS Group4,p<0.05.
doi:10.1371/journal.pone.0130400.t002
Table 3. The detection rate of osteoporosis or osteopenia by different BMI level.
Variables BMI (Kg/m2)
<20 20<24 24<28 28 p-value
N 21 118 178 41
L1-4
Normal 12 (57.14) 106 (89.83) 166 (93.26) 40(97.56) <.0001
Osteopenia 9 (42.86) 12 (10.17) 12 (6.74) 1 (2.44)
Osteoporosis 0 0 0 0
FN
Normal 8 (38.10) 62 (52.54) 121 (67.98) 29 (70.73) 0.0009
Osteopenia 9 (42.86) 51 (43.22) 50 (28.09) 11 (26.83)
Osteoporosis 4 (19.05) 5 (4.24) 7 (3.93) 1 (2.44)
TH
Normal 12 (57.14) 92 (77.97) 153 (85.96) 37 (92.50) 0.0034
Osteopenia 7 (33.33) 24 (20.34) 23 (12.92) 4 (9.76)
Osteoporosis 2(9.52) 2 (1.69) 2 (1.12) 0 (0)
Total
Normal 6 (28.57) 60 (50.85) 120 (67.42) 30 (73.17) 0.0002
Osteopenia 11 (52.38) 53 (44.92) 52 (29.21) 10 (25.00)
Osteoporosis 4 (19.05) 5 (4.24) 6 (3.37) 1 (2.50)
Abbreviations: N = number, BMI = body mass index, L1-4 = lumbar spine1-4, FN = femoral neck, TH = total hip.
Total means any of the three sites detected for osteoporosis or osteopenia that is considered as osteoporosis or osteopenia. p-value is the result of chi-square test.
composition. Previous studies [
4
,
30
–
33
] indicated that aging and estrogen levels of menopause
are two important ones in postmenopausal women. Serum levels of sclerostin [
34
] may also
play a key role. In men, except aging, sex steroid hormone levels [
35
,
36
] may have association
with the parameters of body composition, but the results are still equivocal.
Table 4. Comparison of the detection rate of osteopenia or osteoporosis in different BMI group.
BMI Unadjusted-OR Adjusted-OR*
(Kg/m2) OR (95%CI) p-value Adj.OR (95%CI) p-value
<20 3.105(1.233–7.818) 0.0162 2.688(1.057–6.833) 0.0378
20<24 1 1
24<28 0.513(0.320–0.823) 0.0057 0.461(0.283–0.751) 0.0019
28 0.405(0.186–0.879) 0.0224 0.445(0.201–0.986) 0.0461
Abbreviations: BMI = body mass index, OR = odd ratio, Adj.OR = adjusted odd ratio, CI = confidence interval, Adjusted-OR
*: adjusted for age.
doi:10.1371/journal.pone.0130400.t004
Table 5. Comparison the change of BMD at different site based on the quartile of FMI, LMI and FFMI.
Variables Group 1 Group 2 Group 3 Group 4 p-value
Q1(N = 89) Q2(N = 90) Q3(N = 89) Q4(N = 90)
FMI
L1-4 Mean±SD 1.16±0.20cd 1.20±0.17d 1.25±0.20a 1.27±0.20ab 0.0003
Median(Q1-Q4) 1.10(1.02–1.28) 1.19(1.07–1.34) 1.22(1.11–1.37) 1.26(1.14–1.34)
FN Mean±SD 0.88±0.15 0.87±0.12 0.89±0.15 0.90±0.13 0.3981
Median(Q1-Q4) 0.88(0.79–0.96) 0.86(0.80–0.93) 0.90(0.80–0.97) 0.90(0.82–0.98)
TH Mean±SD 0.97±0.15d 0.96±0.13d 0.99±0.15 1.02±0.13ab 0.0252
Median(Q1-Q4) 0.97(0.87–1.06) 0.97(0.89–1.04) 1.01(0.90–1.09) 1.03(0.93–1.09) LMI
L1-4 Mean±SD 1.22±0.22 1.21±0.21 1.24±0.19 1.21±0.16 0.8275
Median(Q1-Q4) 1.20(1.06–1.35) 1.20(1.06–1.33) 1.21(1.08–1.36) 1.21(1.09–1.32)
FN Mean±SD 0.84±0.15cd 0.86±0.12cd 0.91±0.13ab 0.93±0.13ab <.0001
Median(Q1-Q4) 0.83(0.74–0.93) 0.86(0.77–0.95) 0.91(0.82–1.00) 0.91(0.85–0.98)
TH Mean±SD 0.93±0.15cd 0.96±0.13cd 1.01±0.13ab 1.04±0.13ab <.0001
Median(Q1-Q4) 0.95(0.84–1.03) 0.96(0.87–1.03) 1.02(0.92–1.10) 1.02(0.96–1.11) FFMI
L1-4 Mean±SD 1.21±0.22 1.22±0.20 1.23±0.20 1.23±0.16 0.7502
Median(Q1-Q4) 1.19(1.06–1.34) 1.20(1.07–1.32) 1.20(1.07–1.35) 1.22(1.11–1.33)
FN Mean±SD 0.84±0.15cd 0.86±0.12cd 0.90±0.13ab 0.94±0.13ab <.0001
Median(Q1-Q4) 0.83(0.73–0.93) 0.86(0.78–0.94) 0.90(0.81–0.99) 0.92(0.86–1.00)
TH Mean±SD 0.93±0.16cd 0.96±0.13cd 1.01±0.13ab 1.04±0.12ab <.0001
Median(Q1-Q4) 0.93(0.83–1.03) 0.97(0.88–1.03) 1.01(0.91–1.09) 1.04(0.97–1.12) Abbreviations: N = number, BMI = body mass index, L1-4 = lumbar spine1-4, FN = femoral neck, TH = total hip.
p-value is the analysis of variance between groups. ais Group 2,3,4 VS Group1,
p<0.05. bis Group 1,3,4 VS Group2,
p<0.05. cis Group 1,2,4 VS Group3,
p<0.05. dis Group 1,2,3 VS Group4,
p<0.05.
There are several ways for assessing body composition, such as anthropometry, bioelectrical
impedance analysis (BIA), magnetic resonance imaging (MRI) and computed tomography
(CT), dual-energy X-ray absorptiometry (DXA)[
37
–
42
]. BIA is a kind of screening method
which is lack of accuracy. CT and MRI are more accurate in assessing muscle and fat areas in
cadaveric studies [
43
,
44
]. However, they are expensive, time-consuming and/or require
radia-tion, and have limited availability. DXA has relative availability, inexpensive, and low radiation
dose. Studies also have shown strong correlations between body composition parameters
obtained by DXA and by CT or MRI in adults. [
38
–
40
,
45
–
47
]. For the past two decades, DXA
have been characterized for a time-efficient and minimal-risk method of assessing both BMD
and body composition.
FM accounts for approximately 16% of total body weight in normal-weight males, and %
FM tends to increase until approximately 90 years of age [
48
]. Several studies [
5
,
49
,
50
] have
observed that FM increases after 74 years of age and %FM increased throughout the lifetime of
males. The present findings support these results but neither the present nor previous studies
could confirm a highly significant curvilinear relationship between age and FM. It has been
noted that FM peaks in late middle age [
51
] and, therefore, it appears that age-related changes
in body composition are complicated and need to be confirmed by longitudinal studies.
LM decreases after 60 years of age and is associated with body weight [
52
,
53
]. In the our
study, LM was highest in the age 50
–
59-years but declined thereafter, probably because the
weight gains of the subjects were no longer sufficient to offset the inevitable loss of LM that
occurs with aging. The reduction rates of BMC and LM might exceed the rate of FM increasing,
which may be the reason for the decreased body weight. The tendencies of BMC, LM, and FM
to decrease with aging in Chinese Han elderly males may be etiological factors associated with
the development of other diseases, such as age-related losses of muscle mass or sarcopenia.
Human bone tissue begins to decline at approximately 40 years of age due to the
dysfunc-tion of osteoblasts and a relative increase in the reabsorpdysfunc-tion of osteoclasts, which results in the
decrease of bone mass. In the present study, BMD had a negative association with BMI and
higher levels of obesity decreased the risk of osteoporosis or osteopenia. Males with a
BMI
<
20 had a 6.04-fold higher age-adjusted risk of osteoporosis than those with a BMI
28,
which is similar to the previous study[
54
]. A hospital-based study of elderly males suggested
that overweight and obese males are more likely to have osteoporosis and osteopenia [
55
]
while another study found that a lower BMI is associated with lower BMD [
56
]. The
mecha-nisms whereby adipose tissue exerts positive effects on BMD remain unclear. However, it is
possible that the association of obesity with BMD is based in the conversion of androgen to
estrogen [
57
], which improves bone mass in both males and females [
58
,
59
] and maintains
healthy plasma levels of insulin and regulating factors such as insulin-like growth factor-1,
lep-tin, and adiponectin [
60
]. Additionally, obesity can also provide cushioning for the hip in the
event of a fall [
20
].
A previous study of 1000 males between 71 and 90 years old indicated that the radiographic
features of lumbar disc degeneration, anterior osteophytes, and end-plate sclerosis were
associ-ated with BMD increasing in the lumbar spine [
67
]. However, BMD in the femoral neck and
total hip are considerably less affected by other factors [
68
]. The present study also demonstrated
that BMD in the femoral neck and total hip were significantly influenced by aging. But there was
no change in BMD in the lumbar spine, which has been reported [
28
]. Therefore, it may be
con-cluded that LMI and FFMI had a stronger relationship with BMD than FMI in elderly males.
As an important component of body weight, skeletal muscle contributes to LM and FFM
plays an important role in bone biomechanics. As a complete unit of motor function, bone and
skeletal muscle are closely linked. The stress generated by muscle contractions can lead to
bone-specific deformations of bone tissue which, in turn, stimulates bone cells and osteoblasts,
increases the synthesis and expression of osteoblast-related genes, and improves bone level so
that the skeleton can adapt to applied pressure. A lesser degree of LM or FFM can account for a
lack of physical exercise and, in fact, there are significant associations among a lack of physical
exercise and low bone mass. Muscle, a primary contributing factor to LM and FFM, contracts
to produce mechanical strength and regulates variations in BMD. Muscle contractions are
important factors that contribute to increased bone mass and which can produce mechanical
stress, which irritates osteoblasts and increases bone formation. LM or FFM can vary, therefore,
the adoption of a healthy lifestyle that includes movement and exercise should be encouraged
so as to increase mechanical load and enhance lean body mass. Ultimately, this will increase
BMC and reduce the risk of osteoporosis.
In summary, the present study revealed an age-associated decline in BMD in the femoral
neck and total hip of elderly males. Furthermore, the present findings suggest that LM and
FFM may be important determinants of BMD in the femoral neck and total hip. Based on
these data, it appears that lifestyle factors, including physical activity, that benefit bone health
and LM or FFM should be encouraged to prevent diseases such as osteoporosis or sarcopenia.
Our study has some limitations. Firstly, as a cross-sectional study, though had enough
sam-ples, the present analysis is limited in its ability to elucidate causal relationships between aging,
body composition parameters and BMD. Secondly BMD does not represent the entirety of
bone mass, thus, further study is required to elucidate the relationships among body
composi-tion parameters and the risk of fracture. Thirdly, DXA has relative availability, inexpensive,
and low radiation dose. But DXA is still not the golden stander in measuring body
composi-tion. It may have some deviacomposi-tion. Fourthly, the study cohort has the limitation of region and
ethnicity.
Supporting Information
S1 Table. The data of Body mass index(BMI), lean mass index(LMI), fat mass index(FMI)
and fat free mass index(FFMI) in different age group.
(XLS)
S2 Table. The data of proportion of body composition in different age group.
(XLS)
S3 Table. The data of BMD value in different age group.
(XLS)
Acknowledgments
unrestricted support of this work. We are also grateful to the PLA general hospital, the
Depart-ment of Geriatric Endocrinology for supporting this study.
Author Contributions
Conceived and designed the experiments: YJ YZ YP PM. Performed the experiments: YJ YZ
YP. Analyzed the data: YJ YZ MMJ ZYG. Contributed reagents/materials/analysis tools: YJ YZ
ZYG. Wrote the paper: YJ. Conception of the manuscript: YJ YZ YP PM. Critical revisions: YP
PM.
References
1. Edelstein SL, Barrett-Connor E (1993) Relation between Body Size and Bone Mineral Density in Elderly Men and Women. Am J Epidemiol 138(3): 160–169. PMID:8356959
2. Reid IR, Ames R, Evans MC, Sharpe S, Gamble G, France JT, et al. (1992) Determinants of total body and regional bone mineral density in normal postmenopausal women—a key role for fat mass. J Clin Endocrinol Metab 75: 45–51. PMID:1619030
3. Felson DT, Zhang Y, Hannan MT, Anderson JJ (1993) Effects of weight and body mass index on bone mineral density in men and women: the Framingham study. J Bone Miner Res 8(5): 567–573. PMID:
8511983
4. Reid IR (2002) Relationships among body mass, its components, and bone. Bone (NY) 31:547–555. PMID:12477567
5. Kyle UG, Genton L, Slosman DO, Pichard C (2001) Fat-free and fat mass percentiles in 5225 healthy subjects aged 15 to 98 years. Nutrition 17:534–541. PMID:11448570
6. Soo Lim, Hyojee Joung, Chan Soo Shin (2004) Body composition changes with age have gender-spe-cific impacts on bone mineral density. Bone 35:792–798. PMID:15336618
7. Pluijm SM, Visser M, Smit JH, Popp-Snijders C, Roos JC, Lips P (2001) Determinants of bone mineral density in older men and women: body composition as mediator. J Bone Miner Res 16:2142–2151. PMID:11697812
8. Park JH, Song YM, Sung J, Lee K, Kim YS, Kim T, et al. (2012) The association between fat and lean mass and bone mineral density: the Healthy Twin Study. Bone 50:1006–1011. doi:10.1016/j.bone. 2012.01.015PMID:22306928
9. Douchi T, Kuwahata R, Matsuo T, Uto H, Oki T, Nagata Y (2003) Relative contribution of lean and fat mass component to bone mineral density in males. J Bone Miner Metab 21:17–21. PMID:12491089
10. Hsu YH, Venners SA, Terwedow HA, Feng Y, Niu T, Li Z, et al. (2006) Relation of body composition, fat mass, and serum lipids to osteoporotic fractures and bone mineral density in Chinese men and women. Am J Clin Nutr 83:146–154. PMID:16400063
11. Kim JH, Choi HJ, Kim MJ, Shin CS, Cho NH (2012) Fat mass is negatively associated with bone min-eral content in Koreans. Osteoporos Int 23:2009–2016. doi:10.1007/s00198-011-1808-6PMID:
22006041
12. Moseley KF, Dobrosielski DA, Stewart KJ, De Beur SM, Sellmeyer DE (2011) Lean mass and fat mass predict bone mineral density in middle- aged individuals with noninsulin-requireing type 2 diabetes mel-litus. Clin Endocrinol (Oxf) 74:565–571. doi:10.1111/j.1365-2265.2010.03965.xPMID:21198741
13. Lee KG, Lee H, Ha JM, Lee YK, Kang HJ, Park CG, et al. (2012) Increased human tumor necrosis fac-tor-αlevels induce procoagulant change in porcine endothelial cells in vitro. Xenotransplantation
19:186–195. doi:10.1111/j.1399-3089.2012.00704.xPMID:22702470
14. Edelstein SL, Barrett-Connor E (1993) Relation between body size and bone mineral density in elderly men and women. Am J Epidemiol 138:160–169. PMID:8356959
15. Makovey J, Naganathan V, Sambrook P (2005) Gender differences in relationships between body com-position components, their distribution and bone mineral density: a cross-sectional opposite sex twin study. Osteoporos Int 16:1495–1505. PMID:15838718
16. Cui LH, Shin MH, Kweon SS, Park KS, Lee YH, Chung EK, et al. (2007) Relative contribution of body composition to bone mineral density at different sites in men and women of South Korea. J Bone Miner Metab 25(3): 165–171. PMID:17447114
18. Bredella MA, Torriani M, Ghomi RH, Thomas BJ, Brick DJ, Gerweck AV, et al. (2011) Determinants of bone mineral density in obese premenopausal women. Bone 48:748–754. doi:10.1016/j.bone.2010. 12.011PMID:21195217
19. Park JJ, Shin J, Youn Y, Champagne C, Jin E, Hong S, et al. (2010) Bone mineral density, body mass index, postmenopausal period and outcomes of low back pain treatment in Korean postmenopausal women. Eur. Spine J. 19:1942–1947. doi:10.1007/s00586-010-1559-7PMID:20811756
20. Cummings SR, Nevitt MC, Browneretal WS (1995) Riskfactors for hip fracture in white women. The New England Journal of Medicine 332(12): 767–773. PMID:7862179
21. Porthouse J, Birks YF, Torgerson DJ, Cockayne S, Puffer S, Watt I (2004) Risk factors for fracture in a UK population: a prospective cohort study. QJM 97(9):569–574. PMID:15317925
22. Skrzek A, KoziełS, Ignasiak Z (2014) The optimal value of BMI for the lowest risk of osteoporosis in postmenopausal women aged 40–88 years. HOMO Jun; 65(3): 232–239. doi:10.1016/j.jchb.2014.01. 003PMID:24794462
23. De Laet C, Kanis JA, Odé n A, Johanson H, Johnell O, Delmas P, et al. (2005) Body mass index as a predictor of fracture risk: A meta-analysis. Osteoporos Int 16:1330–1338. PMID:15928804
24. Chen CM (2008) Overview of obesity in mainland China. Obes Rev 9(Suppl 1):14–21 doi:10.1111/j. 1467-789X.2007.00433.xPMID:18307694
25. Wang Y, Mi J, Shan XY,et al (2007) Is China facing an obesity epidemic and the consequences? The trends in obesity and chronic disease in China. Int J Obes 31(1):177–188 PMID:16652128
26. Zhou BF, Cooperative Meta-Analysis Group of the Working Group on Obesity in China (2002) Predic-tive values of body mass index and waist circumference for risk factors of certain related diseases in Chinese adults—study on optimal cut-off points of body mass index and waist circumference in Chi-nese adults. Biomed Environ Sci 15(1):83–96 PMID:12046553
27. Baumgartner RN, Koehler KM, Gallagher D, Romero L, Heymsfield SB, Ross RR, et al. (1998) Epidemi-ology of sarcopenia among the elderly in New Mexico. Am J Epidemiol 147:755–763. PMID:9554417
28. Liu M, Zhang Y, Cheng X, Lu Y, Li N, Gong Y, et al. (2014) The effect of age on the changes in bone mineral density and osteoporosis detection rates in Han Chinese men over the age of 50. Aging Male 17(3): 166–173. doi:10.3109/13685538.2014.940308PMID:25027466
29. Watts NB, Adler RA, Bilezikian JP, Drake MT, Eastell R, Orwoll ES, et al. (2012) Osteoporosis in men: an Endocrine Society clinical practice guideline. J Clin Endocrinol Metab 97(6):1802–22. doi:10.1210/ jc.2011-3045PMID:22675062
30. Zhang H, Chai X, Li S, Zhang Z, Yuan L, Xie H, et al. (2013) Age-related changes in body composition and their relationship with bone mineral density decreasing rates in central south Chinese postmeno-pausal women. Endocrine 43:643–650. doi:10.1007/s12020-012-9833-6PMID:23161202
31. Lekamwasam S, Weerarathna T, Rodrigo M, Arachchi WK, Munidasa D (2009) Association between bone mineral density, lean mass, and fat mass among healthy middle-aged premenopausal women: a cross-sectional study in southern Sri Lanka. J Bone Miner Metab 27:83–88. doi: 10.1007/s00774-008-0006-xPMID:19082777
32. Liu S, Li J, Sheng Z, Wu X, Liao E (2011) Relationship between body composition and age, menopause and its effects on bone mineral density at segmental regions in Central Southern Chinese postmeno-pausal elderly women with and without osteoporosis. Arch Gerontol Geriatr 53:e192–e197. doi:10. 1016/j.archger.2010.09.002PMID:20880598
33. Leslie WD, Weiler HA, Nyomba BL (2007) Ethnic differences in adiposity and body composition: the First Nations Bone Health Study. Appl Physiol Nutr Metab 32:1065–1072. PMID:18059579
34. Mödder UI, Hoey KA, Amin S, McCready LK, Achenbach SJ, Riggs BL, et al. (2011) Relation of age, gender, and bone mass to circulating sclerostin levels in women and men. J Bone Miner Res 26:373–
379. doi:10.1002/jbmr.217PMID:20721932
35. Muller M, den Tonkelaar I, Thijssen JH, Grobbee DE, van der Schouw YT (2003) Endogenous sex hor-mones in men aged 40–80 years. Eur J Endocrinol 149:583–589. PMID:14641001
36. van den Beld AW, de Jong FH, Grobbee DE, Pols HA, Lamberts SW (2000) Measures of bioavailable serum testosterone and estradiol and their relationships with muscle strength, bone density, and body composition in elderly men. J Clin Endocrinol Metab 85:3276–3282. PMID:10999822
37. Elia M, Fuller NJ, Hardingham CR, Graves M, Screaton N, Dixon AK, et al. (2000) Modeling leg sections by bioelectrical impedance analysis, dual-energy X-ray absorptiometry, and anthropometry: assessing segmental muscle volume using magnetic resonance imaging as a reference. Ann N Y Acad Sci 904:298–305. PMID:10865760
39. Glickman SG, Marn CS, Supiano MA, Dengel DR (2004) Validity and reliability of dual-energy X-ray absorptiometry for the assessment of abdominal adiposity. J Appl Physiol 97:509–514. PMID:
15075304
40. Levine JA, Abboud L, Barry M, Reed JE, Sheedy PF, Jensen MD (2000) Measuring leg muscle and fat mass in humans: comparison of CT and dual-energy X-ray absorptiometry. J Appl Physiol 88:452–
456. PMID:10658010
41. Lukaski HC (1987) Methods for the assessment of human body composition: traditional and new. Am J Clin Nutr 46:537–556. PMID:3310598
42. Mattsson S, Thomas BJ (2006) Development of methods for body composition studies. Phys Med Biol 51:R203–R228. PMID:16790904
43. Abate N, Burns D, Peshock RM, Garg A, Grundy SM (1994) Estimation of adipose tissue mass by mag-netic resonance imaging: validation against dissection in human cadavers. J Lipid Res 35:1490–1496. PMID:7989873
44. Rössner S, Bo WJ, Hiltbrandt E, Hinson W, Karstaedt N, Santago P, et al. (1990) Adipose tissue deter-minations in cadavers—a comparison between cross-sectional planimetry and computed tomography. Int J Obes 14:893–902. PMID:2269582
45. Kim J, Shen W, Gallagher D, Jones A Jr, Wang Z, Wang J, et al. (2006) Total-body skeletal muscle mass: estimation by dual-energy X-ray absorptiometry in children and adolescents. Am J Clin Nutr 84:1014–1020. PMID:17093152
46. Lane JT, Mack-Shipman LR, Anderson JC, Moore TE, Erickson JM, Ford TC, et al. (2005) Comparison of CT and dual-energy DEXA using a modified trunk compartment in the measurement of abdominal fat. Endocrine 27:295–299. PMID:16230787
47. Visser M, Fuerst T, Lang T, Salamone L, Harris TB (1999) Validity of fan-beam dual-energy X-ray absorptiometry for measuring fat-free mass and leg muscle mass. Health, Aging, and Body Composi-tion Study—Dual-Energy X-ray Absorptiometry and Body Composition Working Group. J Appl Physiol 87:1513–1520. PMID:10517786
48. Biasioli S, Foroni R, Petrosino L, Cavallini L, Zambello A, Cavalcanti G, et al. (1993) Effect of aging on the body composition of dialyzed subjects. Comparison with normal subjects. ASAIO Jul-Sep 39(3): M596–601. PMID:8268607
49. Rissanen A, Heliö vaara M, Aromaa A (1988). Overweight and anthropometric changes in adulthood: a prospective study of 17000 Finns. Int J Obes 12:391–401. PMID:3235260
50. Bishop C, Phyllis E, Ritchey S (1981). Norms for nutritionnal assessment of American adults by upper arm anthropometry. Am J Clin Nutr 34: 2530. PMID:6975563
51. Mott JW, Wang J, Thornton JC, Allison DB, Heymsfield SB, Pierson RN Jr (1999) Relation between body fat and age in 4 ethnic groups. Am J Clin Nutr 69(5): 1007–1013. PMID:10232643
52. Chumlea WC, Guo SS, Zeller CM, Reo NV, Siervogel RM (1999) Total body water data for white adults 18 to 64 years of age: the Fels Longitudinal Study. Kidney Int; 56(1):244–252. PMID:10411699
53. Mazariegos M, Wang ZM, Gallagher D, Baumgartner RN, Allison DB, Wang J, et al. (1994) Differences between young and old females in the five levels of body composition and their relevance to the two-compartment chemical model. J Gerontol 49(5): M201–208. PMID:8056938
54. Salamat MR, Salamat AH, Abedi I, Janghorbani M (2013) Relationship between Weight, Body Mass Index, and Bone Mineral Density in Men Referred for Dual-Energy X-Ray Absorptiometry Scan in Isfa-han, Iran. J Osteoporosis 2013: 205963. doi:10.1155/2013/205963PMID:24222888
55. Paniagua MA, Malphurs JE, Samos LF (2006) BMI and low bone mass in an elderly male nursing home population. Clin Interv Aging 1(3): 283–287. PMID:18046882
56. Nguyen TV, Center JR, Eisman JA (2000) Osteoporosis in elderly men and women: effects of dietary calcium, physical activity, and body mass index. J Bone Miner Res 15(2): 322–331. PMID:10703935
57. El Hage R, Jacob C, Moussa E, Benhamou CL, Jaffre C (2009) Total body, lumbar spine and hip bone mineral density in overweight adolescent girls: decreased or increased? J Bone Miner Metab 27(5): 629–633. doi:10.1007/s00774-009-0074-6PMID:19373519
58. Napoli N, Faccio R, Shrestha V, Bucchieri S, Rini GB, Armamento-Villareal R (2007) Estrogen metabo-lism modulates bone density in men. Calcif Tissue Int 80(4): 227–232. PMID:17406768
59. Ichikawa S, Koller DL, Peacock M, Johnson ML, Lai D, Hui SL, et al. (2005) Polymorphisms in the estro-gen receptor beta (ESR2) estro-gene are associated with bone mineral density in Caucasian men and women. J Clin Endocrinol Metab 90(11): 5921–5927. PMID:16118344
61. Reid IR, Plank LD, Evans MC (1992) Fat mass is an important determinant of whole body bone density in premenopausal women but not in men. J Clin Endocrinol Metab 75: 779–782. PMID:1517366
62. Douchi T, Kuwahata R, Matsuo T, Uto H, Oki T, Nagata Y (2003) Relative contribution of lean and fat mass component to bone mineral density in males. J Bone Miner Metab 21: 17–21. PMID:12491089
63. Visser M, Kiel DP, Langlois J, Hannan MT, Felson DT, Wilson PW, et al. (1998) Muscle mass and fat mass in relation to bone mineral density in very old men and women: the Framingham Heart Study. Appl Radiat Isot 49: 745–747. PMID:9569599
64. Pluijm SM, Visser M, Smit JH, Popp-Snijders C, Roos JC, Lips P (2001) Determinants of bone mineral density in older men and women: Body composition as mediator. J Bone Miner Res 16:2142–2151. PMID:11697812
65. Coin A, Sergi G, Beninca P, Lupoli L, Cinti G, Ferrara L, et al. (2000) Bone mineral density and body composition in underweight and normal elderly subjects. Osteoporos Int 11:1043–1050. PMID:
11256896
66. Lian-Hua Cui, Min-Ho Shin, Sun-Seog Kweon (2007) Relative contribution of body composition to bone mineral density at different sites in men and women of South Korea. J Bone Miner Metab 25: 165–171. PMID:17447114
67. Karabulut O, Tuncer MC, Karabulut Z, Aclkgoz A, Hatipoglu ES, Akkus Z (2010) Relationship between radiographic features and bone mineral density in elderly men. Folia Morphol (Warsz) 69(3): 170–176. PMID:21154288
68. Jones G1, Nguyen T, Sambrook PN, Kelly PJ, Eisman JA (1995) A longitudinal study of the effect of spinal degenerative disease on bone density in the elderly. J Rheumatol. 22(5): 932–936. PMID: