Exercise and non-exercise aerobic power prediction
models using six-minute walk test
Vagner RasoI, Sandra Marcela Mahecha MatsudoII,III, Marcos Gonçalves de SantanaIV,V, Rita Aurélia BoscoloIV, Valter
Antônio Rocha VianaIV, Viviane GrassmannIV, Sergio TuikIV,VI, Marco Túlio de MelloIV,VI
DOI: 10.5935/MedicalExpress.2016.05.02
I Universidade de São Paulo, Faculdade de Medicina, Instituto de Ortopedia e Traumatologia Laboratório de Estudos do Movimento (LEM-IOT-HCFMUSP), São Paulo, Brazil
II Centro de Estudos do Laboratório de Aptidão Física de São Caetano do Sul (CELAFISCS), São Caetano do Sul, Brazil III Universidad Mayor, Facultad de Ciencias, Escuela de Post Grado, Santiago, Chile
IV Universidade Federal de São Paulo, Centro de Estudos em Psicobiologia e Exercício (CEPE-UNIFESP), São Paulo, Brazil. V Universidade Federal de Goiás (UFG), Programa de Ciências Aplicadas a Saúde, Goiânia, Brazil
VI Universidade Federal de São Paulo (UNIFESP), Departamento de Psicobiologia, São Paulo, Brazil
BACKGROUND AND OBJECTIVE: A simple, low-cost approach commonly used to objectively analyze the cardiorespiratory itness of individuals with diferent health conditions is the six-minute walk test (6-MWT). Our objective was to develop peak aerobic power prediction using the six-minute walk test in healthy older men.
METHODS: We measured body composition (body mass [BM], body mass index [BMI], fat percentage [FAT]) and peak aerobic power breath-by-breath during cardiopulmonary exercise testing (CPET [velocity, heart rate [HR] and VO2 at the anaerobic threshold and peak]) and a 6-MWT (distance [D], weight by distance [WxD], HR and oxygen consumption [VO2] at peak) in 76 healthy older men aged 65 to 80 years (69.1 ± 0.3 yrs-old).
RESULTS: We observed signiicant correlations for VO2peak during the 6-MWT as a function of WxD (R = 0.75, P < 0.0005), BM (R = 0.56, P < 0.0005), D (R = 0.43, P = 0.0004) and maximum HR (R = 0.37, P = 0.001). Distance correlated signiicantly with FAT (R = -0.43, P = 0.005), BMI (R = -0.36, P = 0.021) and age (R = -0.31, P < 0.045), whereas WxD correlated with BM (R = 0.86, P<0.005).The inclusion of WxD increased the R2 from 0.65 to 0.74 and decreased the estimative error while yielding the following equation (R = 0.86, standard error of the estimate (SEE) = 182.1 mL•min-1, P < 0.0005) to predict VO2peak: VO2peak = 962.2 + (0.037 x WxD) + (8.565 x maximum HR). A non-exercise model was obtained by univariate regressions but not multiple regressions. The FAT (R = 0.43, SEE = 702.2 m, P < 0.005) yielded the best model for predicting distance, i.e., distance = 702.2 - (3.067 x FAT).
CONCLUSION: Our prediction model seems to accurately estimate VO2peak in healthy older men primarily when WxD is considered.
KEYWORDS: Aging, Cardiorespiratory Fitness, Male, Maximal Oxygen Uptake.
Raso V, Matsudo SMM, Santana MG, Boscolo RA, Viana VAR, Grassmann V, Tuik S, Mello MT. Exercise and non-exercise aerobic power prediction models using six-minute walk test. MedicalExpress (São Paulo, online). 2016;3(5):M160502
Received for Publication on June 6, 2016; First review on July 13, 2016; Accepted for publication on September 8, 2016; Online on September 30, 2016
E-mail: [email protected]
■
INTRODUCTIONThe assessment of aerobic power during the aging process has been widely studied for decades not only because of the decline of this important health variable with increasing chronological age but also because regardless of the physical activity level, sedentary subjects, active subjects and athletes exhibit decreased
aerobic power as they age. Cardiorespiratory fitness
has been extensively analyzed because it represents
an important predictor of functional independence in elderly individuals1,2 and of all causes of mortality and
cardiovascular events.3
A simple, low-cost approach commonly used
to objectively analyze the cardiorespiratory fitness of
individuals with different health conditions is the six-minute walk test (6-MWT).4 This procedure has been
used as a standard reference criterion because the
procedure captures a significant portion of the variability
examination. The evaluation and examination included (i) a detailed assessment of current and past health status, (ii) a 12-lead electrocardiogram, (iii) a check for depression symptoms, (iv) an ascertainment of the ability to self-report and perform basic and instrumental activities of daily living, (v) an evaluation of body composition and (vi) laboratory parameters. The volunteers who were under treatment for acute or chronic cardiovascular, pulmonary
or metabolic disease or using medication that influences the
cardiovascular and pulmonary system were excluded. The following were additional reasons to exclude a volunteer were: (i) central or peripheral nervous system disorders, (ii) malnourishment or obesity, (iii) smoking, (iv) current or past cancer treatment, (v) surgery of any type during the previous three months, (vi) prescribed bed rest during the previous three months or (vii) any orthopedic disturbances would limit performance during a CPET.
Seventy-six elderly volunteers aged 65 to 80 years were included. The volunteers were cleared for participation and expressed their willingness to submit to the conditions of the experiment. They were informed regarding the procedures and risks before reading and providing written consent. This study was approved by the research ethics committee of our university (#1592/07).
Body composition
We measured height using an electronic scale (Bod Pod®, Life Measurement Inc., USA). The body mass index
(BMI) was calculated by dividing the total body mass by the squared height (kg/m2). The body fat percentage (FAT%)
and the fat-free mass were obtained by plethysmography (Bod Pod®, Life Measurement Inc., USA). The measurement
procedures followed the criteria described by equipment manuals and literature.28
Cardiopulmonary exercise testing
The peak oxygen consumption (VO2peak) and the anaerobic threshold (AT) were determined using a CPET performed on a treadmill (Life Fitness®, 9700 HR, USA).
The treadmill speed was initially set at 1.6 km.h-1; this
was followed by increases of 0.8 km.h-1increments in
speed and 1% increments in slope every two minutes until voluntary exhaustion.5 The expired gas samples
were analyzed breath-by-breath at 20-second intervals, using a metabolic portable system (K4b2, Cosmed®, Italy).
Before each test, the equipment was calibrated according to the manufacturer’s recommendations. The heart rate was recorded simultaneously using a portable system (Polar®, Electro OU, Finland). VO
2peak was achieved when the
following criteria were satisfied: (i) respiratory exchange ratio (RER) > 1.10, (ii) the age-predicted maximum heart rate (MHR) was reached, (iii) volitional fatigue and (iv) signs of exhaustion toward the test’s end (unsteady gait,
hyperpnea, sweating, facial flushing and grimacing).29
the 6-MWT can be used for individuals who are unable to satisfactorily complete a cardiopulmonary CPET in a standard stress test.6,7 In addition, the 6-MWT reflects the
physiological demands required for daily activities.4,8-10
Moreover, in recent years, several studies have analyzed the possible clinical uses of the 6-MWT to measure the
functional status and the cardiorespiratory fitness of
healthy elderly individuals and of elderly individuals with cardiovascular and pulmonary disease and as a form of aerobic exercise for the elderly.11-14 The 6-MWT test has
been used to detect changes in the cardiorespiratory fitness
of healthy elderly individuals after training15 and to predict
cardiovascular events in patients with stable coronary heart disease.16
Thus, there has been an effort to establish standard reference norms that apply to a wide range of individuals.17
Most studies have sought to develop equations that predict the peak O2 consumption (VO2peak) or the distance walked during the 6-MWT as a function of variables that are intrinsic to the protocol per se, or are associated with clinical and sociodemographic characteristics.18,19 These equations
seem to explain approximately one- to two-thirds of the variability.19,20 Clearly, the selection of the variable to be
included in the model is an important factor,21,22 because
men seem to experience twice the VO2max decline over a ten-year period as compared to women (14% versus 7%)23, and
exhibit a higher mortality risk.24 However, when adjusted
to factors known to be involved, such as body mass, the walking distance per se may represent a more accurate measure of the cardiorespiratory capacity than the walking distance in elderly men25 and in patients with chronic
diseases.26 More recently, a generalized equation has been
proposed to predict peak VO2 from the 6-MWT using data collected from over 1,000 patients with cardiopulmonary disorders.27 No similar proposals for healthy elderly
individuals are available. Therefore, the purpose of this study is to develop VO2peak and distance prediction models using body mass (BM), the body mass index (BMI), body fat (FAT), distance (D), the body weight-walking distance product (WxD) and the maximum heart rate (MHR) in healthy elderly men.
■
METHODS VolunteersThe anaerobic threshold (AT) was evaluated through the V-slope method, using a computerized regression analysis of the slopes of the CO2 uptake (VCO2) versus the O2 uptake (VO2) plot, which detects the beginning of the excess CO2 output generated by the buffering of [H+]. The respiratory compensation point (RCP) was detected by examining the minute ventilation per VCO2 plot.30
Six-minute walk test
The volunteers were instructed to walk at regular speed as far as possible carrying a portable metabolic system (K4b2, Cosmed, Italy) for six minutes. Three tests
were performed to control for the learning effect and the data reliability.5 The first two tests were performed
on the same day separated by a one-hour interval. The third test was performed after 24 hours. The 6-MWT was performed in a 20 m corridor that was clear of obstacles. The corridor length was marked every meter, and the volunteers were informed every 60 seconds regarding the remaining test time.4,31 The participants
were instructed to walk at a self-selected regular pace to cover as much distance as they could during the allotted time. If necessary, slowing and stopping to rest were allowed. At the end of each minute, the participants were provided feedback on the elapsed time and standardized encouragement in the form of statements such as “you are doing well, keep it up” and “do your best”. The VO2peak was established as described in the previous section. The total walked distance was recorded in meters, and the longest distance of the two tests was used. The body weight-walking distance product was calculated by multiplying the body weight by the distance (W x D, kg·m).25
Statistical analysis
The Kolmogorov-Smirnov test was used to analyze the data normality. A one-way analysis of variance with Bonferroni post-hoc compared subjects grouped into quartiles according to the 6-MWT VO2peak (i.e., P0-P25, P25-P75
and P75-P100). The Pearson product-moment correlation
coefficient was used to determine the association of
VO2peak with BM, BMI, body fat, D, WxD andMHR. Univariate regression analysis was used to investigate the associations of age with all of the other variables and the body weight-walking distance product as a function of VO2 at the anaerobic threshold and peak. In addition, hierarchical multiple regression analyses were performed to develop exercise (VO2peak) and non-exercise (D and WxD) prediction equation models as a function of BM, BMI, FAT, D, WxD and MHR. All of the analyses were performed using the
Predictive Analytics Software17.0 version for Windows
package (SPSS, Inc., USA). The data are presented as the
mean ± standard error. Significance was set at p < 0.05.
■
RESULTSGeneral characteristics
Homogeneity of the population was observed throughout the variables of age and body composition (Table 1). However, VO2 at the anaerobic threshold and
peak (CPET and 6-MWT) were significantly higher in
individuals at highest quartile (P75-P100). Similar results were observed for distance and the MHR during the 6-MWT (Table 2).
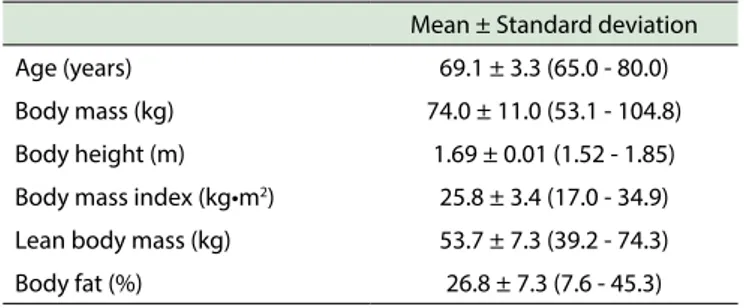
Table 1 - Age and body composition of the elder healthy men
Mean ± Standard deviation
Age (years) 69.1 ± 3.3 (65.0 - 80.0)
Body mass (kg) 74.0 ± 11.0 (53.1 - 104.8)
Body height (m) 1.69 ± 0.01 (1.52 - 1.85)
Body mass index (kg•m2) 25.8 ± 3.4 (17.0 - 34.9)
Lean body mass (kg) 53.7 ± 7.3 (39.2 - 74.3)
Body fat (%) 26.8 ± 7.3 (7.6 - 45.3)
Age efects
We observed an age effect on the anaerobic threshold
(velocity: β = -0.39, P = 0.010], heart rate ([β = -0.88, P = 0.0005]), MHR during the CPET ([β = -0.38, P = 0.012]) and D during the 6-MWT ([β = -0.31, P = 0.045]) (data not
shown).
Body weight-walking distance product
We analyzed the product of body weight and distance
(WxD) as a parameter that could reflect the work rate during the 6-MWT. A significant association was observed between WxD vs. the anaerobic threshold (r = 0.63, β =
0.018 ± 0.004 and P < 0.0005) and VO2peak (r = 0.73, β = 0.031 ± 0.005, P < 0.0005) regardless of age (data not shown).
Univariate correlations
Peak oxygen uptake during the CPET correlated
significantly with the corresponding peak oxygen uptake
during the 6-MWT, as shown in Figure 1.
Figure 2 exhibits the correlation of various parameters of the 6MWT with the respective VO2peak: the best observed correlation is between distance x weight and peak oxygen consumption. However, distance, maximum
heart rate and body mass also correlated significantly.
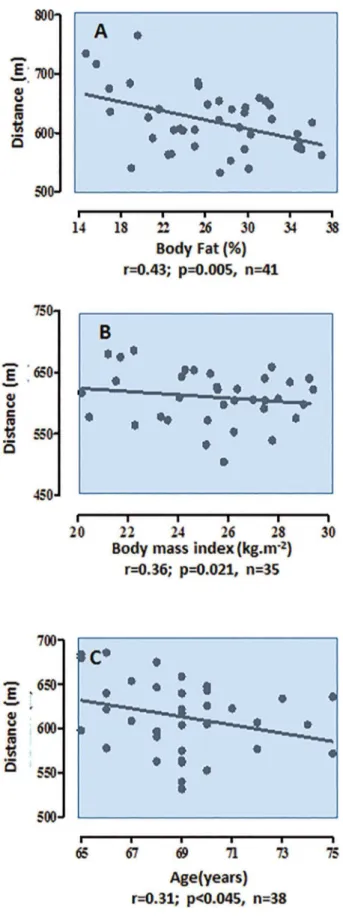
Figure 3 illustrates the expected inverse correlations between body fat, body mass and age with travelled distance.
Multiple regression analysis
We developed exercise and non-exercise models.
Table 2 - Cardiopulmonary exercise parameters according to percentile for VO2peak at 6MWT and entire group*.
VO2peak (L•min-1) at 6MWT
P0-P25(a) P25-P75(b) P75-P100(c) Entire group
CPET at anaerobic threshold
Velocity (km•h-1) 4.1 ± 0.2 (3.2 - 4.8) 4.1 ± 0.2 (2.4 - 5.6) 4.4 ± 0.2 (3.2 - 4.8) 4.2 ± 0.1 (2.4 - 5.6)
Heart rate (bpm) 98.0 ± 3.4 (79.0 - 110.0) 102.1 ± 2.5 (84.0 - 120.0) 98.2 ± 4.9 (75.0 - 118.0) 100.3 ± 1.9 (75.0 - 120.0)
Vo O2 (L•min-1) 1.1 ± 0.1 (0.9 - 1.3)c 1.1 ± 0.1 (0.83 - 1.3)c 1.4 ± 0.1 (0.9 - 1.7) 1.2 ± 0.1 (0.8 - 1.7)
CPET at peak ———————————————————————————————————
Velocity (km•h-1) 6.9 ± 0.2 (5.6 - 8.0) 7.2 ± 0.1 (5.6 - 8.0) 7.2 ± 0.0 (7.2 - 7.2) 7.1 ± 0.1 (5.6 - 8.0)
Heart rate (bpm) 148.1 ± 5.6 (112.0 - 171.0) 152.1 ± 3.2 (125.0 - 176.0) 153.9 ± 5.7 (129.0 - 177.0) 151.5 ± 2.5 (112.0 - 177.0)
Vo O2 (L•min-1) 1.9 ± 0.1 (1.5 - 2.3)c 2.0 ± 0.1 (1.5 - 2.6)c 2.5 ± 0.1 (2.1 - 2.7) 2.1 ± 0.1 (1.5 - 2.7)
6MWT at peak ———————————————————————————————————
Distance (m) 589.0 ± 14.8 (532.0 - 675.0)c 620.6 ± 9.2 (539.0 - 716.5) 653.8 ± 20.7 (562.0 - 765.0) 620.2 ± 8.1 (532.0 - 765.0)
Body weight by distance (kg•m)
40.2 ± 1.5 (33.4 - 49.4) 44.6 ± 1.1 (35.9 - 53.1) 54.2 ± 2.1 (46.3 - 66.2) 45.6 ± 1.3 (33.4 - 66.3)
Heart rate (bpm) 123.6 ± 4.4 (96.0 - 164.0)c 133.4 ± 2.6 (105.0 - 166.0) 141.6 ± 3.1 (109.0 - 170.0) 133.0 ± 2.0 (96.0 - 170.0)
V
o
O2 (L•min-1) 1.5 ± 0.1 (1.3 - 1.6)bc 1.8 ± 0.1 (1.6 - 2.1)c 2.3 ± 0.1 (2.1 - 2.8) 1.9 ± 0.1 (1.3 – 2.8)*The dark shading indicates signiicant diferences. CPET: cardiopulmonary exercise testing; AT: anaerobic threshold; 6MWT: six-minute walk test; VoO2: oxygen uptake
Figure 1 - The high level of correlation between VO2peak during the six-minute walk test and cardiopulmonary exercise test shows that the 6MWT is a reliable predictor of aerobic power.
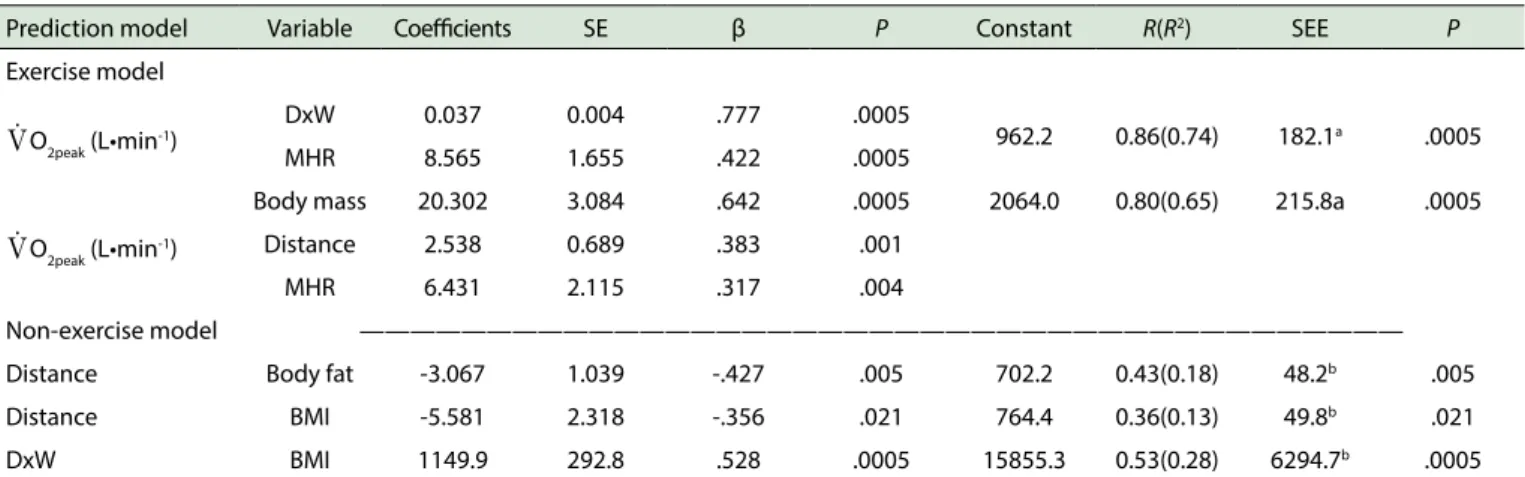
estimate VO2peak predominantly as a function of the 6-MWT variables. Subsequently, we tested the hypothesis of a non-exercise prediction equation to estimate either distance (D) or the WxD product (Table 3). All of the variables of the respective models independently explained VO2peak, D or WxD. When estimating VO2peak, the inclusion of WxD increased the R2 from 0.65 to 0.74, which represents a
significant 9% increase in the explained variance of VO2peak. Moreover, there was an important decrease in estimative error, which yielded the following equation (R = 0.86, SEE = 182.1 mL·min-1 and P < 0.0005) for predicting VO
2peak:
VO2peak = 962.2 + (0.037 x WxD) + (8.565 x MHR),
where WxD is the body weight-walking distance product in kg·m and MHR is the maximum heart rate in bpm. A non-exercise model was obtained by univariate regressions but not by multiple regressions. Body fat percentage (R = 0.43, SEE = 702.2m, P < 0.005) yielded the best model for
predicting distance, i.e., D= 702.2 - (3.067 x FAT), where
FAT represents the percentage of body fat.
■
DISCUSSIONAn obstacle to measuring the aerobic power of elderly individuals (either in groups or clinical care) has been the lack of a practical, safe, low-cost and
scientifically valid method to assess functional status, cardiovascular fitness and the impact of comorbidities on
Figure 2 - The four parameters relating to the six-minute walk test correlate signiicantly with peak O2 consumption; the best correlation occurred for the distance x weight product.
that the VO2peak achieved during the 6-MWT is significantly associated with the VO2peak recorded in a maximal CPET performance, which facilitated the development of a VO2peak prediction model with satisfactory accuracy. It was also possible to develop other models to estimate distance (based on a non-exercise pattern) but with low accuracy.
The absolute aerobic power (i.e., L·min-1) was
considered as the main outcome variable in our models. We tried to avoid potential multicollinearity between the BM and the WxD product in the models which considered the relative aerobic power (i.e., mL·kg-1·min-1). Therefore, the effect of
the body mass in our models is not being overestimated by redundancy. Our analyses demonstrate that each of the predictor variables used in this study was independently related to the distance walked in the 6-MWT and the VO2peak. However, the best models were extracted when VO2peak was the main outcome variable.
There are numerous indirect methods to estimate VO2peak in elderly subjects that result in good accuracy with correlations reaching up to 0.97.21,22,32,33 These results are
similar to the findings of our study for both of the generated
exercise models, particularly compared with studies on the 6-MWT.33 However, some differences in the magnitude of
correlations may be partly explained by the type and the number of predictor variables included in the models.21,22
Moreover, there seems to be a direct relationship between the severity of the clinical condition and the strength of the correlation in the analysis between the walked distance and the VO2peak.4,34,35 A linear mixed-model analysis was used
to determine the SEE of the 6-MWT to estimate the peak oxygen uptake; the formula can be useful to compare the peak aerobic capacity without the CPET and can be applied to monitor the course of several cardiovascular and pulmonary
Figure 3 - The percentage of body fat, body mass index and age correlate inversely with travelled distance.
Although the VO2peak prediction model developed in the present study has satisfactory accuracy, the extrapolation of the results could be limited because the elderly represent a select group of individuals. Therefore, future studies are required to determine the stability of the proposed model’s VO2peak prediction for individuals whose characteristics are substantially different from our sample
amplitude (e.g., physical activity level and fitness, health
condition and disease severity).
The present study is the first to demonstrate that
WxD is a more important VO2peak predictor in elderly individuals than weight and distance separately. In addition to characterizing the work rate performed during the 6-MWT25,26, this strategy improved the regression model’s
ability to predict VO2peak. The WxD parameter more accurately
reflects the workload of walking than D and therefore should
be used as an evaluation criterion of cardiorespiratory
fitness in the absence of gas exchange analysis.25 However,
there may be other sociodemographic (e.g., gender) or physiological (e.g., resting heart rate) variables that would facilitate the development of a non-exercise prediction model to satisfactorily predict WxD. For instance, chronological age seems to represent an important discriminatory parameter of cardiopulmonary capacity, especially among elderly individuals.36 Moreover, a significant proportion of the
variability of the cardiorespiratory capacity estimate may be explained by anthropometric and sociodemographic variables.26
Therefore, we may conclude that our prediction model seems to be an accurate strategy to estimate VO2peak in healthy older men primarily when WxD is considered. The new exercise prediction model derived proposed in this study can be used to estimate VO2peak in older men. However, further studies should develop non-exercise models, particularly models based on the WxD parameter.
■
CONFLICTS OF INTERESTThe authors declare that they have no conflict of
interest with respect to this project.
■
AUTHOR CONTRIBUTIONSStudy concept and design: Raso V. Acquisition of data: Santana MG, Boscolo RA, Viana VAR and Grassmann V. Analysis and interpretation of data: Raso V. Drafting of the manuscript: Raso V. Critical revision of the manuscript for important intellectual content: Raso V. Statistical analysis: Raso V. Administrative, technical, or material support: Matsudo SMM, Santana MG, Boscolo RA, Viana
Table 3 - Exercise and non-exercise prediction models to estimate VO2peak, distance or body weight-walking distance product as a function
of body mass, body mass index, body fat, distance, body weight-walking distance product, and maximum heart rate.
Prediction model Variable Coeicients SE β P Constant R(R2) SEE P
Exercise model
VoO2peak (L•min-1)
DxW 0.037 0.004 .777 .0005
962.2 0.86(0.74) 182.1a .0005
MHR 8.565 1.655 .422 .0005
VoO2peak (L•min-1)
Body mass 20.302 3.084 .642 .0005 2064.0 0.80(0.65) 215.8a .0005
Distance 2.538 0.689 .383 .001
MHR 6.431 2.115 .317 .004
Non-exercise model —————————————————————————————————————————
Distance Body fat -3.067 1.039 -.427 .005 702.2 0.43(0.18) 48.2b .005
Distance BMI -5.581 2.318 -.356 .021 764.4 0.36(0.13) 49.8b .021
DxW BMI 1149.9 292.8 .528 .0005 15855.3 0.53(0.28) 6294.7b .0005
SE: standard error; SEE: standard error of the estimate (a: mL•min-1; b: meters); MHR: maximum heart rate; BMI: body mass index; DxW: body weight-walking distance product.
EQUAÇÕES DE PREDIÇÃO DA POTÊNCIA AERÓ-BICA USANDO O TESTE DE CAMINHADA DE SEIS MINUTOS
OBJETIVO: O teste de caminhada de seis minutos (TC6M) é uma estrategia simples e de baixo custo operacional que objetivamente mede a aptidão cardiorrespiratória de indivíduos com diferentes condições de saúde. Nosso objetivo foi desenvolver equações de predição da potência aeróbica em homens idosos saudáveis usando o TC6M.
MÉTODOS: Foram medidos a composição corporal (massa corporal [MC], índice de massa corporal [BMI], porcentagem de gordura [%G]) e potência aeróbica de pico através de teste cardiopulmonar de exercício máximo (velocidade, frequência cardíaca [FC] e consumo de oxigênio [VO2] no limiar anaeróbico e no pico]) e através do TC6M (distancia [D], produto massa corporal x distância, FC e VO2de pico) em 76 idosos saudáveis com idade entre 65 e 80 anos (69.1 ± 0.3 anos).
RESULTADOS: Foram observadas correlações
significativas paraVO2pico no TC6M em função do produto MCxD (R = 0,75, P < 0,0005), MC (R = 0,56, P < 0,0005), D (R = 0,43, P =
0,0004) e FC máxima (R = 0,37, P = 0,001). A correlacionou-se
significativamente com %G (R = -0,43, P = 0,005), IMC (R = -0,36, P = 0,021) e idade (R = -0,31, P < 0,045), enquanto que a MCxD
correlacionou-se com MC (R = 0,86, P < 0,005). A inclusão da
MCxD aumentou o R2 de 0,65 para 0,74 e diminuiu o erro padrão
da estimativa (EPE) gerando a equação (R = 0,86, EPE = 182,1
mL·min-1, P < 0,0005) para a predição do VO
2peak: VO2peak = 962,2
+ (0,037 x MCxD) + (8,565 x FC máxima). Foi também gerado um modelo preditivo não dependente de exercício através de regressão univariada, mas não múltipla. A %G (R=0,43, EPE =
702,2 m, P < 0,005) gerou o melhor modelo para a predição da distancia, i.e., distancia = 702,2 - (3,067 x %G).
CONCLUSÃO: Nossas modelos de predição parecem estimar precisamente o VO2pico de idosos saudáveis, especialmente quando a MCxD é considerada.
PALAVRAS-CHAVE: Aptidão cardiorrespiratória, consumo máximo de oxigênio, envelhecimento,homem.
■
REFERENCES1. Shephard RJ. Maximal oxygen intake and independence in old age. Br J Sports Med. 2009;43:342-6. doi: 10.1136/bjsm.2007.044800. 2. Paterson DH, Govindasamy D, Vidmar M, Cunningham DA, Koval
JJ. Longitudinal study of determinants of dependence in an elderly population. J Am Geriatr Soc. 2004;52:1632-8. DOI: 10.1111/j.1532--5415.2004.52454.x
3. Kodama S, Saito K, Tanaka S, Maki M, Yachi Y, Asumi M, et al. Cardio-respiratory fitness as a quantitative predictor of all-cause mortality and cardiovascular events in healthy men and women: a meta-analysis. JAMA. 2009;301:2024-35. doi: 10.1001/jama.2009.681.
4. American Thoracic Society. Guidelines for the six-minute walk test. Am J Respir Crit Care Med 2002ATS Statement: Guidelines for the six-minute walk test. Am J Respir Crit Care Med 2002;166:111-7. DOI: 10.1164/rccm.166/1/111
5. Kervio G, Carre F, Ville NS. Reliability and intensity of the six--minute walk test in healthy elderly subjects. Med Sci Sports Exerc 2003;35:169-74. DOI: 10.1249/01.MSS.0000043545.02712.A7 6. Rostagno C, Boddi V, Gensini GF. 6MWT predicts survival better than
CPET in patients with stable cardiomyopathy. Br J Med Med Res 2012; 2:386-95.
7. Kierkegaard M, Tollbäck A. Reliability and feasibility of the six minute walk test in subjects with myotonic dystrophy. Neuromuscul Disord 2007;17:943-9. DOI: 10.1016/j.nmd.2007.08.003
8. Braunschweig F, Linde C, Adamson PB, Magalski A, Erdmann E, Kjellstrom B, et al. Continuous central haemodynamic measurements during the six-minute walk test and daily life in patients with chronic heart failure. Eur J Heart Fail 2009;11:594-601. DOI: 10.1093/eurjhf/ hfp045
9. Mudge S, Stott NS. Timed walking tests correlate with daily step activity in persons with stroke. Arch Phys Med Rehabil 2009;90:296-301. doi: 10.1016/j.apmr.2008.07.025.
10. Witham MD, Argo IS, Johnston DW, Struthers AD, McMurdo ME. Predictors of exercise capacity and everyday activity in older heart failure patients. Eur J Heart Fail 2006;8:203-7. DOI: 10.1016/j.ejhe-art.2005.03.008
12. Zainuldin M, Knoke D, Mackey M, Luxton N, Alison J. Prescribing cycle training intensity from the six-minute walk test for patients with COPD. BMC Pulm Med 2007;7:9-17. DOI: 10.1186/1471-2466-7-9
13. Enright PL, McBurnie MA, Bittner V, Tracy RP, McNamara R, Arnold A,et al. The 6-min walk test. A quick measure of functional status in elderly adults. Chest 2003; 123:387-98. DOI: 10.1378/chest.123.2.387
14. Opasich C, Pinna G, Mazza A, Febo O, Riccardi R, Riccardi PG, et al. Six--minute walking performance in patients with moderate-to-severe he-art failure. Eur Hehe-art J 2001;22:488-96. DOI: 10.1053/euhj.2000.2310 15. Santana M, Lira C, Passos G, Santos C, Silva AH, Yoshida CH, et al. Is
the six-minute walk test appropriate for detecting changes in cardio-respiratory fitness in healthy elderly men? J Sci Med Sport 2012;15: 259-65. doi: 10.1016/j.jsams.2011.11.249.
16. Beatty A, Schiller N, Whooley M. Six-minute walk test as a prognostic tool in stable coronary heart disease: data from the heart and soul study. Arch Inter Med. 2012; 172:1096-102. doi: 10.1001/archinter-nmed.2012.2198.
17. Casanova C, Celli BR, Barria P, Casas A, Cote C, de Torres JP, et al. The 6-min walk distance in healthy subjects: reference stan-dards from seven countries. Eur Respir J 2011;37:150-6. doi: 10.1183/09031936.00194909.
18. Jenkins S, Cecins N, Camarri B, Williams C, Thompson P, Eastwood P. Regression equations to predict 6-minute walk distance in middle--aged and elderly adults. Physiother Theory Pract 2009;25:516-22. doi: 10.3109/09593980802664711.
19. Enright PL, Sherrill DL. Reference equations for the six-minute walk in healthy adults. Am J Resp Crit Care Med 1998;158(5Pt1):1384-7.
20. Troosters T, Gosselink R, Decramer M. Six minute walking dis-tance in healthy elderly subjects. Eur Resp J 1999;14:270-4. DOI: 10.1034/j.1399-3003.1999.14b06.x
21. Cao ZB, Miyatake N, Higuchi M, Ishikawa-Takata K, Miyachi M, Tabata I. Prediction of VO2max with daily step counts for Japanese adult women.
Eur J Appl Physiol 2009;105:289-96. doi: 10.1007/s00421-008-0902-8.
22. Cao ZB, Miyatake N, Higuchi M, Miyachi M, Ishikawa-Takata K, Tabata I. Predicting VO2max with an objectively measured physical activity in Japanese women. Med Sci Sports Exerc 2010;42:179-86. doi: 10.1249/ MSS.0b013e3181af238d.
23. Stathokostas L, Jacob-Johnson S, Petrella RJ, Paterson DH. Longitudinal changes in aerobic power in older men and women. J Appl Physiol 2004;97:781-9. DOI: 10.1152/japplphysiol.00447.2003
24. Oksuzyan O, Juel K, Vaupel JW, Christensen K. Men: good health and high mortality. Sex differences in health and aging. Aging Clin Exp Res 2008;20:91-102.
25. Chuang M-L, Lin I-F, Wasserman K. The body weight–walking distance product as related to lung function, anaerobic threshold and peak VO2
in COPD patients. Resp Med 2001;95:618-26.
26. Iwama AM, Andrade GN, Shima P, Tanni SE, Godoy I, Dourado VZ. The six-minute walk test and body weight-walk distance product in healthy Brazilian subjects. Braz J Med Biol Res 2009;42:1080-5. DOI: 10.1590/ S0100-879X2009005000032
27. Ross R, Murthy J, Wollak I, Jackson A. The six minute walk test accurate-ly estimates mean peak oxygen uptake. BMC Pulm Med 2010;10:31-39. doi: 10.1186/1471-2466-10-31.
28. Fields DA, Hunter GR. Monitoring body fat in the elderly: application of air-displacement plethysmography. Curr Opin Clin Nutr Metab Care 2004;7:11-4. DOI: 10.1097/01.mco.0000109597.04238.f7
29. American College of Sports Medicine. General principles of exercise prescription. In: Thompson WR, Gordon NF, Pescatello LS, editors. ACSM’s Guidelines for Exercise Testing and Prescription.Philadelphia: Williams & Wilkins; 2010.p.152-175
30. Beaver WL, Wasserman K, Whipp BJ. A new method for detecting anaerobic threshold by gas exchange. J Appl Physiol 1986;60:2020-7. 31. Enright PL. The six-minute walk test. Respir Care 2003;48:783-5. 32. Akalan C, Robergs RA, Kravitz L. Prediction of VO2max from an
indivi-dualized submaximal cycle ergometer protocol. J Exerc Physiol Online 2008;11:1-17.
33. Huggett DL, Connelly DM, Overend TJ. Maximal aerobic capacity testing of older adults: A critical review. J Gerontol A BiolSci Med Sci 2005;60:57-66.
34. Solway S, Brooks D, Lacasse Y, Thomas S. A qualitative systematic overview of the measurement properties of functional walk tests used in the cardiorespiratory domain. Chest 2001;119:256-70. DOI: 10.1378/chest.119.1.256
35. Guyatt GH, Thompson PJ, Berman LB, Sullivan MJ, Townsend M, Jones NL, et al. How should we measure function in patients with chronic heart and lung disease? J Chronic Dis 1985;38:517-24. DOI: 10.1016/0021-9681(85)90035-9