ACPD
11, 26173–26243, 2011Satellite-derived Arctic tropospheric
BrO columns
S. Choi et al.
Title Page
Abstract Introduction
Conclusions References
Tables Figures
◭ ◮
◭ ◮
Back Close
Full Screen / Esc
Printer-friendly Version Interactive Discussion
Discussion
P
a
per
|
Dis
cussion
P
a
per
|
Discussion
P
a
per
|
Discussio
n
P
a
per
|
Atmos. Chem. Phys. Discuss., 11, 26173–26243, 2011 www.atmos-chem-phys-discuss.net/11/26173/2011/ doi:10.5194/acpd-11-26173-2011
© Author(s) 2011. CC Attribution 3.0 License.
Atmospheric Chemistry and Physics Discussions
This discussion paper is/has been under review for the journal Atmospheric Chemistry and Physics (ACP). Please refer to the corresponding final paper in ACP if available.
Analysis of satellite-derived Arctic
tropospheric BrO columns in conjunction
with aircraft measurements during
ARCTAS and ARCPAC
S. Choi1, Y. Wang1, R. J. Salawitch2, T. Canty2, J. Joiner3, T. Zeng1,
T. P. Kurosu4,*, K. Chance4, A. Richter5, L. G. Huey1, J. Liao1, J. A. Neuman6,7, J. B. Nowak6,7, J. E. Dibb8, A. J. Weinheimer9, G. Diskin10, T. B. Ryerson7, A. da Silva3, J. Curry1, D. Kinnison9, S. Tilmes9, and P. F. Levelt11,12
1
Georgia Institue of Technology, Atlanta, GA, USA
2
University of Maryland College Park, College Park, MD, USA
3
NASA Goddard Space Flight Center, Greenbelt, MD, USA
4
Harvard-Smithsonian Center for Astrophysics, Cambridge, MA, USA
5
Institute of Environmental Physics, University of Bremen, Bremen, Germany
6
Cooperative Institute for Research in Environmental Sciences (CIRES), University of Colorado Boulder, Boulder, CO, USA
7
NOAA Earth System Research Laboratory, Boulder, CO, USA
8
ACPD
11, 26173–26243, 2011Satellite-derived Arctic tropospheric
BrO columns
S. Choi et al.
Title Page
Abstract Introduction
Conclusions References
Tables Figures
◭ ◮
◭ ◮
Back Close
Full Screen / Esc
Printer-friendly Version Interactive Discussion
Discussion
P
a
per
|
Dis
cussion
P
a
per
|
Discussion
P
a
per
|
Discussio
n
P
a
per
|
9
National Center for Atmospheric Research, Boulder, CO, USA
10
NASA Langley Research Center, Hampton, VA, USA
11
Royal Netherlands Meteorological Institute (KNMI), De Bilt, The Netherlands
12
University of Technology Eindhoven, Eindhoven, The Netherlands
∗
now at: NASA Jet Propulsion Laboratory, Pasadena, CA, USA
Received: 17 August 2011 – Accepted: 12 September 2011 – Published: 21 September 2011 Correspondence to: S. Choi (sungyeon.choi@eas.gatech.edu)
ACPD
11, 26173–26243, 2011Satellite-derived Arctic tropospheric
BrO columns
S. Choi et al.
Title Page
Abstract Introduction
Conclusions References
Tables Figures
◭ ◮
◭ ◮
Back Close
Full Screen / Esc
Printer-friendly Version Interactive Discussion
Discussion
P
a
per
|
Dis
cussion
P
a
per
|
Discussion
P
a
per
|
Discussio
n
P
a
per
|
Abstract
We derive estimates of tropospheric BrO column amounts during two Arctic field cam-paigns in 2008 using information from the satellite UV nadir sensors Ozone Monitoring Instrument (OMI) and the second Global Ozone Monitoring Experiment (GOME-2) as well as estimates of stratospheric BrO columns from a model simulation. The sen-5
sitivity of the satellite-derived tropospheric BrO columns to various parameters is in-vestigated using a radiative transfer model. We conduct a comprehensive analysis of satellite-derived tropospheric BrO columns including a detailed comparison with air-craft in-situ observations of BrO and related species obtained during the field cam-paigns. In contrast to prior expectation, tropospheric BrO, when present, existed over 10
a broad range of altitudes. Our results show reasonable agreement between tropo-spheric BrO columns derived from the satellite observations and columns found using aircraft in-situ BrO. After accounting for the stratospheric contribution to total BrO col-umn, several events of rapid BrO activation due to surface processes in the Arctic are apparent in both the OMI and GOME-2 based tropospheric columns. The wide orbital 15
swath of OMI allows examination of the evolution of tropospheric BrO on about hourly time intervals near the pole. Low pressure systems, strong surface winds, and high planetary boundary layer heights are associated with the observed tropospheric BrO activation events.
1 Introduction
20
Bromine plays an important role in tropospheric ozone chemistry and the resulting oxidation capacity of the polar boundary layer. Bromine radicals catalytically destroy ozone, leading to nearly complete removal near the surface that is termed an ozone (O3) depletion event (ODE). Once O3 is depleted, high levels of reactive halogen species including atomic bromine (e.g. Br) become the primary oxidants for many 25
ACPD
11, 26173–26243, 2011Satellite-derived Arctic tropospheric
BrO columns
S. Choi et al.
Title Page
Abstract Introduction
Conclusions References
Tables Figures
◭ ◮
◭ ◮
Back Close
Full Screen / Esc
Printer-friendly Version Interactive Discussion
Discussion
P
a
per
|
Dis
cussion
P
a
per
|
Discussion
P
a
per
|
Discussio
n
P
a
per
|
Schroeder et al., 1998). During mercury depletion events (MDEs), Br and BrO are thought to oxidize elemental mercury to more reactive gaseous mercury that deposit to the polar ecosystem (Schroeder et al., 1998; Lu et al., 2001; Ariya et al., 2004; Douglas et al., 2005; Holmes et al., 2010).
A primary source of active bromine in the polar boundary layer is thought to be 5
bromide (Br−) in the condensed phase, which is transformed to gaseous molecu-lar bromine (Br2) by heterogenous chemistry. Potential sources of bromide are sea salt aerosols (Fan and Jacob, 1992), surfaces of first year sea ice (Simpson et al., 2007a; Wagner et al., 2007) or newly formed sea ice (Jones et al., 2006), frost flowers (Kaleschke et al., 2004), or blowing snow triggered by strong winds (Yang et al., 2008, 10
2010; Jones et al., 2009; A. E. Jones et al., 2010; Begoin et al., 2010; Theys et al., 2011; Toyota et al., 2011). Br2 released to the atmosphere is rapidly photolyzed to yield bromine radicals (Br), i.e.
HOBr+Br−
+H+⇋H2O+Br2(condensed phase) (1)
Br2+hν→2Br (gas phase). (2)
15
The bromine radicals then lead to catalytic ozone loss, i.e.
Br+O3→BrO+O2 (3)
BrO+XO→BrX+O2(X=Br, Cl, I, and OH) (4)
BrX+hν→Br+X (5)
Barrie et al. (1988) found that filterable bromine is strongly anti-correlated with the 20
ACPD
11, 26173–26243, 2011Satellite-derived Arctic tropospheric
BrO columns
S. Choi et al.
Title Page
Abstract Introduction
Conclusions References
Tables Figures
◭ ◮
◭ ◮
Back Close
Full Screen / Esc
Printer-friendly Version Interactive Discussion
Discussion
P
a
per
|
Dis
cussion
P
a
per
|
Discussion
P
a
per
|
Discussio
n
P
a
per
|
of elevated BrO and depleted surface O3 during Arctic spring is well established (e.g. Platt and H ¨onninger, 2003, and references therein).
Bromine monoxide (BrO), an intermediate in the catalytic loss of ozone, is the most commonly observed active bromine species. BrO absorbs ultraviolet (UV) radiation, which enables measurement using remote sensing techniques. Reported in-situ and 5
remotely-sensed ground-, balloon-, and aircraft-based BrO measurements include: (1) boundary layer mixing ratio with Long Path-Differential Optical Absorption Spec-troscopy (LP-DOAS) (Hausmann and Platt, 1994; Tuckermann et al., 1997; Martinez et al., 1999); (2) mixing ratio by aircraft in-situ Chemical-Ionization Mass Spectrome-try (CIMS) (Neuman et al., 2010; Liao et al., 2011a,b); (3) boundary layer and free 10
tropospheric BrO column using DOAS on aircraft (McElroy et al., 1999); (4) total, stratospheric, and tropospheric columns using ground-based zenith sky and direct sun DOAS (Frieß et al., 1999; Schofield et al., 2004, 2006; Hendrick et al., 2007, 2008; Theys et al., 2007); (5) boundary-layer column with ground-based MAX-DOAS (H ¨onninger, 2004; Simpson et al., 2007a; Donohoue et al., 2010); (6) balloon profiles 15
using a variety of spectroscopic methods (Fitzenberger et al., 2000; Pfeilsticker et al., 2000; Pundt et al., 2002; Dorf et al., 2008). Despite the many measurements of BrO and related species obtained by various techniques, significant uncertainties remain regarding the importance of very short lived source compounds on the stratospheric bromine budget (e.g. Sect. 1.3.3.3 of WMO, 2011) as well as the magnitude of the 20
global, ubiquitous, background level of tropospheric BrO (e.g. Sect. 5.3 of Theys et al., 2011).
Space-based observation of BrO offers an excellent tool for studying Arctic polar bromine chemistry. Satellite observations provide global coverage, far superior to the spatial coverage available from ground- and aircraft-based measurements. Limb-25
ACPD
11, 26173–26243, 2011Satellite-derived Arctic tropospheric
BrO columns
S. Choi et al.
Title Page
Abstract Introduction
Conclusions References
Tables Figures
◭ ◮
◭ ◮
Back Close
Full Screen / Esc
Printer-friendly Version Interactive Discussion
Discussion
P
a
per
|
Dis
cussion
P
a
per
|
Discussion
P
a
per
|
Discussio
n
P
a
per
|
observations from the SCanning Image Absorption SpectroMeter for Atmospheric CHartographY (SCIAMACHY) (Sinnhuber et al., 2005; Sioris et al., 2006; Rozanov et al., 2011) extend into the lowermost stratosphere (LMS) and nadir measurements from SCIAMACHY constrain total column BrO, including contributions from the strato-sphere and tropostrato-sphere. The retrievals of SCIAMACHY BrO by Rozanov et al. (2011) 5
and Sinnhuber et al. (2005) imply a limited role for supply of bromine by very short lived (VSL) compounds to the LMS and a considerable burden of global, ubiquitous, background BrO whereas the retrieval of SCIAMACHY BrO described by Sioris et al. (2006) implies a larger role for supply of stratospheric Bry by VSL compounds and a much smaller level for background tropospheric BrO (e.g. Sect. 2.5.2.1 of WMO, 2007). 10
Nadir-viewing instruments on polar-orbiting satellites provide multiple daily observa-tions of total column BrO at high latitude. The high surface albedo of polar regions pro-vides good sensitivity to tropospheric BrO, including that near the surface (Wagner and Platt, 1998; Theys et al., 2011). Chance (1998) and Hegels et al. (1998) retrieved BrO total vertical column densities (VCD) from nadir radiances in the UV obtained by Global 15
Ozone Monitoring Experiment (GOME) (GOME Users Manual, 1995) on the European Space Agency (ESA) European Remote Sensing 2 (ERS-2) satellite. The early GOME observations showed large enhancements over Hudson Bay during spring 1997, which was attributed to bromine release from the surface (Chance, 1998). Estimates of BrO total column amount have been subsequently derived from other nadir-viewing satel-20
lite sensors including the Ozone Monitoring Instrument (OMI) (Levelt et al., 2006) on the US National Aeronautics and Space Administration (NASA) Aura satellite, SCIA-MACHY (Bovensmann et al., 1999) on the ESA Environmental Satellite (EnviSat), and the second Global Ozone Monitoring Experiment (GOME-2) instruments (Munro et al., 2006) that are flying on the series of European Meteorological Operational Satel-25
ACPD
11, 26173–26243, 2011Satellite-derived Arctic tropospheric
BrO columns
S. Choi et al.
Title Page
Abstract Introduction
Conclusions References
Tables Figures
◭ ◮
◭ ◮
Back Close
Full Screen / Esc
Printer-friendly Version Interactive Discussion
Discussion
P
a
per
|
Dis
cussion
P
a
per
|
Discussion
P
a
per
|
Discussio
n
P
a
per
|
scientific community since publication of early GOME observations has been quantify-ing the degree to which this “excess BrO” resides in the troposphere, the stratosphere, or perhaps both regions of the atmosphere.
Tropospheric BrO columns can be derived from satellite observations using the resid-ual method, in which an estimate of the stratospheric BrO column is subtracted from 5
the satellite-derived VCD of BrO. Wagner and Platt (1998) and Richter et al. (1998) estimated tropospheric VCD of BrO using this approach from GOME observations, based on simple assumptions for stratospheric BrO. These studies and many others assumed that stratospheric BrO is zonally symmetric and that bromine was supplied to the stratosphere solely by the decomposition of long-lived organic compounds. Theys 10
et al. (2009) and Salawitch et al. (2010) showed that the stratospheric VCD of BrO can exhibit strong gradients with respect to longitude at high latitude during spring and Salawitch et al. (2010) questioned prior estimates of residual tropospheric BrO found assuming that the stratospheric burden was zonally symmetric. Theys et al. (2011) derived tropospheric BrO columns from GOME-2 spectra with a model-based strato-15
spheric BrO climatology (Theys et al., 2009) similar to that used here and described below.
Many studies related to bromine and ozone chemistry have been conducted using satellite-derived tropospheric BrO columns. Wagner and Platt (1998) reported ele-vated regions of BrO vertical column density in the Arctic and Antarctic regions. They 20
noted these enhancements were likely due to increased abundance of tropospheric BrO, rather than a stratospheric disturbance, based on a variety of factors including the correlation between enhanced columns of BrO and the O2-O2collision complex. Wag-ner et al. (2001) showed that elevated BrO column amounts observed by GOME were correlated with low ozone in the boundary layer observed in-situ at Ny- ˚Alesund (Spits-25
ACPD
11, 26173–26243, 2011Satellite-derived Arctic tropospheric
BrO columns
S. Choi et al.
Title Page
Abstract Introduction
Conclusions References
Tables Figures
◭ ◮
◭ ◮
Back Close
Full Screen / Esc
Printer-friendly Version Interactive Discussion
Discussion
P
a
per
|
Dis
cussion
P
a
per
|
Discussion
P
a
per
|
Discussio
n
P
a
per
|
using SCIAMACHY data (Wagner et al., 2007). Transport of a large BrO plume near the North Pole is also reported by Begoin et al. (2010). A back trajectory study using satellite-derived tropospheric BrO columns indicated that ODEs can be differentiated into locally activated and transport driven events (Koo et al., 2011).
Despite the numerous studies of tropospheric polar bromine chemistry using satellite 5
BrO observations, estimation and interpretation of tropospheric BrO information from space presents ongoing challenges. To properly estimate tropospheric BrO column amounts, the stratospheric contribution to the satellite-derived total column must be accurately represented (e.g. Theys et al., 2009; Salawitch et al., 2010). The global, ubiquitous background tropospheric level of BrO inferred from the satellite record is 10
sensitive to the amount of inorganic bromine (Bry) delivered to the stratosphere by VSL bromocarbons (Salawitch et al., 2005). Furthermore, low solar elevation angles in the early polar spring lead to large uncertainties in satellite total BrO column retrievals (see below). The presence of clouds further complicates the retrieval of tropospheric BrO from satellite observations. Theys et al. (2011) have recently addressed many 15
of these issues. They showed maps of tropospheric BrO columns derived using a method similar to that described below, and evaluated these columns using ground-based measurements of the tropospheric and stratospheric contributions to the total column. Our study builds upon the work of Theys et al. (2011) by further exploring the issues that affect quantification of tropospheric BrO columns and by using aircraft 20
measurements of BrO to evaluate the satellite-derived tropospheric columns.
Salawitch et al. (2010) provided an initial analysis of BrO observations obtained by instruments aboard the NASA and NOAA aircraft (Neuman et al., 2010; Liao et al., 2011b) and the OMI satellite instrument (Kurosu and Chance, 2011) during spring 2008. They simulated the stratospheric BrO column assuming VSL bromocarbons 25
supply between 5 and 10 ppt of Bry to the stratosphere in the form of product gas in-jection (PGI), in addition to the ∼2 ppt of Bry supplied by source gas injection (SGI)
ACPD
11, 26173–26243, 2011Satellite-derived Arctic tropospheric
BrO columns
S. Choi et al.
Title Page
Abstract Introduction
Conclusions References
Tables Figures
◭ ◮
◭ ◮
Back Close
Full Screen / Esc
Printer-friendly Version Interactive Discussion
Discussion
P
a
per
|
Dis
cussion
P
a
per
|
Discussion
P
a
per
|
Discussio
n
P
a
per
|
CH2Br2). The stratospheric BrO burden found by Salawitch et al. (2010) for their “best case” simulation of 7 ppt from PGI and 2 ppt from SGI is considerably larger (∼27 %
overall difference, with quite a bit of geographic variability) than the stratospheric BrO burden used by Theys et al. (2011). Salawitch et al. (2010) concluded that high column amounts of BrO derived from satellite observations could, in some cases, be attributed 5
to compression of stratospheric air to low altitudes (high pressures) and that this con-dition, not previously recognized in the analysis of the satellite BrO record, should be considered to properly relate the satellite record to surface events. The magnitude of the stratospheric enhancement is sensitive to the supply of stratospheric Bry from VSL bromocarbons as well as the pathways of this transport (i.e. PGI versus SGI; see 10
Chapter 2 of WMO (2003) for a detailed discussion of these pathways). Salawitch et al. (2010) showed agreement, to within uncertainties, between total column BrO measured by OMI and the sum of modeled stratospheric and aircraft-measured tropo-spheric BrO partial columns. However, their treatment of the tropotropo-spheric column did not explicitly account for tropospheric air mass factors (AMFs). Our study builds on this 15
prior work by using a radiative transfer model to calculate tropospheric AMFs and also by considering the effects of clouds, surface reflectivity, and viewing geometry on the evaluation of the bromine budget for Arctic spring 2008.
Validation of satellite-derived BrO columns and their relationship to ODEs was a goal of two Arctic field campaigns conducted in 2008 under the auspices of the International 20
Polar Year (IPY). The Arctic Research of the Composition of the Troposphere from Air-craft and Satellite (ARCTAS) mission was conducted in April and June–July 2008 by NASA (D. J. Jacob et al., 2010) and the US National Oceanic and Atmospheric Ad-ministration (NOAA) Aerosol, Radiation, and Cloud Processes affecting Arctic Climate (ARCPAC) mission took place in April 2008 (Brock et al., 2011). Various in-situ aircraft 25
ACPD
11, 26173–26243, 2011Satellite-derived Arctic tropospheric
BrO columns
S. Choi et al.
Title Page
Abstract Introduction
Conclusions References
Tables Figures
◭ ◮
◭ ◮
Back Close
Full Screen / Esc
Printer-friendly Version Interactive Discussion
Discussion
P
a
per
|
Dis
cussion
P
a
per
|
Discussion
P
a
per
|
Discussio
n
P
a
per
|
In this paper, we use a detailed approach to derive tropospheric BrO column densi-ties from space-based observations. The satellite and other data sets used here are described in Sect. 2. Calculation of residual tropospheric columns using total columns retrieved from OMI and GOME-2 and the stratospheric column of Salawitch et al. (2010) and accounting appropriately for instrument sensitivity is presented in Sect. 3. 5
Quantitative evaluation of our satellite-derived tropospheric BrO vertical columns using the aircraft in-situ observations of active bromine species collected during ARCTAS and ARCPAC is described in Sect. 4. We examine the results in the context of the meteo-rological conditions. Finally, we discuss the characteristics of rapid BrO enhancement events (“BrO explosions”) inferred from OMI and GOME-2, including potential relation-10
ships with meteorological parameters. Conclusions are given in Sect. 5.
2 Data description
We use a variety of aircraft and satellite measurements and model outputs to calculate and evaluate satellite-derived tropospheric BrO columns. Tropospheric BrO columns are inferred from aircraft measurements of in-situ BrO (henceforth referred to as “in-situ 15
columns”, as described in Sect. 2.1). We derive tropospheric vertical column densi-ties (VCDs) using BrO slant column densidensi-ties (SCD) retrieved from OMI and GOME-2 (see Sect. 2.2) and a model simulation of the stratospheric BrO column as detailed in Sect. 2.3. OMI rotational Raman scene pressures and MODIS cloud products (see Sect. 2.4) are used to assess cloud effects on the derived tropospheric BrO columns. 20
Data from a global reanalysis, described in Sect. 2.5, are used to examine relationships between observed BrO enhancement events and meteorological conditions.
2.1 Aircraft in-situ measurements
ACPD
11, 26173–26243, 2011Satellite-derived Arctic tropospheric
BrO columns
S. Choi et al.
Title Page
Abstract Introduction
Conclusions References
Tables Figures
◭ ◮
◭ ◮
Back Close
Full Screen / Esc
Printer-friendly Version Interactive Discussion
Discussion
P
a
per
|
Dis
cussion
P
a
per
|
Discussion
P
a
per
|
Discussio
n
P
a
per
|
during ARCPAC. An overview of the instruments, flights, and mission goals and accom-plishments are provided in the ARCTAS (D. J. Jacob et al., 2010) and ARCPAC (Brock et al., 2011) overview papers. BrO was measured using Chemical Ionization Mass Spectrometer (CIMS) instruments during both experiments (Neuman et al., 2010; Liao et al., 2011b).
5
DC-8 CIMS measurements of BrO were made once every 30 s, and WP-3D CIMS measurements were acquired once every 2 s. Measurement uncertainties for BrO are
±40 % with a detection limit of 3 pptv for WP-3D data and±40 % and a detection limit of
2–5 pptv for DC-8 data (Neuman et al., 2010; Liao et al., 2011b). In this study, we use 1 min averaged data for both DC-8 and WP-3D measurements. The spatial resolution 10
of the 1 min averaged aircraft data is approximately 10 km.
We estimate tropospheric BrO columns from the aircraft BrO mixing ratio measure-ments for each ascent and descent. Figure 1 shows the flight tracks and locations of the 16 (29) profiles made from the DC-8 (WP-3D). BrO profiles are available for 16 and 17 April 2008 from the DC-8 and 12, 15, 18, 19 and 21 April 2008 from the WP-3D. 15
To calculate tropospheric columns from the aircraft data, the profiles were binned on an altitude grid with 500 m resolution from the surface to 7.5 km (BrO measurements are available only up to 7.5 km altitude). For each bin, the median value was selected as the BrO mixing ratio at that altitude. If the median value was less than 0, then we assumed the mixing ratio was 0.
20
Figure 2a shows the entire collection of DC-8 BrO measurements and the median DC-8 (henceforth referred to as the composite) profile. Figure 2b shows samples of different types of BrO profiles collected during April 2008. Among the 16 DC-8 BrO profiles, 8 have shapes similar to the DC-8 composite profile, while the others show elevated BrO near the surface and/or in layers at altitudes from 2 to 4 km. WP-3D 25
ACPD
11, 26173–26243, 2011Satellite-derived Arctic tropospheric
BrO columns
S. Choi et al.
Title Page
Abstract Introduction
Conclusions References
Tables Figures
◭ ◮
◭ ◮
Back Close
Full Screen / Esc
Printer-friendly Version Interactive Discussion
Discussion
P
a
per
|
Dis
cussion
P
a
per
|
Discussion
P
a
per
|
Discussio
n
P
a
per
|
et al., 1999). Surprisingly, the highest mixing ratios of BrO tended to be observed above the boundary layer Neuman et al. (2010); Salawitch et al. (2010).
To estimate the tropospheric BrO column from aircraft measurements, we must first make assumptions about mixing ratios between the surface and the lowest altitude sampled by the aircraft. We only take profiles with aircraft minimum altitudes less than 5
500 m. Then, we assume that the BrO mixing ratio in the lowest bin (surface to 500 m) is the median BrO mixing ratio between the lowest aircraft altitude and 500 m. When the aircraft did not sample up to the tropopause, we made assumptions about mixing ratios between the highest aircraft altitude and the tropopause. Here, we use the upper part of the DC-8 composite profile to fill empty upper bins. However, the DC-8 com-10
posite profile only goes up to 7.5 km, the highest altitude where BrO is sampled by the aircraft. We assume that the BrO mixing ratio between 7.5 km and the tropopause is zero. Aircraft data suggest that BrO mixing ratios at these altitudes are very small for the sampled air masses (see Fig. 2). It is possible that stratospheric to tropospheric transport of air could supply BrO to the upper troposphere, particularly along the west-15
ern flank of Arctic low pressure systems (i.e. after low altitude tropopause systems pass over a region) (Salawitch et al., 2010). This idea is speculative and is not consid-ered below. Finally, layer column BrO amounts (BrO column amounts for vertical bins) are estimated using pressures and temperatures from aircraft measurements and inte-grated from the surface to the tropopause, to provide a tropospheric column BrO abun-20
dance. We use the tropopause height from the Modern Era Retrospective-Analysis for Research and Application (MERRA) data set (see Sect. 2.5).
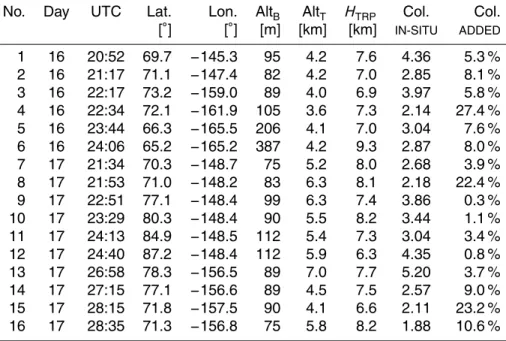
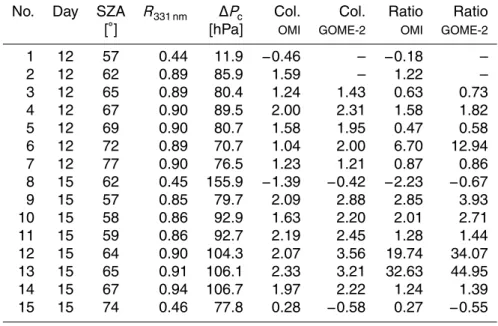
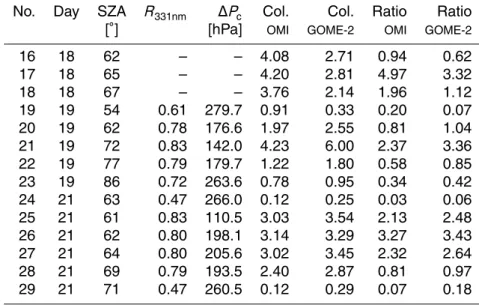
Tables 1, 2, and 2 provide information related to the aircraft BrO profiles includ-ing the bottom and top altitudes of the aircraft in-situ profiles (AltB and AltT, respec-tively), the MERRA tropopause height (HTRP), and the in-situ tropospheric BrO column 25
ACPD
11, 26173–26243, 2011Satellite-derived Arctic tropospheric
BrO columns
S. Choi et al.
Title Page
Abstract Introduction
Conclusions References
Tables Figures
◭ ◮
◭ ◮
Back Close
Full Screen / Esc
Printer-friendly Version Interactive Discussion
Discussion
P
a
per
|
Dis
cussion
P
a
per
|
Discussion
P
a
per
|
Discussio
n
P
a
per
|
in-situ aircraft BrO profiles, and the ratios of satellite-derived tropospheric BrO columns to the in-situ BrO columns (RatioOMIand RatioGOME−2).
In addition to BrO, other aircraft trace gas measurements are useful for inferring halogen chemistry and air mass characteristics. For example, Br2 was measured by CIMS instruments from both aircraft. Laboratory studies revealed that the Br2signals 5
include contributions from HOBr that reacted on inlet surfaces. Therefore, Br2 rep-resents the lower limit of HOBr+Br2 (Neuman et al., 2010). Henceforth, we refer to this measurement as “active bromine”. Soluble bromide was also measured from the DC-8 using mist chamber/ion chromatography. Soluble bromide may include inorganic bromine compounds such as HBr, HOBr, particulate bromine, and possibly BrO and 10
Br2 (Ridley et al., 2003; Dibb et al., 2010; Neuman et al., 2010; Liao et al., 2011b). Measurements of O3 mixing ratios by chemiluminescence were made from both air-craft. CO was measured using tunable diode laser absorption spectroscopy on the DC-8 and UV fluorescence on the WP-3D (D. J. Jacob et al., 2010; Brock et al., 2011).
2.2 Total BrO slant column density from OMI and GOME-2
15
OMI is a nadir-viewing ultraviolet and visible (UV/Vis) sensor (Levelt et al., 2006) aboard the NASA Aura satellite that is in a sun-synchronous orbit with an overpass of 01:38 p.m. local time. The OMI spectral resolution in the UV-2 channel used to re-trieve BrO columns is approximately 0.5 nm. The OMI swath width is about 2600 km. The UV-2 pixel size is approximately 13×24 km2at the swath center and significantly
20
larger at the swath edges. With its wide swath, OMI provides multiple daily observa-tions at high latitudes in spring and daily global coverage at low and middle latitudes. An obstruction outside the instrument that produces radiance errors (known as the “row anomaly”) reduced the swath coverage mainly after May 2008; it does not significantly affect the observations shown here (Claas et al., 2010).
25
ACPD
11, 26173–26243, 2011Satellite-derived Arctic tropospheric
BrO columns
S. Choi et al.
Title Page
Abstract Introduction
Conclusions References
Tables Figures
◭ ◮
◭ ◮
Back Close
Full Screen / Esc
Printer-friendly Version Interactive Discussion
Discussion
P
a
per
|
Dis
cussion
P
a
per
|
Discussion
P
a
per
|
Discussio
n
P
a
per
|
is 319 to 347.5 nm. BrO cross sections from Wilmouth et al. (1999) are used. The total fitting uncertainty of OMI BrO total column typically ranges from 15 to 51 % (Salawitch et al., 2010; Kurosu and Chance, 2011).
GOME-2 is a 4 channel UV/Vis nadir viewing instrument operating on Metop-A since January 2007 (Callies et al., 2000). It has a local equator crossing time of 9:30 am in 5
the descending node, a swath width of 1920 km, and a spatial resolution of 40×80 km2. For the BrO SCD retrieval used here (Begoin et al., 2010), measurements in the win-dow 336 to 347 nm are used, where GOME-2 has a spectral resolution of about 0.3 nm. SCDs of BrO are retrieved using the standard DOAS approach. Absorption due to BrO (Wahner et al., 1988), O3, NO2, and the effects of rotational-Raman scattering are in-10
cluded. The uncertainty of the GOME-2 BrO total SCDs is 10 to 30 % depending on solar zenith angle (SZA) and surface albedo and the uncertainty has both random and systematic contributions from spectral interferences and the cross-sections. As a re-sult of throughput loss of the UV channels, random errors have increased since launch. However, this effect is not significant during the time period studied here (Dikty et al., 15
2011).
All of the analyses conducted in this study are based on the assumption that the magnitude of satellite-derived total column is correct. A detailed analysis of the errors involved in deriving satellite-based tropospheric columns of BrO is beyond the scope of this paper. There are potentially large uncertainties associated with the derivation 20
of both slant and vertical absolute column BrO related to the choice of spectral fitting windows and polynomial parameters used in retrievals as well as assumed BrO vertical profiles (G. Mount, private communication, 2011; DLR, 2009).
For all analyses conducted in this study, we use level 2 (time-ordered) satellite data. Level 2 data provide the best temporal match between satellite observations and air-25
craft in-situ and ground-based observations.
2.3 Stratospheric BrO column
ACPD
11, 26173–26243, 2011Satellite-derived Arctic tropospheric
BrO columns
S. Choi et al.
Title Page
Abstract Introduction
Conclusions References
Tables Figures
◭ ◮
◭ ◮
Back Close
Full Screen / Esc
Printer-friendly Version Interactive Discussion
Discussion
P
a
per
|
Dis
cussion
P
a
per
|
Discussion
P
a
per
|
Discussio
n
P
a
per
|
by Salawitch et al. (2010), but differs in that they showed results for a fixed local solar time of 01:30 p.m. whereas here we calculate BrO along each OMI or GOME-2 orbit, which spans a range of local solar times near the pole. A photochemical steady state (PSS) model is constrained to profiles of temperature, O3, NOy, Cly, H2O, CH4, sulfate aerosol surface area, etc. output from a run of Whole Atmosphere Community Climate 5
Model (WACCM) (Garcia et al., 2007) conducted using meteorological fields for spring 2008. Salawitch et al. (2010) provide a description of this WACCM run, which was conducted to support the Stratosphere-Troposphere Analyses of Regional Transport 2008 campaign.
We specify the vertical distribution of Bry (the total bromine content of all inorganic 10
bromine species) input to the PSS model, based on a relation between Bry and CFC-12. Profiles of CFC-12 are from the NASA Global Modeling and Assimilation Of-fice (GMAO) Goddard Earth Observing System Data Assimilation System Version 5 (GEOS-5) (Rienecker et al., 2007) assimilation for spring 2008. Salawitch et al. (2010) evaluated the sensitivity of stratospheric partial column BrO to the amount of strato-15
spheric bromine supplied by VSL bromocarbons, termed VSL Bry. The value of VSL Bry is quite uncertain: Tables 1–9 of (WMO, 2011) gives a range of 1 to 8 ppt for this quantity. We use VSL Bry=7 ppt because this value gives best overall agreement be-tween OMI total column BrO and the sum of tropospheric partial column BrO inferred from ARCTAS and ARCPAC aircraft profiles and the simulated stratospheric BrO bur-20
den (see Auxiliary Material of Salawitch et al. (2010) for a discussion of the plausibility of VSL Bry=7 ppt).
The PSS model is used to find BrO, at the local solar time of each OMI or GOME-2 orbit, assuming production and loss of all species are in balance over a 24 h period of time for a stationary air parcel. Then, BrO abundance is integrated from the pressure 25
ACPD
11, 26173–26243, 2011Satellite-derived Arctic tropospheric
BrO columns
S. Choi et al.
Title Page
Abstract Introduction
Conclusions References
Tables Figures
◭ ◮
◭ ◮
Back Close
Full Screen / Esc
Printer-friendly Version Interactive Discussion
Discussion
P
a
per
|
Dis
cussion
P
a
per
|
Discussion
P
a
per
|
Discussio
n
P
a
per
|
the PSS model are provided in Sect. 6.3.2 of SPARC CCMVal (2010), and references therein.
As noted above, the Bry versus CFC-12 relation used here consists of a baseline value of Bry plus 7 ppt (representing stratospheric injection of bromine in the form of product gases of VSL bromocarbons). Baseline Bry is set to zero at the tropopause 5
and represents, above the tropopause, supply of bromine from the decomposition of methyl bromide (CH3Br), halons, as well as dibromethane (CH2Br2). Other groups place CH2Br2into the definition of VSL Bry. We consider CH2Br2to be part of baseline Bry, however, because this compound is observed above the tropical tropopause (e.g. Wamsley et al., 1998). The total stratospheric Bry burden of 26 ppt used here is at 10
the upper end of the present range of uncertainty (e.g. WMO, 2011). This formulation (7 ppt for VSL Bry plus baseline that includes CH2Br2) was chosen because it results in best agreement between OMI total column BrO and the sum of stratospheric (mod-eled) and tropospheric (measured) partial column BrO. A wide range of values for VSL Bryyields “reasonable agreement” between these two terms when all uncertainties are 15
considered (Fig. 6, Auxiliary Material, Salawitch et al., 2010). Despite the consider-able uncertainty in stratospheric Bryand the impact of this parameter on tropospheric BrO column inferred from satellite observations of total column BrO, our approach of using a value for stratospheric Bry near the upper end is supported by the generally close quantitative agreement between inferences of tropospheric BrO column from the 20
satellites and the in-situ data, described below. As noted previously, the fields of strato-spheric BrO used here are approximately 27 % larger than those reported by Theys et al. (2011) (with percentage differences that vary considerably with respect to location).
2.4 Cloud parameters
Optically thick clouds shield the underlying atmosphere from satellite sensors. The OMI 25
ACPD
11, 26173–26243, 2011Satellite-derived Arctic tropospheric
BrO columns
S. Choi et al.
Title Page
Abstract Introduction
Conclusions References
Tables Figures
◭ ◮
◭ ◮
Back Close
Full Screen / Esc
Printer-friendly Version Interactive Discussion
Discussion
P
a
per
|
Dis
cussion
P
a
per
|
Discussion
P
a
per
|
Discussio
n
P
a
per
|
over snow and ice surfaces. The Near-real-time SSM/I EASE-grid daily global Ice and snow concentration and Snow Extent (NISE) data set (Nolin et al., 1998) is used to identify snow and ice-covered pixels. When the difference between scene and terrain pressure (∆Pc) exceeds 250 hPa we infer that clouds have led to significant shielding of tropospheric BrO from the satellite sensor (Vasilkov et al., 2010), as discussed below. 5
We use level 3 (gridded) cloud optical thickness and cloud-top pressure retrievals from the MODerate-resolution Imaging Spectroradiometer (MODIS) (Platnick et al., 2003) on the NASA Aqua satellite as a secondary check on our detection of shield-ing clouds. Analysis of cloud effects on the satellite-derived tropospheric BrO columns is presented in Sect. 3.2.
10
2.5 Meteorological data sets
Tropopause heights are inferred along the flight tracks using tropopause pressure and geopotential height profiles from MERRA, a reanalysis based on GEOS-5 system (Rienecker et al., 2007) provided by NASA Global Modeling and Assimilation Office (GMAO). These tropopause heights are used to integrate the aircraft BrO profiles and 15
are given in Tables 1, 2 and 2. MERRA also provides meteorological parameters in-cluding sea level pressure, wind speed, and planetary boundary layer height. These meteorological data are used to infer relationships between BrO enhancements and the meteorological conditions. MERRA parameters are provided at 0.5◦ latitude×0.667◦
longitude resolution. All parameters except geopotential height profiles are provided 20
hourly; geopotential height is given every 6 h.
3 Derivation of tropospheric BrO vertical column density
3.1 Residual method to obtain tropospheric BrO vertical column density
ACPD
11, 26173–26243, 2011Satellite-derived Arctic tropospheric
BrO columns
S. Choi et al.
Title Page
Abstract Introduction
Conclusions References
Tables Figures
◭ ◮
◭ ◮
Back Close
Full Screen / Esc
Printer-friendly Version Interactive Discussion
Discussion
P
a
per
|
Dis
cussion
P
a
per
|
Discussion
P
a
per
|
Discussio
n
P
a
per
|
Theys et al. (2011), we calculate tropospheric BrO vertical column densities (VCDTrop) for each OMI or GOME-2 pixel using the derived BrO total slant column (SCDTotal), an estimate of stratospheric BrO vertical column (VCDStrat), stratospheric air mass factors (AMFStrat), and an estimate of the tropospheric air mass factor (AMFTrop) as follows:
VCDTrop=SCDTrop
AMFTrop =
(SCDTotal−SCDStrat)
AMFTrop =
(SCDTotal−VCDStrat·AMFStrat)
AMFTrop . (6)
5
The SCD of a given absorber seen by a satellite sensor is defined as the amount of the absorber along an average light path taken by photons as they travel from the sun, through the atmosphere, and back to the sensor. The SCD is affected by scattering and absorption within the atmosphere as well as reflection offthe surface and clouds.
For a given altitude range (denoted by a subscriptz), The air mass factor (AMFz) is 10
used to convert SCDz to VCDz as follows:
AMFz=SCDz/VCDz. (7)
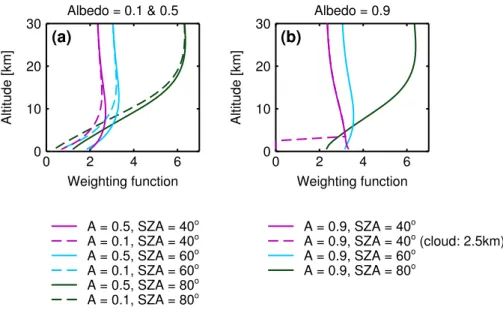
The sensitivity of UV radiance measurements to the BrO layer amounts varies with altitude. This variation depends on viewing geometry (mainly solar zenith angle, SZA, and view zenith angle, VZA), surface albedo, cloud effects, and the vertical BrO profile. 15
We must account for this varying sensitivity in the AMF. Using the optically thin absorber assumption, the AMFz can be formulated as
AMFz=SCDz/VCDz=
R
W(z)N(z)d z
R
N(z)d z , (8)
(Palmer et al., 2001; Theys et al., 2011), wherezis altitude,N(z) is the number density profile of the absorber, andW(z) is the weighting function profile that represents all the 20
parameters influencing the AMF except the vertical profile of the absorber.
ACPD
11, 26173–26243, 2011Satellite-derived Arctic tropospheric
BrO columns
S. Choi et al.
Title Page
Abstract Introduction
Conclusions References
Tables Figures
◭ ◮
◭ ◮
Back Close
Full Screen / Esc
Printer-friendly Version Interactive Discussion
Discussion
P
a
per
|
Dis
cussion
P
a
per
|
Discussion
P
a
per
|
Discussio
n
P
a
per
|
to calculate AMFStrat; BrO VCDs are obtained by applying wavelength- and albedo-dependent AMFs to the BrO absorption cross sections prior to fitting. It is assumed that all BrO resides in the stratosphere in this procedure. An effective AMF is then defined as the ratio of the SCD (derived independently as described in Sect. 2.2) to this VCD. We assume that AMFStratis represented by this effective air mass factor. 5
We compute the tropospheric AMFTropat 344.6 nm using the LInearized Discrete Or-dinate Radiative Transfer (LIDORT) model (Spurr et al., 2001). We use a clear scene assumption in the AMF calculation. The DC-8 composite profile shown in Fig. 2a is taken as the default tropospheric BrO profile in the AMFTrop calculation. However, we use individual aircraft profiles of BrO, from both the DC-8 and WP-3D, to calculate 10
AMFTropfor point-to-point comparisons between aircraft in-situ and satellite-derived tro-pospheric columns.
We have generated a look-up table of AMFTrop for various representative surface albedos and viewing geometries. A 5◦ interval for SZA and a 2.5◦ interval for VZA are used. Because the weighting functions are highly dependent on surface albedo, we 15
use step-widths of 0.1 in the range [0,1] for surface albedo.
The calculation of AMFTropuses the derived OMI reflectivity at 331 nm for each pixel, from the OMI Total Ozone Mapping Spectrometer (TOMS) total O3product, as a proxy for surface albedo. We thus avoid using a surface albedo climatology, which can lead to AMF errors when the climatology differs from the actual surface albedo. Such errors 20
can occur when the snow or sea ice distribution differs from the climatological mean, which is of particular concern at high latitudes during spring.
3.2 Sensitivity of the derived tropospheric column to SZA, surface albedo, and
clouds
Here, we investigate the sensitivity of the satellite-derived tropospheric BrO retrieval 25
ACPD
11, 26173–26243, 2011Satellite-derived Arctic tropospheric
BrO columns
S. Choi et al.
Title Page
Abstract Introduction
Conclusions References
Tables Figures
◭ ◮
◭ ◮
Back Close
Full Screen / Esc
Printer-friendly Version Interactive Discussion
Discussion
P
a
per
|
Dis
cussion
P
a
per
|
Discussion
P
a
per
|
Discussio
n
P
a
per
|
at high latitudes (>60◦N) during the day in the early spring SZA is >50◦. Figure 3a shows that when the sun is relatively high in the sky (SZA≤∼60◦), OMI and GOME-2
should have good sensitivity to tropospheric BrO for surface albedos>0.5. Sensitivity is significantly reduced for darker surfaces (e.g. albedo=0.1). Sensitivity to tropospheric BrO decreases with increasing SZA; there is significantly lower sensitivity at 80◦
even 5
for a surface albedo of 0.5. Figure 3b shows that at high surface albedo (0.9), there is increased sensitivity to BrO near the surface in addition to good overall tropospheric sensitivity for SZA up to 80◦
.
To evaluate the effect of optically thick clouds on the sensitivity to tropospheric BrO, we show a weighting function profile for a cloud with an extinction coefficient of 300 at 10
2.5 km in Fig. 3b. Similar to the results of Theys et al. (2011), this weighting function is the same as the clear-sky case above the cloud, and drops to zero below the cloud. Hence, OMI and GOME-2 are not sensitive to BrO below optically thick clouds.
The effect of optically thin clouds and aerosols on the sensitivity of OMI and GOME-2 to tropospheric BrO is dependent on surface reflectivity and viewing geometry. Ac-15
cording to Vasilkov et al. (2010), the UV cloud shielding effect is generally reduced over bright surfaces as compared to dark surfaces for nadir-viewing satellite sensors. For example, there is good sensitivity to tropospheric absorbers below thin clouds over bright surfaces near the nadir swath positions for SZAs≤∼67◦. On the other hand, their
simulation shows that there can be UV cloud shielding at the swath edge at high solar 20
zenith angles, even for a thin cloud (τ∼0.5). The clear scene assumption in the AMF calculation is appropriate over bright surfaces (i.e. snow/ice) when the derived scene pressure is close to the terrain pressure, which indicates that any particles along the line of sight must either be a thin, non-shielding cloud or an aerosol layer (the so-called Arctic haze) common in polar regions. The optical thickness of Arctic haze during ARC-25
TAS was reported to be up to∼0.2 at 354 nm (Shinozuka et al., 2011). Based on the
ACPD
11, 26173–26243, 2011Satellite-derived Arctic tropospheric
BrO columns
S. Choi et al.
Title Page
Abstract Introduction
Conclusions References
Tables Figures
◭ ◮
◭ ◮
Back Close
Full Screen / Esc
Printer-friendly Version Interactive Discussion
Discussion
P
a
per
|
Dis
cussion
P
a
per
|
Discussion
P
a
per
|
Discussio
n
P
a
per
|
Figure 4a shows computed tropospheric air mass factors. As shown for the weighting functions in Fig. 3, tropospheric air mass factors are higher over brighter surfaces owing to increased near-surface sensitivity. However, tropospheric sensitivity begins to be lost as SZA increases; tropospheric sensitivity almost disappears when SZA>85◦even for relatively bright surfaces. In this study, we present satellite-derived BrO tropospheric 5
columns only for SZA<85◦ .
The sensitivity of AMFTrop to the tropospheric BrO profile is assessed in Fig. 4b. For a bright surface (albedo=0.9), no significant difference exists between tropospheric AMFs computed using the DC-8 composite profile and a profile where all tropospheric BrO is contained below 500 m for SZA≤∼60◦. This is a consequence of good sensitivity 10
at all tropospheric altitudes for bright surfaces and low SZA as shown in Fig. 3. For 60◦
<SZA<75◦
, the sensitivity to middle- and upper-tropospheric BrO is maintained while the near-surface sensitivity drops; this leads to a small sensitivity to the profile shape under these conditions. Profile sensitivity decreases for higher SZAs as the sensitivity to the entire troposphere drops. For a darker surface (albedo=0.4), we 15
have lower sensitivity to BrO near the surface even when the sun is relatively high (SZA∼40◦), leading to greater profile sensitivity at all SZAs.
We next examine tropospheric column BrO estimated from OMI in the context of the different sensitivities discussed above. Figure 5 shows OMI total, the model strato-spheric, and the derived tropospheric BrO columns for OMI orbit 20 050 on 22 April 20
2008 along with several parameters that impact the sensitivity of the radiance observa-tion to the tropospheric BrO column. These parameters include 331 nm reflectivity (a proxy for surface albedo),∆Pc, and SZA.
Nearly zero tropospheric BrO column amounts are obtained over low surface albedo areas (OMI reflectivity<0.5) such as the Barents Sea (marked with black squares in 25
ACPD
11, 26173–26243, 2011Satellite-derived Arctic tropospheric
BrO columns
S. Choi et al.
Title Page
Abstract Introduction
Conclusions References
Tables Figures
◭ ◮
◭ ◮
Back Close
Full Screen / Esc
Printer-friendly Version Interactive Discussion
Discussion
P
a
per
|
Dis
cussion
P
a
per
|
Discussion
P
a
per
|
Discussio
n
P
a
per
|
tropospheric vertical columns are near zero. This indicates that satellite-derived tropo-spheric BrO may not be reliable when the surface albedo is low.
In Fig. 5, the cloud shielding effect is shown over Siberia (marked with orange rect-angles), where the OMI rotational Raman cloud product reports∆Pc>250 hPa. Aqua MODIS also indicates cloud cover, with cloud top pressures between 450 and 500 hPa 5
(not shown). Our derived tropospheric columns over this region are significantly less than those from adjacent areas without cloud cover. This supports the presence of tropospheric BrO mainly below 450–500 hPa and the ability of OMI and other nadir viewing sensors to capture information about tropospheric BrO over bright polar re-gions, with SZA up to ∼85◦ when the sky is clear. Theys et al. (2011) also used the 10
cloud shielding effect to infer an amount of BrO in the troposphere, but applied this approach only in the tropics.
For completeness, we include all data in our analysis of aircraft measurements. How-ever, we note aircraft soundings for which observing conditions likely produce large errors in the satellite-derived tropospheric BrO columns. In mapping surface BrO en-15
hancement events with satellite retrievals, we use only data that has good sensitivity to the troposphere: SZA<85◦,∆Pc<250 hPa, and surface albedo>0.7.
3.3 Uncertainty analysis
For a single pixel, we express the uncertainty of the tropospheric VCD,σVCDTrop, in a simplified form:
20
σVCD2 Trop=
σ
SCDTotal
AMFTrop
2 +
σ
VCDStratAMFStrat
AMFTrop
2
(9)
(Boersma et al., 2004; De Smedt et al., 2008; Theys et al., 2011), whereσSCDTotalis the uncertainty of total slant column,σSCDStrat is the uncertainty of stratospheric slant col-umn, andσAMF
Tropis the uncertainty of tropospheric air mass factor. This representation
ACPD
11, 26173–26243, 2011Satellite-derived Arctic tropospheric
BrO columns
S. Choi et al.
Title Page
Abstract Introduction
Conclusions References
Tables Figures
◭ ◮
◭ ◮
Back Close
Full Screen / Esc
Printer-friendly Version Interactive Discussion
Discussion
P
a
per
|
Dis
cussion
P
a
per
|
Discussion
P
a
per
|
Discussio
n
P
a
per
|
We take the fitting uncertainty derived from observed minus fitted radiances for each pixel asσSCDTotal. This assumes that the SCDTotalerror has a zero mean. The average fitting uncertainty at latitudes greater than 60◦N is about 18 %.
We estimate the uncertainty of the stratospheric slant column (σSCDStrat) by multi-plying the uncertainty of the stratospheric column BrO by the stratospheric AMF. The 5
uncertainty of the stratospheric column BrO results from a root-sum-squares combina-tion of three terms: the uncertainty in chemical kinetics that govern the BrO to Bryratio, the uncertainty in the dynamics that govern CFC-12 (and hence Brydue to Source Gas Injection), and the uncertainty in VSL Bry. The uncertainty in chemical kinetics is eval-uated by varying the rate constant of individual chemical reactions (includingJ values) 10
by the 1-sigma estimate of uncertainty given by Sander et al. (2006). The most im-portant chemical term is BrO+NO2forming BrNO3; this rate constant is uncertain by about a factor of 2 at 220 K. The uncertainty due to dynamics is found by repeating calculations for plus and minus 4 % variations in the abundance of CFC-12, because comparison to aircraft observations showed CFC-12 from GEOS-5 was accurate to 15
within±4 % in the lower stratosphere (Salawitch et al., 2010). Finally, the uncertainty
due to VSL Bry is set at±27 %, which represents the mean difference in stratospheric column BrO resulting from our approach to handling this term compared to the ap-proach of Theys et al. (2011).
Here, we neglect the uncertainty in the tropospheric air mass factor as it is relatively 20
ACPD
11, 26173–26243, 2011Satellite-derived Arctic tropospheric
BrO columns
S. Choi et al.
Title Page
Abstract Introduction
Conclusions References
Tables Figures
◭ ◮
◭ ◮
Back Close
Full Screen / Esc
Printer-friendly Version Interactive Discussion
Discussion
P
a
per
|
Dis
cussion
P
a
per
|
Discussion
P
a
per
|
Discussio
n
P
a
per
|
4 Results and discussions
4.1 Comparisons of aircraft in-situ measurements with satellite retrievals
In this section, comparisons between aircraft and satellite inferences of tropospheric column BrO are shown for cases where agreement is good, agreement is poor but the cause for disagreement is understood, and agreement is poor and not well understood. 5
These comparisons are performed to evaluate the veracity of the satellite-derived tro-pospheric column BrO product. We present a series of figures for various ARCTAS and ARCPAC flights. For each, we show maps of the satellite-derived total and tropospheric columns and time series of various aircraft measurements, collocated satellite-derived BrO data, and estimated stratospheric BrO amounts with vertical error bars derived us-10
ing the formulation given in Sect. 3.3. Satellite-derived data are shown for all conditions (e.g. even in the presence of thick clouds that likely shield the surface). We also show plots of various parameters that affect the sensitivity of the satellite measurements to tropospheric BrO and note times and places where satellite observing conditions are not ideal for inferring reliable tropospheric BrO amounts.
15
4.1.1 Cases of good agreement between satellite and in-situ data
Figure 6a shows maps of the OMI and GOME-2 measurements of total column BrO as well as maps of tropospheric column BrO inferred from each satellite sensor on 17 April 2008. The track of the DC-8 and locations of BrO profiles, for the ARCTAS flight on this date, are marked. The bottom panel shows geographic regions of interest. OMI 20
and GOME-2 orbits closest in time to the ARCTAS flight are used.
The tropospheric column BrO maps have different spatial structure than maps of total column BrO. For example, total column BrO is highest over the north coast of Canada. These local maxima are significantly reduced in the tropospheric columns. A long tail of enhanced values near the North Pole is pronounced in the maps of tropospheric 25
ACPD
11, 26173–26243, 2011Satellite-derived Arctic tropospheric
BrO columns
S. Choi et al.
Title Page
Abstract Introduction
Conclusions References
Tables Figures
◭ ◮
◭ ◮
Back Close
Full Screen / Esc
Printer-friendly Version Interactive Discussion
Discussion
P
a
per
|
Dis
cussion
P
a
per
|
Discussion
P
a
per
|
Discussio
n
P
a
per
|
al. (2010) and Theys et al. (2011), inferring tropospheric BrO from the total BrO column requires an accurate estimate of the stratospheric contribution to the total column, because variability induced by stratospheric dynamics is comparable in magnitude to variability induced by the surface release of bromine. Figure 6a is a perfect illustration of this point, which as noted above has been overlooked in many prior studies.
5
Figure 6b shows time series plots of DC-8 flight data and collocated satellite mea-surements on 17 April 2008. DC-8 data include aircraft altitude, in-situ O3, CO, BrO, active bromine and soluble bromide. Satellite data include OMI-derived BrO columns (total and tropospheric),∆Pc, OMI 331 nm reflectivity, and Aqua MODIS cloud optical thickness. Estimated errors of satellite-derived BrO columns are presented as vertical 10
error bars. The tropopause height, as given in the MERRA data set, is at approxi-mately∼7 km during the flight (not shown). CO and O3 data suggest that there were no stratospheric intrusions for any of the collected tropospheric BrO profiles. Obvious signatures of stratospheric air (low CO and high O3) were occasionally seen, but only when the aircraft was flying near or above the tropopause.
15
Satellite-derived BrO tropospheric columns (orange line) are∼zero near Fairbanks
(see top panel of Fig. 6b). As discussed in Sects. 3.1 and 3.2, tropospheric BrO infor-mation is not reliably retrieved when surface reflectivities are less than∼0.4, which is
the case near Fairbanks (see the fourth panel of Fig. 6b).
Both total and tropospheric column BrO show a slight dip near the pole, where the 20
OMI and MODIS cloud products indicate shielding clouds (middle of Fig. 6b) . Here, the low values of derived tropospheric BrO over optically thick clouds likely result from the cloud shielding effect (Theys et al., 2011). Such clouds may also reduce tropospheric BrO columns by slowing photochemical production of active bromine.
In-situ tropospheric column BrO, marked as black dots in the time series plot (the 25
ACPD
11, 26173–26243, 2011Satellite-derived Arctic tropospheric
BrO columns
S. Choi et al.
Title Page
Abstract Introduction
Conclusions References
Tables Figures
◭ ◮
◭ ◮
Back Close
Full Screen / Esc
Printer-friendly Version Interactive Discussion
Discussion
P
a
per
|
Dis
cussion
P
a
per
|
Discussion
P
a
per
|
Discussio
n
P
a
per
|
with aircraft data, shown as red squares, are obtained by averaging pixels over the corresponding flight segment.
The OMI tropospheric BrO columns exhibit a magnitude and variability similar to that of the DC-8 in-situ columns. For example, profile #12 reports high BrO mixing ratios from the surface to ∼4 km; the OMI tropospheric BrO column (as well as GOME-2,
5
shown in Fig. 6a but not in Fig. 6b) is also relatively high at the same location.
However, some discrepancies appear, perhaps because the aircraft captures small scale features that the satellite observations cannot resolve. For example, in-situ profile #13 shows a relatively large value for troposphere column BrO, caused by enhanced BrO mixing ratios in a layer near 2 km. This could be a local event as the nearby 10
aircraft column #14 does not show such an enhancement. The satellite retrieval agrees well with profile #14 but underestimates the abundance of BrO measured in profile #13. Overall, OMI tropospheric column BrO quantitatively agrees with the DC-8 in-situ column BrO to within the respective estimated uncertainties. The comparison between satellite and in-situ tropospheric column BrO for this flight is further quantified by Liao 15
et al. (2011b). These comparisons demonstrate the ability of OMI and GOME-2 to capture the magnitude and spatial distribution of tropospheric column BrO over bright surfaces for clear conditions.
4.1.2 Examination of differences between satellite-derived and in-situ
tropospheric columns of BrO
20
We next describe two cases of apparent inconsistency between satellite and in-situ observations. Figures 7a and 7b show data corresponding to the DC-8 flight on 5 April 2008. In-situ measurements did not detect ozone depletion or high bromine over Hudson Bay, whereas OMI and GOME-2 both report high total column BrO (Salawitch et al., 2010). BrO measurements were not available to produce profiles for this flight, 25
but active bromine and soluble bromide were reported.
ACPD
11, 26173–26243, 2011Satellite-derived Arctic tropospheric
BrO columns
S. Choi et al.
Title Page
Abstract Introduction
Conclusions References
Tables Figures
◭ ◮
◭ ◮
Back Close
Full Screen / Esc
Printer-friendly Version Interactive Discussion
Discussion
P
a
per
|
Dis
cussion
P
a
per
|
Discussion
P
a
per
|
Discussio
n
P
a
per
|
and structure as the calculated stratospheric column BrO. This suggests that the ele-vated total column BrO over Hudson Bay could be a consequence of high stratospheric columns. Furthermore, the in-situ CO and O3 measurements indicate no evidence of stratospheric air below 6 km altitude in ascending or descending flight tracks near Hud-son Bay.
5
Figures 8a and 8b show similar maps and time series, respectively, for the DC-8 flight on DC-8 April 200DC-8. GOME-2 observations during this flight are not available. Aircraft in-situ BrO measurements are also not available for this flight. This makes it difficult to evaluate the validity of the OMI-derived BrO tropospheric columns. The aircraft observed a severe ozone depletion event ([O3]<1 ppbv) and high levels of 10
active bromine and soluble bromide near Alert (marked as black square), whereas the OMI total column BrO is relatively low and the inferred OMI tropospheric column BrO is at or near background levels. The ODE observed by the DC-8 on 8 April 2008 is thus not apparent in the satellite measurement of BrO on this date.
As described in Eqs. (3), (4), and (5), BrO catalyzes the loss of ozone and, at the 15
same time, BrO is produced by reaction of Br with O3. This suggests that high BrO con-centrations cannot be maintained if O3 is completely depleted, even though plenty of active bromine may be available. This explanation is consistent with other observations (e.g. Hausmann and Platt, 1994; Tuckermann et al., 1997; Neuman et al., 2010) that show high BrO concentrations only when ozone is partially depleted. The presence 20
of a severe ozone depletion event is therefore indicative of an expectation of little or no enhancement of tropospheric BrO, despite the presence of large amounts of active bromine and soluble bromide. Liao et al. (2011a) also discuss the relationship between O3 and BrO; little BrO exists when O3 is low due to the partitioning between Br and BrO.
25
ACPD
11, 26173–26243, 2011Satellite-derived Arctic tropospheric
BrO columns
S. Choi et al.
Title Page
Abstract Introduction
Conclusions References
Tables Figures
◭ ◮
◭ ◮
Back Close
Full Screen / Esc
Printer-friendly Version Interactive Discussion
Discussion
P
a
per
|
Dis
cussion
P
a
per
|
Discussion
P
a
per
|
Discussio
n
P
a
per
|
4.1.3 Cases of disagreement between satellite and in-situ data
Figure 9a shows maps of satellite-derived BrO columns and the flight track of the NOAA ARCPAC WP-3D on 19 April 2008. The OMI (shown) and GOME-2 (not shown) data both indicate enhanced total and tropospheric columns of BrO over the Chukchi Sea. The aircraft flew into the area of elevated satellite-derived tropospheric column BrO at 5
the northernmost extent of the track.
Figure 9b shows time series plots for the flight of 19 April 2008. Two types of dis-agreement between in-situ and satellite tropospheric column BrO are observed. First, satellite-derived tropospheric column BrO is considerably less than the in-situ column over surfaces with moderate reflectivity in the presence of clouds. For example, the 10
OMI estimate is less than the WP-3D columns (#19 and #23) near Fairbanks. These observations were obtained in a region where the surface albedo is between 0.4 and 0.6, in the presence of low level clouds. This type of disagreement may be expected from the sensitivity studies described in Sect. 3.2. It is a challenge for satellite sen-sors to accurately retrieve tropospheric BrO over a moderately reflective surface in the 15
presence of clouds.
The second type of disagreement during this flight is illustrated by profile #21, where both OMI and GOME-2 tropospheric column BrO are significantly enhanced (only OMI is shown in the first panel of Fig. 9b), whereas the in-situ BrO column does not show evidence of enhancement. Artifacts from clouds or surface albedo are not the likely 20
explanation for this disagreement, as the surface was bright and no clouds are evident in∆Pc(fourth panel, Fig. 9b). The highest level of active bromine is observed from the aircraft sensor at the same location where tropospheric column BrO from both satellite sensors show enhancements. O3 mixing ratios of∼10 ppbv suggest the aircraft sam-pled a partial ozone depletion event (e.g. Ridley et al., 2003). Prior DOAS observations 25
in the Arctic suggest that BrO should still be present for O3 levels of∼10 ppbv