www.atmos-chem-phys.net/14/10267/2014/ doi:10.5194/acp-14-10267-2014
© Author(s) 2014. CC Attribution 3.0 License.
Size-resolved cloud condensation nuclei (CCN) activity and closure
analysis at the HKUST Supersite in Hong Kong
J. W. Meng1, M. C. Yeung2, Y. J. Li1,*, B. Y. L. Lee1, and C. K. Chan1,2
1Division of Environment, The Hong Kong University of Science and Technology, Clear Water Bay, Hong Kong SAR, China 2Department of Chemical and Biomolecular Engineering, The Hong Kong University of Science and Technology, Clear
Water Bay, Hong Kong SAR, China
*current address: School of Engineering and Applied Sciences, Harvard University, Cambridge, USA
Correspondence to:C. K. Chan ([email protected])
Received: 6 March 2014 – Published in Atmos. Chem. Phys. Discuss.: 3 April 2014 Revised: 20 August 2014 – Accepted: 25 August 2014 – Published: 26 September 2014
Abstract. The cloud condensation nuclei (CCN) proper-ties of atmospheric aerosols were measured on 1–30 May 2011 at the HKUST (Hong Kong University of Science and Technology) Supersite, a coastal site in Hong Kong. Size-resolved CCN activation curves, the ratio of number con-centration of CCN (NCCN) to aerosol concentration (NCN)
as a function of particle size, were obtained at supersat-uration (SS)=0.15, 0.35, 0.50, and 0.70 % using a DMT (Droplet Measurement Technologies) CCN counter (CCNc) and a TSI scanning mobility particle sizer (SMPS). The mean bulk size-integratedNCCNranged from∼500 cm−3at
SS=0.15 % to∼2100 cm−3at SS=0.70 %, and the mean bulk NCCN/ NCN ratio ranged from 0.16 at SS=0.15 % to
0.65 at SS=0.70 %. The average critical mobility diameters (D50) at SS=0.15, 0.35, 0.50, and 0.70 % were 116, 67, 56,
and 46 nm, respectively. The corresponding average hygro-scopic parameters (κCCN) were 0.39, 0.36, 0.31, and 0.28.
The decrease inκCCNcan be attributed to the increase in
or-ganic to inoror-ganic volume ratio as particle size decreases, as measured by an Aerodyne high resolution time-of-flight aerosol mass spectrometer (HR-ToF-AMS). TheκCCN
corre-lates reasonably well with κAMS_SR based on size-resolved
AMS measurements:κAMS_SR=κorg×forg+κinorg×finorg,
whereforgandfinorgare the organic and inorganic volume
fractions, respectively,κorg=0.1 andκinorg=0.6, with aR2 of 0.51.
In closure analysis,NCCNwas estimated by integrating the
measured size-resolvedNCNfor particles larger thanD50
de-rived fromκassuming internal mixing state. Estimates using κAMS_SR show that the measured and predictedNCCN were
generally within 10 % of each other at all four SS. The de-viation increased to 26 % whenκAMS was calculated from
bulk PM1AMS measurements of particles because PM1was
dominated by particles of 200 to 500 nm in diameter, which had a larger inorganic fraction than those ofD50 (particle
diameter < 200 nm). A constantκ=0.33 (the average value ofκAMS_SRover the course of campaign) was found to give
anNCCNprediction within 12 % of the actual measured
val-ues. We also comparedNCCN estimates based on the
mea-sured averageD50 and the average size-resolved CCN
ac-tivation ratio to examine the relative importance of hygro-scopicity and mixing state. NCCN appears to be relatively
more sensitive to the mixing state and hygroscopicity at a high SS=0.70 % and a low SS=0.15 %, respectively.
1 Introduction
Atmospheric aerosols can act as cloud condensation nuclei (CCN) and affect cloud formation by influencing the CCN number concentration (NCCN) and the size of cloud droplets.
Whether aerosol particles will eventually form cloud droplets under a set atmospheric condition mainly depends on their size, chemical composition, and mixing states. Predicting NCCN usually involves measuring the aerosol size
Ambient aerosols are complex mixtures and the aerosol com-positions vary substantially with particle size. The hygro-scopicity parameter (κ) is used to represent the effect of chemical composition on CCN activity (Petters and Kreiden-weis, 2007, 2013). Size-resolved chemical compositions give a size-dependentκ which leads to betterNCCN predictions
than those based on bulk compositions (Medina et al., 2007; Stroud et al., 2007; Wang et al., 2010).
While the real-time aerosol size-resolved chemical com-positions such as non-refractory (NR)-species and black car-bon (BC) can be obtained with an aerosol mass spectrometer and a single particle soot photometer, respectively, informa-tion on the mixing state is usually not available or incom-plete. Various assumptions have been applied to describe the aerosol mixing state (Asa-Awuku et al., 2011; Bougiatioti et al., 2009; Cubison et al., 2008; Ervens et al., 2010; Lance et al., 2009; Lathem et al., 2013; Moore et al., 2012a; Rose et al., 2011; Wang et al., 2010).NCCN predictions assuming
internal mixing are usually larger than measured values by 20 % or even more, since this assumption overestimates the contribution of organics toNCCN (Rose et al., 2011; Wang
et al., 2010; Wex et al., 2010). Another extreme assumption is external mixing, which is when the aerosol contains dif-ferent types of particles but each particle consists of a single species (Textor et al., 2006; Zhang et al., 2010). Under this assumption, the number concentration (NCN) of each type of
particles is determined as the product of the total NCNand
the volume fraction of the species. The D50 of a species is
calculated based on itsκ (Moore et al., 2012a; Wang et al., 2010) andNCCNis obtained by integratingNCNaboveD50.
Finally, the totalNCCNis calculated by adding up all the
pre-dictedNCCNof the species. This simplified external mixing state assumption could underestimate NCCN. For example,
Wang et al. (2010) reported an underestimation of∼20 % in NCCN at supersaturation (SS) from 0.11 to 0.35 %. Aerosol
mixing state and chemical composition are thus important factors that need to be considered in the CCN prediction, es-pecially in places where anthropogenic aerosol emission is strong and pollution is heavy (Ervens et al., 2010; Kammer-mann et al., 2010; Kerminen et al., 2012; Rose et al., 2010; Wang et al., 2010).
Measurements of the condensation nuclei (CN) and CCN spectra simultaneously by combining a scanning mobility particle sizer (SMPS) and a CCN counter (CCNc) have been made (Asa-Awuku et al., 2010; Lance et al., 2009; Moore et al., 2010, 2012a; Padró et al., 2010; Rose et al., 2010). The size-resolved CCN activation ratios, i.e., the fraction of the measuredNCCN/ NCNas a function of particle size, are
the combined results of the size distribution, size resolved chemical composition, and the mixing state of the aerosols. Recently, Deng et al. (2013) estimatedNCCN by integrating
the product of the measured size-distributed NCN and the
averaged size-resolved CCN activation ratio at each particle size bin measured at Wuqing in the North China Plain. The
estimated and measured values differed by less than 6 % at SS=0.06 to 0.81 %.
The rapid urbanization and industrial development in the Pearl River delta (PRD) have resulted in heavy air pollu-tion, especially particulate matter (PM) pollution (Chan and Yao, 2008). Hong Kong, a typical coastal city southeast of the PRD, is affected by PM due to both local anthropogenic emissions and transportation of pollutants from the PRD (Li et al., 2014).
In this study, we report for the first time size-resolved measurements of CCN activity in Hong Kong. We corre-lated the CCN-derived hygroscopicity (κCCN) with those
es-timated from the size-dependent aerosol chemical composi-tions determined by an Aerodyne high-resolution time-of-flight aerosol mass spectrometer (HR-ToF-AMS, hereafter as AMS). Assuming internal mixtures, we carried out closure studies onNCCN prediction based on the size-distributions ofNCNmeasured by a TSI SMPS and on the hygroscopicity
values derived from size resolved and size integrated chem-ical compositions measured by AMS using Köhler theory, κAMS, and some assumed constants. Finally, using the
aver-ageD50 and the size-resolved CCN activation ratios from
the CCN measurements, we examined the relative impor-tance of hygroscopicity and mixing state inNCCNpredictions
at different SS. Hygroscopicity is technically a property of aerosols and it is determined by their chemical composition, mixing state, and size distribution. In this paper, we refer hy-groscopicity as a property of the components, assuming in-ternal mixing, in aerosols for the discussions below.
2 Experimental methods
2.1 Sampling site and meteorological conditions Measurements of aerosol chemical properties and CCN activity were carried out throughout the entire month of May 2011 at the Air Quality Research Supersite situ-ated on the campus of the Hong Kong University of Sci-ence and Technology (HKUST) on the east coast of Hong Kong (see http://www.envr.ust.hk/research/research-facility/ background-materials.html). High relative humidity (RH) with a mean of 81 % and an average temperature of 26.0◦C
prevailed in this study. More information on the sampling lo-cation and meteorological conditions is available from Lee et al. (2013) and Li et al. (2013). Hygroscopic tandem differ-ential mobility analyzer (HTDMA) measurements have also been reported at this site (Lopez-Yglesias et al., 2014; Yeung et al., 2014).
2.2 Instrument setup 2.2.1 Sample Inlet System
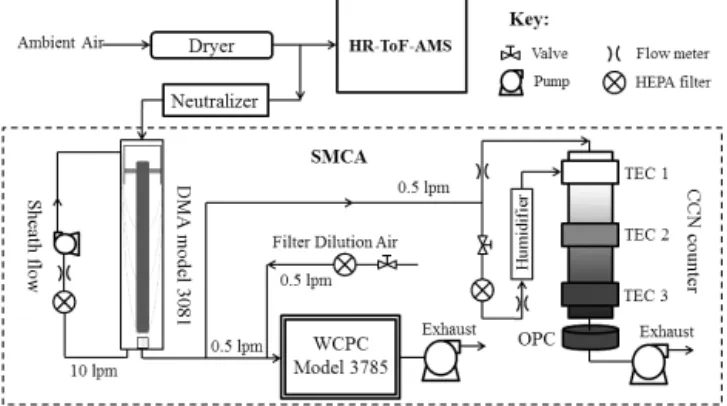
Ambient air was sampled at a flow rate of 16.67 L min−1
Figure 1. Schematic of the experimental setup for size-resolved CCN activation and chemical composition measurement.
supersite (appropriately 20 m above sea level) and into a stainless steel sampling port supplying the online instru-ments of the TSI SMPS, the Droplet Measurement Tech-nologies (DMT) dual column continuous-flow CCN counter (CCNc-200) and the Aerodyne AMS. The sampled air passed through a 1 m long diffusion drier (Brechtel Manufacturing Inc., San Francisco, CA) filled with silica gel, thus its RH was below 30 % before it went into the above instruments for measurements.
2.2.2 CCN measurements
Size-resolved CCN spectra and activation ratios were mea-sured with the CCNc-200 (Lance et al., 2006; Roberts and Nenes, 2005) coupled with a TSI SMPS, consisting of a dif-ferential mobility analyzer (DMA, TSI 3081L) and a water-based condensation particle counter (WCPC, TSI 3785).
As shown in Fig. 1, charge-neutralized aerosols passed through the DMA for classification. The classified aerosols were then split into two streams: with one going into the WCPC forNCNmeasurements and the other into the
CCNc-200 for NCCN measurements. The particle size
distribu-tion was measured every 6 min, with an up-scan time of 300 s. The sample flow rate was 1 L min−1 for the DMA,
0.5 L min−1for the WCPC and the CCNc-200 each, and the
closed-loop sheath air flow rate was 10 L min−1. These flow
rate settings allow SMPS (DMA + WCPC) measurements for particles ranging from 7 to 300 nm in mobility diameter (Dm), which as we will show later, cover theD50(Dm) range
of the particles studied. The sheath flow rate was continu-ously corrected using a mass flow controller. All flow rates were regularly checked and sizing accuracy for the SMPS and the CCNc-200 was verified with polystyrene latex (PSL) spheres.
The CCNc-200 was operated at a total flow rate of 1 L min−1, of which 0.5 L min−1 was for column A
con-nected to the DMA to measure the size-resolved CCN spec-trum and another 0.5 L min−1was for column B connected to
the sample inlet system to measure the totalNCCN. A
sheath-to-aerosol flow ratio of 10 was used. Lathem and Nenes (2011) pointed out that the direct measurements could lead to underestimations of bulkNCCNdue to the depletion of
wa-ter inside the column by a large amount of aerosols. In our measurements, the bulkNCCN integrated from size-resolved
CCN measurement using column A are usually fewer than 5000 cm−3and they correlate well with that from the direct
measurement using column B with a slope of 0.97 and cor-relation coefficient (R2) of 0.53 as shown in Fig. S1 in the Supplement. We use bulkNCCN calculated from column A
for the comparison withNCN from SMPS and for the
clo-sure study below. For every meaclo-surement cycle, four SS (0.15, 0.35, 0.50, and 0.70 %) were selected. Measurements at SS=0.15 lasted 22 min whereas those at other SS lasted 12 min each for repeatability. CCNc temperature transients during SS changes are known to produce unreliable spectra if they occur during a voltage up-scan (Moore et al., 2010). In our measurements, the instrument profiles were allowed up to∼2 min to stabilize whenever the temperature gradient was changed. At SS=0.15 %, a longer time (∼4 min) was required for the stabilization of temperatures. Only data col-lected under stabilized temperatures were used for analysis.
The CCNc-200 was calibrated with size selected DMA ammonium sulfate particles at the four SS (Deng et al., 2011; Rose et al., 2008) regularly during the campaign. The instru-ment SS was derived from Köhler theory using a constant van’t Hoff factor of 2.5 for ammonium sulfate (Low, 1969; Tang and Munkelwitz, 1994; Young and Warren, 1992).
2.2.3 Aerosol chemical compositions
Non-refractory PM1 (NR-PM1) constituents of sulfate,
ni-trate, ammonium, chloride, and organics were measured with the AMS operated under V, particle time of flight (pToF), and W modes. The principle behind the instrument has been de-scribed in detail elsewhere (DeCarlo et al., 2006) and will only be briefly described here. In pToF mode, the instrument performs particle sizing based on particle time-of-flight with the aid of a chopper and gives size-resolved chemical compo-sition data in vacuum aerodynamic diameter (Dva) (DeCarlo
less than 5 % of the PM1mass and hence can be neglected
(Huang et al., 2014; Lee et al., 2013). Sea salt and crustal species typically exist in the coarse mode and make negligi-ble contributions to PM1.
2.3 Data analysis 2.3.1 CN and CCN data
The time series of NCN and NCCN distributions were
ob-tained using the TSI Aerosol Instrument Manager (AIM) software (Wang and Flagan, 1990) and CCN acquisition soft-ware, respectively. The data collected during the voltage up-scan were employed for the inversion. The up-scanning mobil-ity CCN analysis (SMCA) was employed for calculating the size-resolved CCN activation fractions (Moore et al., 2010). The ratio of NCCN toNCNgives the size-resolved CCN
ac-tivation fraction at each size. Then, the size-resolved CCN activation ratio was obtained by fitting the activation frac-tion with the sigmoidal funcfrac-tion described by Eq. (1) (see Sect. 3.3) (Moore et al., 2010; Padró et al., 2010).
2.3.2 HR-ToF-AMS data
The standard toolkit of SQUIRREL (Sueper, 2011) was used for AMS data analysis. The collection efficiency (CE) used for this work was 0.5 and the relative ionization efficiency (RIE) of 1.2 for sulfate, 1.1 for nitrate, 1.3 for chloride, 1.4 for organics and 4.0 for ammonium were used as described by Li et al. (2013) and Lee et al. (2013). The size-resolved mass spectra for vacuum aerodynamic diameter (Dva)
rang-ing from 50 to 2000 nm (DeCarlo et al., 2004) were obtained every 5 min on average. The mass concentration of each size bin was obtained by averaging with the two adjacent size bins to reduce the influence of noise (Rose et al., 2011). In or-der to relate the size-resolved AMS data to those of SMPS and CCNc measurements directly, the AMSDvasize was
di-vided by a factor of 1.7 to obtain the corresponding mobility equivalent diameter (Dm) (Cheng et al., 2006; DeCarlo et al.,
2004). The volume fractions of size-resolved and bulk chem-ical compositions were calculated from the mass concentra-tions using densities of organics and inorganics of 1.3 g cm−3
and 1.75 g cm−3, respectively (Alfarra et al., 2006; Cross et
al., 2007; Gunthe et al., 2009; King et al., 2007).
2.3.3 D50,κCCNandκAMS
The critical diameter D50, also known as the activation
di-ameter, is the diameter at which 50 % of the particles are activated at a specific SS. The D50 of a simple sigmoidal
shaped activation ratio curve is determined by fitting the size-resolved activation fractions with the equation below:
NCCN NCN
= B 1+DDp
50
c, (1)
whereDp is the dry mobility diameter, B, c, and D50 are
fitting coefficients that describe the asymptote/plateau, the slope, and the inflection point of the sigmoid, respectively (Moore et al., 2010; Padró et al., 2012). The values of B were more than 90 % during the whole campaign, indicating most of the particles were in the internal mixing state (Mei et al., 2013).
The measured hygroscopic parameter (κCCN) is
deter-mined fromD50by the following equation:
κCCN=
4A3σ3s / a(T ) 27T3D3
50ln2Sc
, (2)
where A=8.69251×10⁻⁶K m3J−1, is the
temperature-dependent surface tension of the solution/air interface,T is temperature, andScis the critical saturation ratio. Pure water
surface tension is assumed in the calculations ofκCCNin this
paper (Petters and Kreidenweis, 2013; Sullivan et al., 2009). The hygroscopic parameter κAMS can be obtained from
AMS measurements using
κAMS=κorg×forg+κinorg×finorg, (3)
whereforg andfinorg are the organics and inorganics
vol-ume fraction derived from AMS measurements (Petters and Kreidenweis, 2007). BulkκAMS(hereafterκAMS_B) and
size-resolved κAMS (hereafter κAMS_SR) are obtained from the
corresponding bulk and size-resolved volume fractions of or-ganics and inoror-ganics, respectively. Also, it was assumed that κinorg=0.6 for the whole campaign,κorg=0.2 for the hazy
period andκorg=0.1 for the foggy and non-episode periods.
The time-series hygroscopicities derived from bulk and size-resolved AMS measurements are shown in Fig. S2 in the Supplement.κAMS_Bwere larger thanκAMS_SRin all four
SS because bulk AMS compositions biased towards the inor-ganics as discussed below. Their difference increases as SS increases because the correspondingD50decreases and these
smaller particles have a larger fraction than the bulk has.
3 Results and discussion 3.1 Overview
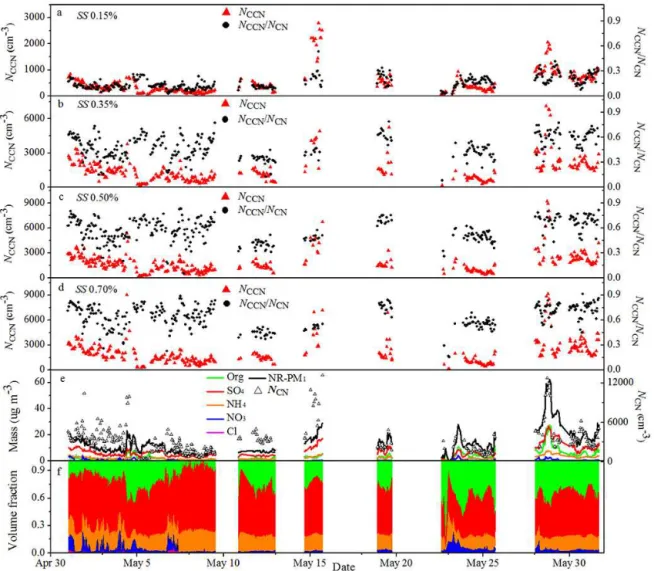
Figure 2 shows an overview of the bulk NCCN
concentra-tions andNCCN/ NCN activation ratio at SS of (a) 0.15 %,
(b) 0.35 %, (c) 0.50 %, and (d) 0.70 %, as well as (e) the bulk NCNand the NR-PM1total and component mass
concentra-tion and (f) the volume fracconcentra-tions of the AMS chemical com-ponents over the entire month of May 2011. Statistics of the measurements are given in Table 1. The gaps in the data in Fig. 2 are due to instrument downtime. For most of the time, the totalNCCNat SS of 0.15, 0.35, 0.50 and 0.70 % were
be-low 800, 3000, 5000 and 5600 cm−3respectively, andN CN
was below 10 000 cm−3. BothN
CCN andNCNin this study
Figure 2.TheNCCNand theNCCN/ NCNratio at SS of(a)0.15 %,(b)0.35 %,(c)0.50 %, and(d)0.70 %;(e)NCNand NR-species mass concentrations from CCNc, SMPS and AMS;(f)NR-species volume fractions derived from AMS.
nearby city in southern China (Rose et al., 2010). The bulk NCCN/ NCNratio was as low as 0.03 at SS=0.15 %, but it
was as high as 0.92 at SS=0.70 %. Even at the same SS, the bulkNCCN,NCNandNCCN/ NCNratio varied greatly during
the campaign.
The bulk mass concentrations of NR-PM1 ranged from
0.8 µg m−3 to 62.4 µg m−3 with a mean value of 14.5±
9.7 µg m−3 as shown in Fig. 2e. The average bulk
vol-ume fractions of NR-species were 53±10 %, 25±13 % , 18±4 %, 4±3 % for sulfate, organics, ammonia, and ni-trate, respectively (Lee et al., 2013). The bulk mass concen-trations for all NR-species were in general low during the campaign compared with those reported for the PRD region (Gong et al., 2012; Rose et al., 2011; Takegawa et al., 2009; Xiao et al., 2011).
There were two periods of particular interest during this campaign: one was a foggy period (15 May) and the other was a hazy period (28–30 May). The division of the month of May in 2011 into foggy, hazy and non-episode periods was
based on differences in meteorology, such as RH, tempera-ture and cloud cover, and mass concentration and the O:C ratio. On average, the foggy period had a high RH (91.1 %), a low temperature (23.3◦C) and a high percentage cloud
cov-erage (89.7 %) and a high liquid water content (LWC) in fine particles (47.5 µg m−3) as shown in Li et al. (2013). The hazy
period had a much lower RH (66.6 %), a higher tempera-ture (26.2◦C) and a much lower percentage cloud coverage
(43.3 %) and LWC (17.5 µg m−3). The slowing surface winds and the establishment of a well-defined land-sea breeze with a gradual daily reversal of wind direction contributed to the accumulation of local and regional pollutants coming from the PRD due to the persistent northerly and northwesterly air masses (Lee et al., 2013).
During the foggy period, the bulk NR-PM1 was as high
as 30 µg m−3(Fig. 2e; Li et al., 2013). The hazy period was
much less humid and it saw the highest mass concentration of NR-PM1species recorded during the whole campaign. It
Table 1.Statistics of the bulkNCCN(cm−3) at four SS (%) showing the minimum, maximum, mean number concentration, theNCCN/ NCN ratio, and standard deviation (SD). The last column shows the number of data sets (n)in this campaign.
SS (%) Max Min Mean±SD n
NCCN(cm−3) NCCN/ NCN NCCN(cm−3) NCCN/ NCN NCCN(cm−3) NCCN/ NCN 0.15 2815 0.54 33 0.03 512±452 0.16±0.08 319 0.35 8055 0.78 186 0.08 1546±1137 0.48±0.14 316 0.50 9156 0.82 210 0.12 1815±1285 0.57±0.14 326 0.70 9268 0.92 280 0.16 2082±1484 0.65±0.14 320
Table 2. The average size-resolved mass concentrations (µg m−3, Conc.) and volume fractions (f) of chemical compositions from size-resolved AMS measurements during the foggy, hazy and the non-episode periods. Conc. andf were obtained by integrating over the size range (Dm) from 42 to 1200 nm for Fig. 3 a–c and from 42 to 200 nm for Fig. 3 d–f. Data are shown as mean±standard deviations.
Period Organics Sulfate Ammonium Nitrate Chloride
Conc. f Conc. f Conc. f Conc. f Conc. f
Foggy 1.60±1.10 0.39±0.12 4.86±3.51 0.45±0.10 1.33±0.98 0.14±0.04 0.18±0.12 0.03±0.00 0.03±0.02 0.001±0.00 Hazy 4.25±2.52 0.57±0.08 5.96±4.36 0.29±0.06 1.71±1.22 0.08±0.03 0.51±0.27 0.06±0.01 0.02±0.01 0.002±0.00 The rest 1.19±0.71 0.47±0.11 2.65±1.86 0.37±0.08 0.81±0.55 0.12±0.03 0.25±0.15 0.04±0.00 0.02±0.01 0.002±0.00
O : C ratio of 0.51 (Li et al., 2013). During the hazy pe-riod, the mean bulkNCCNranged from 1100 cm−3with bulk NCCN/ NCNof 0.22 at SS=0.15 % to 5300 cm−3with bulk NCCN/ NCNof 0.72 at SS=0.70 %. During non-episode
pe-riods, the mean bulkNCCNranged from 300 cm−3with bulk NCCN/ NCNof 0.14 at SS=0.15 % to 2700 cm−3with bulk NCCN/ NCNof 0.61 at SS=0.70 %.
3.2 f,κCCNandκAMS
The average size-resolved mass distributions and volume fractions (f ) of NR-PM1 calculated from AMS
measure-ments are shown in Fig. 3a–c and d–f, respectively, for the foggy period, the hazy period, and the non-episode periods. The NR-PM1showed a major mode at the dry particle size
(Dm, hereafter, diameters shown areDm) of∼285 nm in the
foggy period, at∼355 nm in the hazy period and at∼325 nm in the non-episode periods. Sulfate and organics accounted for large mass fractions (78 % in total) during the whole cam-paign as shown in Table 2. Sulfate dominated in the foggy pe-riod, contributing to a volume fraction of 0.45 for 42–200 nm particles. Organics and nitrate often had a shoulder at a small size mode at 100 to 130 nm. This shoulder was obvious in the hazy period and non-episode periods but not so in the foggy period. On average, this smaller mode accounted for 11 and 12 % of organics and nitrate, respectively. On the other hand, only 2 % of sulfate was found in this mode (Lee et al., 2013). Figure 3d–f show the average size-resolved volume frac-tion distribufrac-tions of the AMS aerosol composifrac-tions from 42 to 200 nm in the foggy period, the hazy period and the non-episode periods. The volume fraction of organics decreased, while the inorganics increased with particle size. Overall, the size-resolved volume fractions of organics ranged from 0.73
at 42 to 0.25 at 200 nm. Additionally, the bulk volume ratio of organics to inorganics between 42 and 200 nm was 0.65 in the foggy period, 1.33 in the hazy period, and 0.87 in the non-episode periods.
The measuredκCCN (yellow symbols) and the calculated κAMS_SR (blue symbols), in the form of median values and
interquartile ranges, are plotted against their corresponding D50in Fig. 3d–f. The median and mean values ofκCCN and κAMS_SRwere essentially the same. Overall, the medianD50
were 116, 68, 55, and 47 nm, with an interquartile range of less than 16 %, at SS of 0.15, 0.35, 0.50, and 0.70 %, respec-tively. During the foggy period, which featured high inor-ganics volume fractions, the medianκCCN were 0.44, 0.37,
0.36 and 0.29 at SS from 0.15 % to 0.70 %. They are higher than the corresponding values in the hazy period (0.38, 0.36, 0.32 and 0.28) and the non-episode periods (0.39, 0.37, 0.33 and 0.27). The difference inκCCNin these periods was most obvious at SS=0.15 %, at whichD50 was around 110 nm,
and the corresponding inorganic volume fraction was 0.6 in foggy period, 0.4 in the hazy period and 0.5 in the non-episode period. The high inorganic volume fraction results in high aerosol hygroscopicity.
TheκAMS_SRcalculated from Eq. (3) assumingκorg=0.1
andκinorg=0.6 agreed well with the measuredκCCN in the
foggy period and the non-episode periods as shown in Fig. 3d and f. In the hazy period (Fig. 3e), assuming κorg=0.2
andκinorg=0.6 gave better agreement betweenκAMS_SRand κCCN. The hazy period had a higher O:C ratio of 0.51,
Table 3.Methods used inNCCNprediction based on the individual CCN scan and averageD50over whole period from AMS measurement.
Methods Mixing state Chemical composition κAMS D50
I Internal Bulk AMS measurements κAMS=0.1×forg+ 0.6×finorg Individual II Internal Bulk AMS measurements as above Average III Internal Size-resolved AMS measurements as above Individual IV Internal Size-resolved AMS measurements as above Average V Internal N/A 0.35/0.33/0.30 Constants
Figure 3.Size-resolved mass concentration distributions of aerosol chemical composition derived from AMS averaged over(a)the foggy period,(b)the hazy period, and(c)the non-episode periods; the corresponding size-resolved volume fractions of aerosol chemical compo-sitions (colored areas), the observedκCCN(yellow) and the calculatedκAMS_SR(blue) during(d)the foggy period,(e)the hazy period and (g)the non-episode period. Data points median values and interquartile ranges.κinorg=0.6 in all cases,κorg=0.1 in (d) and(f),κorg=0.2 in(e).
al., 2011; Massoli et al., 2010; Mei et al., 2013; Moore et al., 2012b).
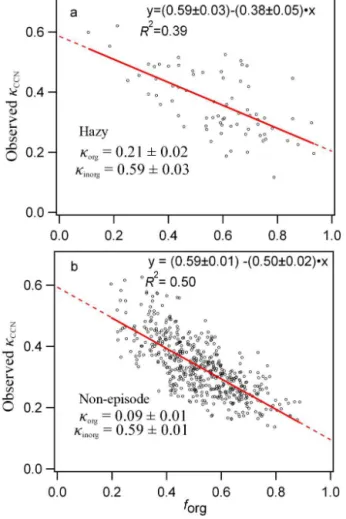
We further examine the correlations between the observed κCCNand the size-resolved organic volume fraction (forg) in
Fig. 4a for the hazy period and Fig. 4b for the rest of the cam-paign. In order to avoid low signal-to-noise ratios of AMS measurements on the correlation study, only data points with mass concentrations in a size bin of larger than 0.6 µg m−3
were used. Extrapolation of the least square fit line in Fig. 4a and b toforg=1 yieldsκorg=0.21±0.02 and 0.09±0.01
for the organic fraction and extrapolation toforg=0 yields κinorg=0.59±0.03 and 0.59±0.01 for the inorganic
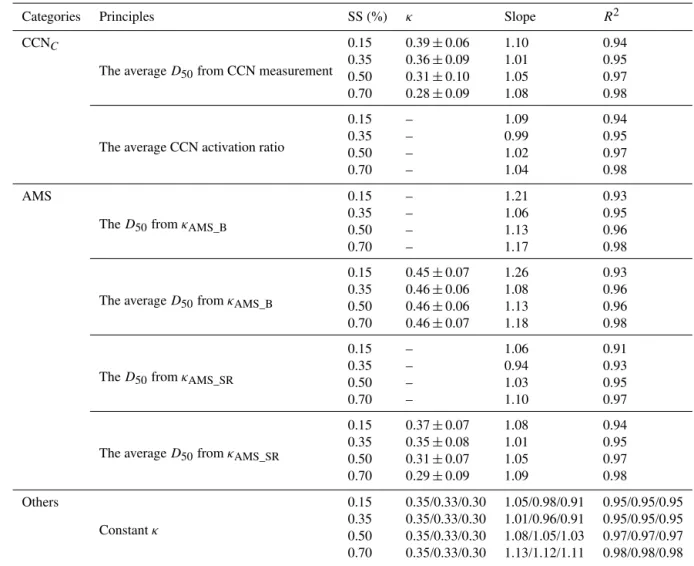
Table 4.Overview ofNCCNpredictions,κfromD50based on CCN measurement and derived from equation 3 based on AMS measurement are shown as mean±standard deviation, slope andR2are from the least square fit between the calculatedNCCNand measured ones.
Categories Principles SS (%) κ Slope R2
CCNC
The averageD50from CCN measurement
0.15 0.39±0.06 1.10 0.94 0.35 0.36±0.09 1.01 0.95 0.50 0.31±0.10 1.05 0.97 0.70 0.28±0.09 1.08 0.98
The average CCN activation ratio
0.15 – 1.09 0.94
0.35 – 0.99 0.95
0.50 – 1.02 0.97
0.70 – 1.04 0.98
AMS
TheD50fromκAMS_B
0.15 – 1.21 0.93
0.35 – 1.06 0.95
0.50 – 1.13 0.96
0.70 – 1.17 0.98
The averageD50fromκAMS_B
0.15 0.45±0.07 1.26 0.93 0.35 0.46±0.06 1.08 0.96 0.50 0.46±0.06 1.13 0.96 0.70 0.46±0.07 1.18 0.98
TheD50fromκAMS_SR
0.15 – 1.06 0.91
0.35 – 0.94 0.93
0.50 – 1.03 0.95
0.70 – 1.10 0.97
The averageD50fromκAMS_SR
0.15 0.37±0.07 1.08 0.94 0.35 0.35±0.08 1.01 0.95 0.50 0.31±0.07 1.05 0.97 0.70 0.29±0.09 1.09 0.98
Others
Constantκ
0.15 0.35/0.33/0.30 1.05/0.98/0.91 0.95/0.95/0.95 0.35 0.35/0.33/0.30 1.01/0.96/0.91 0.95/0.95/0.95 0.50 0.35/0.33/0.30 1.08/1.05/1.03 0.97/0.97/0.97 0.70 0.35/0.33/0.30 1.13/1.12/1.11 0.98/0.98/0.98
Beijing and the Gulf of Mexico (Gunthe et al., 2011; Moore et al., 2012b). The average organic hygroscopicity is within the typical range for individual organic species from zero for insoluble organics to 0.3 for soluble organics (Hersey et al., 2011; Lambe et al., 2011; Petters and Kreidenweis, 2007). κAMS_SR correlates reasonably well withκCCN, withR2of 0.51, as shown in Fig. S3 in the Supplement.
On the other hand, the mean value ofκAMS_Bderived from
bulk AMS compositions was 0.45 at SS=0.15 % and 0.46 for the other SS, which are significantly larger than the mea-sured κCCN ranging from 0.39 to 0.28 for SS of 0.15 % to
0.7 % as shown in Table 4. Size-resolved AMS measure-ments are needed to accurately determine the hygroscopicity parameter and predictNCCN(Cubison et al., 2008; Moore et
al., 2012a). For closure analysis below, we useκorg=0.1 and κinorg=0.6.
3.3 CCN closure study
The closure studies on NCCN prediction were carried out
based on the measured size-resolvedNCNdistributions and
the AMS measurements. In the first approach, we assumed internal mixing and usedκAMSfrom (i) bulk and (ii) the
size-resolved AMS measurements for each data set using Eq. (3), and (iii) assumed constantκvalues. The corresponding indi-vidualD50 was then calculated from theseκestimates using
Eq. (2), based on whichNCCN was predicted. Furthermore,
we also used the averageD50 over the whole campaign in NCCN prediction. Table 3 summarizes the assumptions and
parameters used in these methods. In these casesNCCNwas
calculated by integrating the measured size-resolved NCN
distributions for particles larger thanD50. The aim of using
the averageD50 was to test how well it represented the
Figure 4.Correlations between the observedκCCNand the organic volume fraction (forg) determined by size-resolved AMS measure-ments for the(a)hazy period (n=72) and(b)the non-episode pe-riod (n=516). The red line is the linear least squares fit (pvalue <0.01).
comparing theNCCNusing the averageD50with an internal
mixing assumption and the size-resolved CCN activation ra-tios from CCN measurements which reflect the actual mixing state of the aerosols. The last approach involved integrating the product of the measured size-distribution ofNCNand the
size-resolved CCN activation ratio in each particle size bin.
3.3.1 Prediction ofNCCNbased onκAMS
κAMSfrom bulk AMS measurements
The hygroscopicityκAMS_Bwas estimated by assuming that
all particles have the same chemical composition as de-termined by bulk AMS measurements and κorg=0.1 and κinorg=0.6. The closure results are shown in Fig. 5(i) a–h
and Table 4. Overall, the approaches of using individualD50
and the averageD50 grossly over-predictedNCCN by up to
21 and 26 %, respectively. As shown in Fig. 3a–c, PM1was
dominated by inorganic species with the bulk volume
frac-tion as high as 69 % during the whole period. The bulk vol-ume ratio mainly reflects the composition of particles from 200 to 500 nm where inorganic species dominated. On the other hand,D50 at the four SS were all less than 200 nm
where organic species accounted for more than 39 % of bulk volume fraction as shown in Table 2 and Fig. 3. Therefore, derivingκAMSfrom bulk AMS measurements leads to a
pos-itive bias toward inorganic species, and hence an overesti-mation ofκAMS_BandNCCN. Wang et al. (2010) found that
the overestimation arising from the use of the bulk mass con-centrations decreased from 80 to 39 % when SS decreased from 0.35 to 0.11 %. Our data also shows decreasing over-estimation as SS decreases, except for data at SS=0.15 %, where theNCCN was smaller than 1000 cm−3 most of the
time. The low counts may have introduced larger uncertainty in the measurements as shown in the Supplement.
κAMSfrom size-resolved AMS measurements
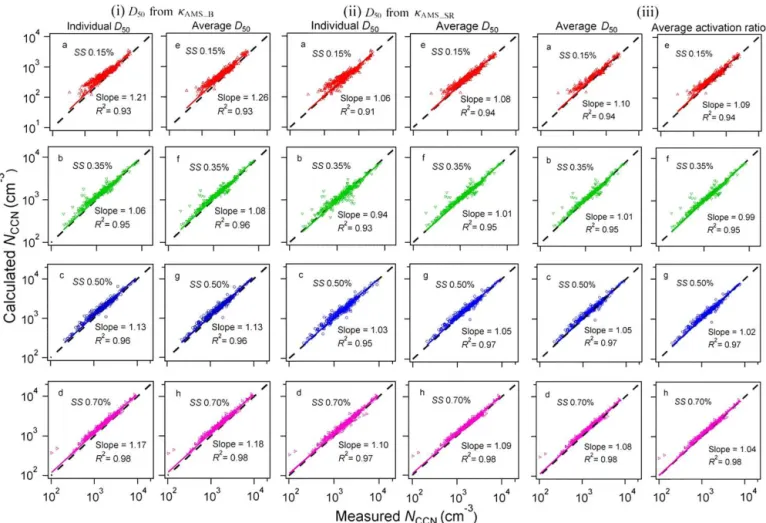
Figure 5(ii) a–d and e–h show the correlations between the measuredNCCN and the NCCN predicted from the
individ-ualD50 of each data set and the averagedD50 derived from κAMS_SR, respectively. The slope andR2are given in Table 4.
In general, the NCCN prediction deviated by 10 % or less
for both approaches, a substantial improvement compared to those usingκAMS_B, and the averageD50adequately reflects
the aerosol activation properties. At SS=0.70 %, individual D50and the averageD50gave the close deviations of 10 and
9 % respectively between the measured and predictedNCCN.
At high SS, where even particles of moderate hygroscopic-ity are activated (Kim et al., 2011), theNCCN prediction is
less sensitive to hygroscopicity than at low SS. The differ-ence of the deviations increased as SS decreased from 0.70 to 0.35 %. At lower SS, differences in hygroscopicity as re-flected from the differentD50 used in the calculations gave
larger differences inNCCNpredictions.
The overestimation from using the averageD50decreased
from 9 % at SS of 0.70 % (D50=46 nm) to 5 and 1 % at SS
of 0.50 % (D50=56 nm) and 0.35 % (D50=67 nm),
respec-tively. The fraction of non/less-hygroscopic hydrocarbon-like organic aerosol (HOA) decreased with increasing par-ticle size (Lee et al., 2013). It contributes little toNCCN by
itself but the assumption of internal mixing allows it to con-tribute to CCN due to its mixing with more hygroscopic species and leads to an overestimated NCCN (Rose et al.,
2011; Wang et al., 2010). Size-resolved EC was not available and EC might also have caused the overestimation inNCCN prediction. When SS decreased,D50 increased and the
im-pact of HOAs on theNCCNpredictions decreased because of
its smaller abundance relative to the hygroscopic inorganics. The large deviation inNCCN prediction at SS=0.15 % may
be due to the uncertainty in the low number counts of CCN measurements or the high sensitivity ofNCCNto
Figure 5.Calculations ofNCCNbased on (i)(a–d)the individualD50and(e–h)the averageD50over the whole period fromκAMS_B, (ii) (a–d)the individualD50and(e–h)the averageD50over the whole period fromκAMS_SRand (iii)(a–d)the averageD50and(e–h)the average size-resolved CCN activation ratio from CCN measurement over the whole period.
3.3.2 Prediction ofNCCNfrom the constantκ
A constantκ=0.30 has been proposed for predictingNCCN
and understanding the indirect effects of continental aerosols on climate on a global modeling scale (Andreae and Rosen-feld, 2008; Pringle et al., 2010). Rose et al. (2011) showed that the deviations between the measured and predicted NCCN were less than 20 % when they used an averaged κ=0.30 over the course of their campaign in PRD in 2006. We evaluated the use of constantκ=0.30, 0.33 (the average κAMS_SRover the campaign at the four SS), and 0.35 to
esti-mateNCCN. Overall, usingκ=0.35 overestimatedNCCN at
all four SS while using 0.33 and 0.30 underestimated it at low SS≤0.35 % and overestimated it at high SS≥0.50 %, respectively, as shown in Fig. S4 in the Supplement and Ta-ble 4. The slopes forκ=0.30, 0.33 and 0.35 are quite differ-ent (0.91, 0.98 and 1.05) at SS=0.15 %, while they are much closer (1.11, 1.12 and 1.13) at SS=0.70 %. The difference inNCCNprediction for the threeκdecreased gradually from
14 % at SS=0.15 % to 2 % at SS=0.70 %. These results fur-ther confirm that the prediction ofNCCN is less sensitive to
κ at high SS than at low one, and that the impact of hygro-scopicity on theNCCN prediction decreases with increasing
SS.
The difference in the sensitivity of predictedNCCNto
hy-groscopicity at different SS can also be attributed to the aerosol size distributions (Dusek et al., 2006; Ervens et al., 2007). The average aerosol size distribution over the whole period had a main mode at∼70 nm and a shoulder at∼30 nm (Fig. 6a) in this campaign. At SS=0.15 %,D50
is approximately 116 nm and on the right of the main mode (Fig. 6b), a slight variation ofκ andD50 will cause a large
change inNCCNprediction. On the contrary, at SS=0.70 %,
the corresponding D50=46 nm is on the left of the main
mode (Fig. 6c), a variation ofκandD50will have less impact
onNCCN prediction as theNCCN is dominated by the mode
at 70 nm.
In addition, we carried out theNCCNprediction during the
Figure 6.The average aerosol size distribution over the whole pe-riod(a),NCCNprediction based onD50 at SS of 0.15 %(b)and 0.70 %(c). Data points are mean values and standard deviation.
and (2) κAMS=0.35 over the hazy period only. As shown in Fig. S5 in the Supplement, using κAMS=0.33 and 0.35
gave similar results with overestimations of 14 and 13 % at SS=0.70 % respectively. In the hazy period, the assumption of internal mixing state allowed HOA-containing particles to act as CCN, thereby resulting in an overestimation ofNCCN
by up to 14 %. At SS=0.15 %, usingκ=0.33 led to an over-estimation of just 2 %, while an overover-estimation of 9 % was found when usingκ=0.35. Overall, usingκ=0.33 gave
pre-dictions ofNCCN (Table 4) comparable to those using the κAMS_SRand better than those usingκAMS_Bat all four SS.
3.3.3 Mixing state and hygroscopicity
As discussed earlier, closure analysis based on hygroscop-icity orD50 derived from chemical compositions assuming
internal mixing alone cannot account for variability in the mixing state of aerosols, which could cause significant differ-ences between predicted and measuredNCCN. In this section,
we first calculate NCCN by integrating the measured
size-resolvedNCNdistributions above the averageD50, obtained
from the average CCN size-resolved activation ratio over the whole campaign. The second method involves integrating the product of the measured size distribution ofNCNand the
av-erage size-resolvedNCCN/ NCNactivation ratio in each
par-ticle size bin. The size-resolvedNCCN/ NCN activation ra-tios reflect the influences of both the size-resolved chemical compositions and mixing state on CCN activity, and thus be used to examine the relative importance of mixing state and hygroscopicity in closure analysis compared to predictions assuming internal mixing state (Deng et al., 2013). The first method involves the hygroscopicity of aerosols as reflected by the value ofD50 and the assumption of internal mixing
while the second method involves hygroscopicity with actual mixing state information imbedded in the measured activa-tion ratio curves. A comparison of the predicactiva-tions of these two methods would give hints to the role of assumption of mixing states. SinceD50 was obtained from the sigmoidal
fits, those fits instead of actual data points were also used in the second method for better comparison. The average size-resolved CCN activation ratios at the four SS over the whole campaign are shown in Fig. S6 in the Supplement. Data points are shown as means±standard deviations.
The correlations of measured and predictedNCCN based
on the averageD50(a–d) and the average size-resolved
acti-vation ratio (e–h) are shown in Fig. 5(iii) a–d and e–h. The slopes of the fitted lines andR2 at different SS are given in Table 4. The predicted and the measuredNCCN differed
by less than 10 % using the averageD50. The difference is
comparable to those using the averageD50 from κAMS_SR
(Fig. 5(ii) e–h). At SS=0.70 %, using the average size-resolved CCN activation ratios reduced the overestimation from 8 % when using the averageD50 to 4 %. As discussed
above, the sensitivity of theNCCN prediction to
hygroscop-icity is low at SS=0.70 %, where a large change of 25 % in hygroscopicity from 0.28 to 0.35 result in only a varia-tion within 5 % inNCCN(Table 4). From the AMS
measure-ments, the portion of non/less-hygroscopic species inferred by the fractions off43andf57increased as the particle size
decreased (Lee et al., 2013). Because of their higher abun-dance, their mixing with the hygroscopic components has a higher impact at SS=0.70 % (D50=46 nm) than that at
low SS=0.15 % (D50=116 nm), where the reduction in
Figure 7.The average size-resolved CCN activation ratio at SS of (a)0.15 % and(b)0.70 % during the hazy, foggy and non-episode periods.
averageD50 to 9 % when using the average activation ratios
approach. On the contrary, a difference of 19 % was found when hygroscopicity increased from 0.30 to 0.39 at this low SS.
The average size-resolved activation ratios during the hazy, foggy and non-episode periods at SS=0.15 and 0.7 % are shown in Fig. 7. At SS=0.15 %, the activation ratios dur-ing the hazy and non-episode periods are similar but it is higher during the foggy period due possibly to the higher volume fraction of inorganics (Fig. 3d–f) and the smaller amount of non/less hygroscopic organics (Li et al., 2013). At SS=0.70 %, the CCN activation ratios of particles rang-ing from 50 to 100 nm in size are lower in the hazy period than in the non-episode period. The difference in the trends at SS=0.15 and 0.70 % may be due to the larger fractions of non/less hygroscopic species in smaller particles in the hazy period. These particles, which constitute a larger frac-tion of OAs in the hazy period than in the other periods, likely formed external mixtures with particles containing the aged particles of sulfate and the more oxidized (and hygroscopic) organics. Hence, a larger difference in the activation ratios
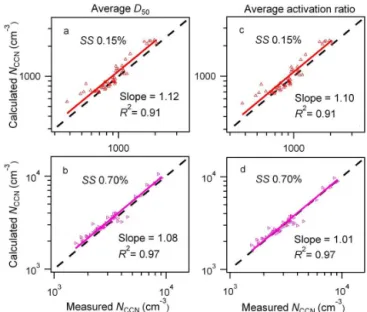
Figure 8.NCCNestimation in hazy period based on (aandb) the averageD50and (candd) the average size-resolved CCN activation ratio from CCN measurement over the hazy period.
between the hazy and the other periods could be observed at SS=0.70 % than at SS=0.15 %.
Figure 8 shows theNCCNpredicted based on the average D50and the average size-resolved CCN activation ratio over
the hazy period. At SS=0.15 %, using the average CCN ac-tivation ratio reduces overestimation from 12 % when using averageD50to 10 %. However, a much larger reduction from
8 to 1 % was found at SS=0.70 %. This comparison supports thatNCCNprediction is likely more sensitive to mixing state
than to hygroscopicity at high SS and vice versa at low SS.
4 Conclusion
In this study, a DMT CCNc-200 forNCCN measurement, a
TSI SMPS forNCNmeasurement, and an Aerodyne
HR-ToF-AMS for size-resolved and bulk PM1chemical composition
measurement were used to investigate the size-resolved CCN activity at a coastal site in Hong Kong in May 2011. Closure studies were carried out based on theκAMSestimated from
bulk and size-resolved AMS measurement assuming inter-nal mixing state. The deviation ofNCCNpredicted from the
individualD50 obtained fromκAMSwas similar to that
pre-dicted from the averageD50 over the whole period at the
four SS, which indicates that the average D50 well
repre-sented the aerosol CCN activation properties in this study. UsingκAMS_B grossly over-predicted NCCN by up to 26 %
because of the positive bias toward the inorganic fraction. On the contrary, theNCCN predictions based on κAMS_SR were
We compared the sensitivity of the NCCN prediction to
hygroscopicity (based on assumed internal mixing and κ estimates) and mixing state at different SS. NCCN appears
to be more sensitive to hygroscopicity than to mixing state at SS=0.15 %, but the reverse is true at SS=0.70 %. At SS=0.15 %,D50(116 nm) is larger than the mode diameter
of the typical aerosol distributions we observed. A slight vari-ation inκ(andD50)would have a larger effect onNCCN
pre-diction than would at high SS=0.70 %, whereD50(46 nm)
is smaller than the mode diameter. The effect of mixing state is larger at SS=0.70 %, which is associated with smaller particles having a higher percentage of non/less-hygroscopic components, than at SS=0.15 %. Hygroscopicity is rela-tively less important toNCCNprediction at this high SS.
The Supplement related to this article is available online at doi:10.5194/acp-14-10267-2014-supplement.
Acknowledgements. This work was supported by the University Grants Committee (Special Equipment Grant, SEG-HKUST07), Research Grants Council (GRF 600413) and the Environmental Conservation Funds (ECF) of Hong Kong (project number: ECWW09EG04).
Edited by: H. Su
References
Alfarra, M. R., Paulsen, D., Gysel, M., Garforth, A. A., Dommen, J., Prévôt, A. S., Worsnop, D. R., Baltensperger, U., and Coe, H.: A mass spectrometric study of secondary organic aerosols formed from the photooxidation of anthropogenic and biogenic precursors in a reaction chamber, Atmos. Chem. Phys., 6, 5279– 5293, doi:10.5194/acp-6-5279-2006, 2006.
Andreae, M. O. and Rosenfeld, D.: Aerosol-cloud-precipitation interactions. Part 1. The nature and sources of cloud-active aerosols, Earth-Sci. Rev., 89, 13–41, 2008.
Asa-Awuku, A., Nenes, A., Gao, S., Flagan, R. C., and Seinfeld, J. H.: Water-soluble SOA from Alkene ozonolysis: composition and droplet activation kinetics inferences from analysis of CCN activity, Atmos. Chem. Phys., 10, 1585–1597, doi:10.5194/acp-10-1585-2010, 2010.
Asa-Awuku, A., Moore, R. H., Nenes, A., Bahreini, R., Holloway, J. S., Brock, C. A., Middlebrook, A. M., Ryerson, T. B., Jimenez, J. L., and DeCarlo, P. F.: Airborne cloud condensation nuclei mea-surements during the 2006 Texas Air Quality Study, J. Geophys. Res.-Atmos., 116, D11201, doi:10.1029/2010jd014874, 2011. Bougiatioti, A., Fountoukis, C., Kalivitis, N., Pandis, S., Nenes, A.,
and Mihalopoulos, N.: Cloud condensation nuclei measurements in the marine boundary layer of the Eastern Mediterranean: CCN closure and droplet growth kinetics, Atmos. Chem. Phys., 9, 7053–7066, doi:10.5194/acp-9-7053-2009, 2009.
Chan, C. K. and Yao, X.: Air pollution in mega cities in China, Atmos. Environ., 42, 1–42, 2008.
Chang, R. Y.-W., Slowik, J. G, Shantz, N. C., Vlasenko, A., Liggio, J., Sjostedt, S. J., Leaitch, W. R., and Abbatt, J. P. D.: The hy-groscopicity parameter (κ) of ambient organic aerosol at a field site subject to biogenic and anthropogenic influences: relation-ship to degree of aerosol oxidation, Atmos. Chem. Phys., 10, 5047–5064, doi:10.5194/acp-10-5047-2010, 2010.
Cheng, Y. F., Eichler, H., Wiedensohler, A., Heintzenberg, J., Zhang, Y. H., Hu, M., Herrmann, H., Zeng, L. M., Liu, S., and Gnauk, T.: Mixing state of elemental carbon and non-light-absorbing aerosol components derived from in situ particle opti-cal properties at Xinken in Pearl River Delta of China, J. Geo-phys. Res.-Atmos., 111, D20204, doi:10.1029/2005jd006929, 2006.
Cross, E. S., Slowik, J. G., Davidovits, P., Allan, J. D., Worsnop, D. R., Jayne, J. T., Lewis, D. K., Canagaratna, M., and Onasch, T. B.: Laboratory and ambient particle density determinations using light scattering in conjunction with aerosol mass spectrometry, Aerosol Sci. Tech., 41, 343–359, 2007.
Cubison, M. J., Ervens, B., Feingold, G., Docherty, K. S., Ulbrich, I. M., Shields, L., Prather, K., Hering, S., and Jimenez, J. L.: The influence of chemical composition and mixing state of Los Angeles urban aerosol on CCN number and cloud properties, At-mos. Chem. Phys., 8, 5649–5667, doi:10.5194/acp-8-5649-2008, 2008.
DeCarlo, P. F., Slowik, J. G., Worsnop, D. R., Davidovits, P., and Jimenez, J. L.: Particle morphology and density characterization by combined mobility and aerodynamic diameter measurements. Part 1: Theory, Aerosol Sci. Tech., 38, 1185–1205, 2004. DeCarlo, P. F., Kimmel, J. R., Trimborn, A., Northway, M. J., Jayne,
J. T., Aiken, A. C., Gonin, M., Fuhrer, K., Horvath, T., Docherty, K. S., Worsnop, D. R., and Jimenez, J. L.: Field-deployable, high-resolution, time-of-flight aerosol mass spectrometer, Anal. Chem., 78, 8281–8289, 2006.
Deng, Z. Z., Zhao, C. S., Ma, N., Liu, P. F., Ran, L., Xu, W. Y, Chen, J., Liang, Z., Liang, S., Huang, M. Y., Ma, X. C., Zhang, Q., Quan, J. N., Yan, P., Henning, S., Mildenberger, K., Sommerhage, E., Schäfer, M., Stratmann, F., and Wiedensohler, A.: Size-resolved and bulk activation properties of aerosols in the North China Plain, Atmos. Chem. Phys., 11, 3835–3846, doi:10.5194/acp-11-3835-2011, 2011.
Deng, Z. Z., Zhao, C. S., Ma, N., Ran, L., Zhou, G. Q., Lu, D. R., and Zhou, X. J.: An examination of parameterizations for the CCN number concentration based on in situ measurements of aerosol activation properties in the North China Plain, At-mos. Chem. Phys., 13, 6227–6237, doi:10.5194/acp-13-6227-2013, 2013.
Dusek, U., Frank, G. P., Hildebrandt, L., Curtius, J., Schneider, J., Walter, S., Chand, D., Drewnick, F., Hings, S., Jung, D., Bor-rmann. S., and Andreae, M. O.: Size matters more than chem-istry for cloud-nucleating ability of aerosol particles, Science, 312, 1375–1378, 2006.
Ervens, B., Cubison, M., Andrews, E., Feingold, G., Ogren, J., Jimenez, J., Quinn, P., Bates, T., Wang, J., and Zhang, Q.: CCN predictions using simplified assumptions of organic aerosol com-position and mixing state: a synthesis from six different loca-tions, Atmos. Chem. Phys., 10, 4795–4807, doi:10.5194/acp-10-4795-2010, 2010.
Coe, H., Flynn, M., and Allan, J. D.: Prediction of cloud con-densation nucleus number concentration using measurements of aerosol size distributions and composition and light scattering enhancement due to humidity, J. Geophys. Res., 112, D10S32, doi:10.1029/2006JD007426, 2007.
Gong, Z., Lan, Z., Xue, L., Zeng, L., He, L., and Huang, X.: Char-acterization of submicron aerosols in the urban outflow of the central Pearl River Delta region of China, Front. Environ. Sci. Eng., 6, 725–733, 2012.
Gunthe, S. S., King, S. M., Rose, D., Chen, Q., Roldin, P., Farmer, D. K., Jimenez, J. L., Artaxo, P., Andreae, M. O., Martin, S. T., and Pöschl, U.: Cloud condensation nuclei in pristine tropi-cal rainforest air of Amazonia: size-resolved measurements and modeling of atmospheric aerosol composition and CCN activity, Atmos. Chem. Phys., 9, 7551–7575, doi:10.5194/acp-9-7551-2009, 2009.
Gunthe, S. S., Rose, D., Su, H., Garland, R. M., Achtert, P., Nowak, A., Wiedensohler, A., Kuwata, M., Takegawa, N., Kondo, Y., Hu, M., Shao, M., Zhu, T., Andreae, M. O., and Pöschl, U.: Cloud condensation nuclei (CCN) from fresh and aged air pollution in the megacity region of Beijing, Atmos. Chem. Phys., 11, 11023– 11039, doi:10.5194/acp-11-11023-2011, 2011.
Hersey, S. P., Craven, J. S., Schilling, K. A., Metcalf, A. R., Sorooshian, A., Chan, M. N., Flagan, R. C., and Seinfeld, J. H.: The Pasadena Aerosol Characterization Observatory (PACO): chemical and physical analysis of the Western Los Angeles basin aerosol, Atmos. Chem. Phys., 11, 7417–7443, doi:10.5194/acp-11-7417-2011, 2011.
Huang, X. H., Bian, Q., Ng, W. M., Louie, P. K., and Yu, J. Z.: Characterization of PM2.5Major Components and Source Inves-tigation in Suburban Hong Kong: A One Year Monitoring Study, Aerosol Air Qual. Res., 14, 237–250, 2014.
Kammermann, L., Gysel, M., Weingartner, E., Herich, H., Cziczo, D. J., Holst, T., Svenningsson, B., Arneth, A., and Baltensperger, U.: Subarctic atmospheric aerosol composition: 3. Measured and modeled properties of cloud condensation nuclei, J. Geophys. Res., 115, D04202, doi:10.1029/2009JD012447, 2010.
Kerminen, V.-M., Paramonov, M., Anttila, T., Riipinen, I., Foun-toukis, C., Korhonen, H., Asmi, E., Laakso, L., Lihavainen, H., and Swietlicki, E.: Cloud condensation nuclei production asso-ciated with atmospheric nucleation: a synthesis based on exist-ing literature and new results, Atmos. Chem. Phys., 12, 12037– 12059, doi:10.5194/acp-12-12037-2012, 2012.
Kim, J. H., Yum, S. S., Shim, S., Yoon, S.-C., Hudson, J. G., Park, J., and Lee, S.-J.: On aerosol hygroscopicity, cloud con-densation nuclei (CCN) spectra and critical supersaturation mea-sured at two remote islands of Korea between 2006 and 2009, Atmos. Chem. Phys., 11, 12627–12645, doi:10.5194/acp-11-12627-2011, 2011.
King, S. M., Rosenoern, T., Shilling, J. E., Chen, Q., and Martin, S. T.: Cloud condensation nucleus activity of secondary organic aerosol particles mixed with sulfate, Geophys. Res. Lett., 34, L24806, doi:10.1029/2007GL030390, 2007.
Lambe, A. T., Onasch, T. B., Massoli, P., Croasdale, D. R., Wright, J. P., Ahern, A. T., Williams, L. R., Worsnop, D. R., Brune, W. H., and Davidovits, P.: Laboratory studies of the chemical composi-tion and cloud condensacomposi-tion nuclei (CCN) activity of secondary organic aerosol (SOA) and oxidized primary organic aerosol
(OPOA), Atmos. Chem. Phys., 11, 8913–8928, doi:10.5194/acp-11-8913-2011, 2011.
Lance, S., Nenes, A., Mazzoleni, C., Dubey, M. K., Gates, H., Varutbangkul, V., Rissman, T. A., Murphy, S. M., Sorooshian, A., and Flagan, R. C.: Cloud condensation nuclei activity, closure, and droplet growth kinetics of Houston aerosol dur-ing the Gulf of Mexico Atmospheric Composition and Cli-mate Study (GoMACCS), J. Geophys. Res., 114, D00F15, doi:10.1029/2008JD011699, 2009.
Lance, S., Nenes, A., Medina, J., and Smith, J. N.: Mapping the operation of the DMT continuous flow CCN counter, Aerosol Sci. Tech., 40, 242–254, 2006.
Lathem, T. L., Beyersdorf, A. J., Thornhill, K. L., Winstead, E. L., Cubison, M. J., Hecobian, A., Jimenez, J. L., Weber, R. J., An-derson, B. E., and Nenes, A.: Analysis of CCN activity of Arc-tic aerosol and Canadian biomass burning during summer 2008, Atmos. Chem. Phys., 13, 2735–2756, doi:10.5194/acp-13-2735-2013, 2013.
Lathem, T. L. and Nenes, A.: Water vapor depletion in the DMT continuous-flow CCN chamber: Effects on supersaturation and droplet growth, Aerosol Sci. Tech., 45, 604–615, 2011. Lee, B. P., Li, Y. J., Yu, J. Z., Louie, P. K., and Chan, C.
K.: Physical and chemical characterization of ambient aerosol by HR-ToF-AMS at a suburban site in Hong Kong during springtime 2011, J. Geophys. Res.-Atmos., 118, 8625–8639, doi:10.1002/jgrd.50658, 2013.
Li, Y. J., Lee, B. Y. L., Yu, J. Z., Ng, N. L., and Chan, C. K.: Evalu-ating the degree of oxygenation of organic aerosol during foggy and hazy days in Hong Kong using high-resolution time-of-flight aerosol mass spectrometry (HR-ToF-AMS), Atmos. Chem. Phys., 13, 8739–8753, doi:10.5194/acp-13-8739-2013, 2013. Li, Y. J., Lee, B. P., Su, L., Fung, J. C. H., and Chan, C. K.: Seasonal
characteristics of fine particulate matter (PM) based on high reso-lution time-of-flight aerosol mass spectrometric (HR-ToF-AMS) measurements at the HKUST Supersite in Hong Kong, Atmos. Chem. Phys. Discuss., 14, 20259–20293, doi:10.5194/acpd-14-20259-2014, 2014.
Lopez-Yglesias, X. F., Yeung, M. C., Dey, S. E., Brechtel, F. J., and Chan, C. K.: Performance evaluation of the Brechtel Mfg. Hu-midified Tandem Differential Mobility Analyzer (BMI HTDMA) for studying hygroscopic properties of aerosol particles, Aerosol Sci. Tech., 48, 969–980, doi:10.1080/02786826.2014.952366, 2014.
Low, R. D. H.: A generalized equation for the solution effect in droplet growth, J. Atmos. Sci., 26, 608–611, 1969.
Massoli, P., Lambe, A. T., Ahern, A. T., Williams, L. R., Ehn, M., Mikkila, J., Canagaratna, M. R., Brune, W. H., Onasch, T. B., Jayne, J. T., Petaja, T., Kulmala, M., Laaksonen, A., Kolb, C. E., Davidovits, P., and Worsnop, D. R.: Relationship between aerosol oxidation level and hygroscopic properties of laboratory generated secondary organic aerosol (SOA) particles, Geophys. Res. Lett., 37, L24801, doi:10.1029/2010GL045258, 2010. Medina, J., Nenes, A., Sotiropoulou, R. E. P., Cottrell, L. D.,
Mei, F., Setyan, A., Zhang, Q., and Wang, J.: CCN activ-ity of organic aerosols observed downwind of urban emis-sions during CARES, Atmos. Chem. Phys., 13, 12155–12169, doi:10.5194/acp-13-12155-2013, 2013.
Moore, R. H., Cerully, K., Bahreini, R., Brock, C. A., Middlebrook, A. M., and Nenes, A.: Hygroscopicity and composition of Cali-fornia CCN during summer 2010, J. Geophys. Res.-Atmos., 117, D00V12, doi:10.1029/2011JD017352, 2012a.
Moore, R. H., Nenes, A., and Medina, J.: Scanning mobility CCN analysis-A method for fast measurements of size-resolved CCN distributions and activation kinetics, Aerosol Sci. Tech., 44, 861– 871, 2010.
Moore, R. H., Raatikainen, T., Langridge, J. M., Bahreini, R., Brock, C. A., Holloway, J. S., Lack, D. A., Middlebrook, A. M., Perring, A. E., Schwarz, J. P., Spackman, J. R., and Nenes, A.: CCN spectra, hygroscopicity, and droplet activation kinetics of secondary organic aerosol resulting from the 2010 Deepwater Horizon oil spill, Environ. Sci. Tech., 46, 3093–3100, 2012b. Padró, L. T., Moore, R. H., Zhang, X., Rastogi, N., Weber, R. J.,
and Nenes, A.: Mixing state and compositional effects on CCN activity and droplet growth kinetics of size-resolved CCN in an urban environment, Atmos. Chem. Phys., 12, 10239–10255, doi:10.5194/acp-12-10239-2012, 2012.
Padró, L. T., Tkacik, D., Lathem, T., Hennigan, C. J., Sullivan, A. P., Weber, R. J., Huey, L. G., and Nenes, A.: Investigation of cloud condensation nuclei properties and droplet growth kinetics of the water soluble aerosol fraction in Mexico City, J. Geophys. Res.-Atmos., 115, D09204, doi:10.1029/2009jd013195, 2010. Petters, M. D. and Kreidenweis, S. M.: A single parameter
repre-sentation of hygroscopic growth and cloud condensation nucleus activity, Atmos. Chem. Phys., 7, 1961–1971, doi:10.5194/acp-8-6273/2008, 2007.
Petters, M. D. and Kreidenweis, S. M.: A single parameter repre-sentation of hygroscopic growth and cloud condensation nucleus activity – Part 3: Including surfactant partitioning, Atmos. Chem. Phys., 13, 1081–1091, doi:10.5194/acp-13-1081-2013, 2013. Pringle, K. J., Tost, H., Pozzer, A., Pöschl, U., and Lelieveld, J.:
Global distribution of the effective aerosol hygroscopicity pa-rameter for CCN activation, Atmos. Chem. Phys., 10, 5241– 5255, doi:10.5194/acp-10-5241-2010, 2010.
Roberts, G. C. and Nenes, A.: A continuous-flow streamwise thermal-gradient CCN chamber for atmospheric measurements, Aerosol Sci. Tech., 39, 206–221, 2005.
Rose, D., Gunthe, S. S., Mikhailov, E., Frank, G. P., Dusek, U., Andreae, M. O., and Pöschl, U.: Calibration and measurement uncertainties of a continuous-flow cloud condensation nuclei counter (DMT-CCNC): CCN activation of ammonium sulfate and sodium chloride aerosol particles in theory and experiment, Atmos. Chem. Phys., 8, 1153–1179, doi:10.5194/acp-8-1153-2008, 2008.
Rose, D., Nowak, A., Achtert, P., Wiedensohler, A., Hu, M., Shao, M., Zhang, Y., Andreae, M. O., and Pöschl, U.: Cloud conden-sation nuclei in polluted air and biomass burning smoke near the mega-city Guangzhou, China – Part 1: Size-resolved measure-ments and implications for the modeling of aerosol particle hy-groscopicity and CCN activity, Atmos. Chem. Phys., 10, 3365– 3383, doi:10.5194/acp-10-3365-2010, 2010.
Rose, D., Gunthe, S. S., Su, H., Garland, R. M., Yang, H., Berghof, M., Cheng, Y. F.,Wehner, B., Achtert, P., Nowak, A.,
Wieden-sohler, A., Takegawa, N., Kondo, Y., Hu, M., Zhang, Y., Andreae, M. O., and Pöschl, U.: Cloud condensation nuclei in polluted air and biomass burning smoke near the mega-city Guangzhou, China – Part 2: Size-resolved aerosol chemical composition, di-urnal cycles, and externally mixed weakly CCN-active soot par-ticles, Atmos. Chem. Phys., 11, 2817–2836, doi:10.5194/acp-11-2817-2011, 2011.
Stroud, C. A., Nenes, A., Jimenez, J. L., DeCarlo, P. F., Huffman, J. A., Bruintjes, R., Nemitz, E., Delia, A. E., Toohey, D. W., Guen-ther, A. B., and Nandi, S.: Cloud activating properties of aerosol observed during CELTIC, J. Atmos. Sci., 64, 441–459, 2007. Sueper, D.: ToF-AMS data analysis software: http://cires.colorado.
edu/jimenez-group/ToFAMSResources/ToFSoftware/index.html (last access: 1 June 2012), 2011.
Sullivan, R. C., Moore, M. J. K., Petters, M. D., Kreidenweis, S. M., Roberts, G. C., and Prather, K. A.: Effect of chemical mixing state on the hygroscopicity and cloud nucleation properties of calcium mineral dust particles, Atmos. Chem. Phys., 9, 3303– 3316, doi:10.5194/acp-9-3303-2009, 2009.
Takegawa, N., Miyakawa, T., Watanabe, M., Kondo, Y., Miyazaki, Y., Han, S., Zhao, Y., Van Pinxteren, D., Bruggemann, E., Gnauk, T., Herrmann, H., Xiao, R., Deng, Z., Hu, M., Zhu, T., and Zhang, Y.: Performance of an Aerodyne aerosol mass spectrom-eter (AMS) during intensive campaigns in China in the summer of 2006, Aerosol Sci. Tech., 43, 189–204, 2009.
Tang, I. N. and Munkelwitz, H. R.: Water activities, densities, and refractive indices of aqueous sulfates and sodium nitrate droplets of atmospheric importance, J. Geophys. Res.-Atmos., 99, 18801– 18818, doi:10.1029/94jd01345, 1994.
Textor, C., Schulz, M., Guibert, S., Kinne, S., Balkanski, Y., Bauer, S., Berntsen, T., Berglen, T., Boucher, O., Chin, M., Dentener, F., Diehl, T., Easter, R., Feichter, H., Fillmore, D., Ghan, S., Ginoux, P., Gong, S., Grini, A., Hendricks, J., Horowitz, L., Huang, P., Isaksen, I., Iversen, I., Kloster, S., Koch, D., Kirkevåg, A., Krist-jansson, J. E., Krol, M., Lauer, A., Lamarque, J. F., Liu, X., Mon-tanaro, V., Myhre, G., Penner, J., Pitari, G., Reddy, S., Seland, Ø., Stier, P., Takemura, T., and Tie, X.: Analysis and quantifica-tion of the diversities of aerosol life cycles within AeroCom, At-mos. Chem. Phys., 6, 1777–1813, doi:10.5194/acp-6-1777-2006, 2006.
Wang, J., Cubison, M. J., Aiken, A. C., Jimenez, J. L., and Collins, D. R.: The importance of aerosol mixing state and size-resolved composition on CCN concentration and the variation of the im-portance with atmospheric aging of aerosols, Atmos. Chem. Phys., 10, 7267–7283, doi:10.5194/acp-10-7267-2010, 2010. Wang, S. C. and Flagan, R. C.: Scanning electrical mobility
spec-trometer, Aerosol Sci. Tech., 13, 230–240, 1990.
Wex, H., McFiggans, G., Henning, S., and Stratmann, F.: Influence of the external mixing state of atmospheric aerosol on derived CCN number concentrations, Geophys. Res. Lett., 37, L10805, doi:10.1029/2010gl043337, 2010.
Yeung, M. C., Lee, B. P., Li, Y. J., and Chan, C. K.: Simultane-ous HTDMA and HR-ToF-AMS measurements at the HKUST Supersite in Hong Kong in 2011, J. Geophys. Res.-Atmos., 119, 9864–9883, doi:10.1002/2013JD021146, 2014.
Young, K. C. and Warren, A. J.: A reexamination of the derivation of the equilibrium supersaturation curve for soluble particles, J. Atmos. Sci., 49, 1138–1143, 1992.