Geoscientiic
Geoscientiic
Geoscientiic
Geoscientiic
1School of Mathematical and Statistical Sciences, Arizona State University, Tempe, Arizona, USA 2Laboratoire de Meteorologie Dynamique Ecole Normale Superieure, Paris, France
Correspondence to:M. Moustaoui (mohamed.moustaoui@asu.edu)
Received: 3 November 2012 – Revised: 18 February 2013 – Accepted: 19 February 2013 – Published: 16 April 2013
Abstract.An interesting occurrence of a Rossby wave break-ing event observed durbreak-ing the VORCORE experiment is pre-sented and explained. Twenty-seven balloons were launched inside the Antarctic polar vortex. Almost all of these balloons evolved in the stratosphere around 500K within the vortex, except the one launched on 28 October 2005. In this case, the balloon was caught within a tongue of high potential vor-ticity (PV), and was ejected from the polar vortex. The evolu-tion of this event is studied for the period between 19 and 25 November 2005. It is found that at the beginning of this pe-riod, the polar vortex experienced distortions due to the pres-ence of Rossby waves. Then, these waves break and a tongue of high PV develops. On 25 November, the tongue became separated from the vortex and the balloon was ejected into the surf zone. Lagrangian simulations demonstrate that the air masses surrounding the balloon after its ejection were origi-nating from the vortex edge. The wave breaking and the de-velopment of the tongue are confined within a region where a planetary Quasi-Stationary Wave 1 (QSW1) induces wind speeds with weaker values. The QSW1 causes asymmetry in the wind speed and the horizontal PV gradient along the edge of the polar vortex, resulting in a localized jet. Rossby waves with smaller scales propagating on top of this jet am-plify as they enter the jet exit region and then break. The role of the QSW1 on the formation of the weak flow condi-tions that caused the non-linear wave breaking observed near the vortex edge is confirmed by three-dimensional numerical simulations using forcing with and without the contribution of the QSW1.
Keywords. Atmospheric composition and structure (Middle atmosphere – composition and chemistry)
1 Introduction
Wave breaking is a frequent phenomenon in the atmosphere, and represents one of the most important contributors to dy-namics in the middle atmosphere. Wave breaking for Rossby waves involves irreversible deformation of a certain set of material contours, namely those of constant Potential Vortic-ity (PV), which would undulate reversibly under the influ-ence of Rossby waves restoring mechanism (McIntyre and Palmer, 1983, 1984, 1985). In winter and spring, the strato-spheric dynamics at high latitudes is dominated by the po-lar vortex. Rossby waves propagating upward near the vor-tex edge may reach large amplitudes at some levels, re-sulting in Rossby wave breaking (Haynes, 2005, and refer-ences therein). Under the effect of wave breaking, the strato-spheric polar vortex experiences erosion that causes forma-tion of steep gradients at its edge, and stirring of filaments into middle latitudes (Dritschel et al., 1991; Legras et al., 2001). These filaments are able to cause rapid transport of air from regions located inside the vortex to regions outside, and are important factors that regulate the distribution and exchange of ozone (and other gas traces) between the polar vortex and regions located in the surf zone (Plumb, 2002; Shepherd, 2007).
have indicated that wave breaking is accompanied with de-velopment of filaments or tongues that irreversibly transport air from the vortex edge toward the equator. Other stud-ies have also presented some events, although less com-mon, where stratospheric wave breaking produced intrusion of mid-latitude air originating from the surf zone into the NH vortex core (Plumb et al., 1994; Mariotti et al., 1997). Mous-taoui et al. (2003a) have reported events in the SH where anomalous and localized large ozone increases in the form of lamina were observed inside the ozone hole. They showed that these events were due to poleward transport into the core of the Antarctic vortex of air, with rich ozone within thin fil-aments originating from the vortex edge . The one-sidedness of wave breaking was attributed to cross-jet asymmetry of the vortex flow, which is such that Rossby waves break uniquely outward under most circumstances (Nakamura and Plumb, 1994).
Previous studies have shown that wave breaking in the tro-posphere and in the tropopause regions depends on the wave number (Orlanski, 2003; Riviere and Orlanski, 2007), and on the zonal variation of the zonal flow along jets (Peters and Waugh, 1996, 2003; Swanson et al., 1997; Swanson, 2000; Ndarana and Waugh, 2011; Esler and Haynes, 1999). It was suggested that wave breaking tends to occur in regions where the mean zonal wind is weak. Peters and Waugh (2003) ex-amined the characteristics of Rossby wave propagation and breaking in the Southern Hemisphere upper troposphere dur-ing winter. They concluded that the location and the mor-phology of wave breaking will differ depending on the flow configurations. In the SH stratosphere, the polar vortex dur-ing winter is more symmetrical and centered near the pole compared to that in the NH (Randel and Newman, 1998; Waugh and Randel, 1999; Karpetchko et al., 2005). The wind along its edge presents little variations in the zonal direction. In spring, however, the SH stratospheric circulation is by far dominated by the quasi-stationary planetary wave with the zonal wavenumber 1 (QSW1) (Geller and Wu, 1987; Wirth, 1991; Bowman, 1993; Agosta and Canziani, 2011; Hartman, 1977; Randel, 1988; Moustaoui et al., 2003b). The QSW1 causes the vortex to be displaced from the pole or even split. The displacement of the vortex is accompanied by strong variation in the zonal wind (Moustaoui et al., 2003b).
One of the objectives of this paper is to analyze and ex-plain a wave breaking event that occurred in the SH strato-sphere in spring 2005, and which was registered by a balloon launched during VORCORE. Preliminary results for this event were presented for the first time in the SPARC meet-ing (Teitelbaum and Moustaoui, 2008). Durmeet-ing VORCORE, several balloons were launched inside the Antarctic polar vortex. These balloons stayed and evolved inside the vortex core. This was expected, as the vortex edge presents a quasi-impermeable barrier to transport and exchange of air between regions inside and outside the polar vortex. There was, how-ever, an exception for one balloon, which was also launched inside the polar vortex on 28 October 2005. This balloon was
caught within a tongue of high PV produced by Rossby wave breaking and was ejected into the surf zone. This paper fo-cuses primarily on this case. We analyze the flow conditions, the large and smaller scale dynamics, and the evolution of the polar vortex that were present during this event. Furthermore, we present high-resolution simulations using the method of contour advection with surgery (CAS) to demonstrate that air masses enclosing the balloon after its ejection were pulled off the vortex edge. The second objective of this paper is to study the role of the QSW1 and the asymmetry that this wave pro-duces, in both the wind and the horizontal PV gradient, along the vortex edge on the location of the wave breaking event that was observed. The role of the QSW1 is confirmed with simulations using a three-dimensional isentropic model.
In Sect. 2, we present the data and the method used. In Sect. 3, we analyze the formation and the evolution of the tongue that caused the balloon ejection from the polar vor-tex. Results from high-resolution simulations of the tongue evolution, and the role of the flow configuration induced by the QSW1 on the formation of this tongue are presented in Sect. 4. Section 5 presents three-dimensional simulations of the polar vortex under real and idealized conditions, with and without the presence of the QSW1 forcing. Finally, conclu-sions are presented in Sect. 6.
2 Data and method
The data used in this study are taken from measurements made during the VORCORE experiment. This experiment took place in the Antarctic polar vortex for the period be-tween September 2005 and February 2006. During this cam-paign of measurements, twenty-seven super-pressured bal-loons were launched inside the core of the vortex at altitudes located between 17 and 19 km. All the balloons were instru-mented to measure pressure and temperature. In addition, global positioning system (GPS) measurements were used to track the balloons locations with accuracies of 10 m in the horizontal and 20 m in the vertical. The data were transmit-ted to ground stations, through the ARGOS satellite system (Vincent et al., 2007). All the balloon locations and pathways that will be presented in this paper are the real isopycnic tra-jectories (along surfaces with constant density) observed by the balloon. The dynamics of the polar vortex will be in-vestigated along isentropic surfaces because these surfaces are more relevant for adiabatic motion; which is a good as-sumption in the stratosphere for timescales of few days. The isentropic level that is considered in this study is 500 K. This level corresponds roughly to an altitude that is around 19 km, which is approximately the altitude where the balloon stud-ied here evolved.
Fig. 1a–d.A sequence for the potential vorticity fields obtained from ECMWF at 500 K level on(a)19,(b)20,(c)21, and(d)22 Novem-ber 2005 at 12:00 UTC. The contour interval is 4 PVU. The crosses superimposed in this figure indicate the locations of the balloon that was launched on 28 October 2005 and was ejected from the vortex. The stars denote locations of several balloons that evolved inside the vortex during the same period.
temperature, wind and geopotential fields from ECMWF are extracted on a grid with a horizontal resolution of 1 by 1 de-gree, and 21 pressure levels (1000, 925, 850, 700, 500, 400, 300, 250, 200, 150, 100, 70, 50, 30, 20, 10, 7, 5, 3, 2 and 1 hPa). The PV fields are calculated from these data after interpolation on the 500 K isentropic level. The PV unit is PVU = 10−6m2K kg−1.
To compute the fine-scale structures of PV distributions, we use the CAS method (Mariotti et al., 1997; Waugh and Plumb, 1994; Moustaoui et al., 2003a). CAS is a Lagrangian method that reconstructs the evolution of a set of one or more contours of PV as it is transported by a flow. This method
Fig. 1e–f. Same as Fig. 1a–d except that the potential vorticity fields are taken on(e)23,(f)24, and(g)25 November 2005 at 12:00 UTC.
In addition, we use data from the National Center for En-vironmental Prediction (NCEP) Final Analysis (FNL from Global Forecasting System (GFS)) to initialize a three-dimensional model that use potential temperature as a ver-tical coordinate. This model will be presented in Sect. 5. The FNL data are given every 6 h on standard pressure levels and a horizontal grid with a resolution of 1 by 1 degree. For the purpose of the model, these data are interpolated on 8 isen-tropic levels ranging from 350 K–700 K.
3 Observation of wave breaking and balloon ejection from the polar vortex
In this section, we present the evolution of the Antarctic polar vortex for the period between 12:00 UTC 19 November 2005
and 12:00 UTC, 25 November 2005. Figure 1 shows a se-quence of daily maps of PV distributions for the period be-tween 19 and 25 November on 12:00 UTC from ECMWF at 500 K. The symbols superimposed on Fig. 1 (the cross and the stars) denote the locations of several balloons launched during VORCORE. These balloons evolved in the SH strato-sphere during the same period. The cross indicates the posi-tion of the balloon that was launched on 28 October 2005, and which will be ejected from the vortex at later times. The stars represent the locations of other balloons that were fly-ing at the same time as the one represented by the cross, but stayed inside the vortex.
Fig. 2.Distributions of the Montgomery potential field at 500 K level from ECMWF:(a)on 12:00 UTC 19 November 2005, and(b)on 12:00 UTC, 24 November 2005. The unit is m2s−2.
the planetary wave, the PV field shows a Rossby wave with a higher wave number propagating along the vortex edge. A closer look at the structure of the PV contours reveals that the presence of this wave causes a local distortion around the lo-cation (60◦S, 160◦E), where Rossby wave breaking will be initiated (e.g. Fig. 1a–d). This wave amplifies as it propagates clockwise along the vortex edge, resulting in a local equator-ward distortion of the vortex edge on 20 November. This dis-tortion is now located at the longitude of 180◦
E (Fig. 1b). We note that on 19 and 20 November, all the balloons were evolving inside the polar vortex. On 21 November (Fig. 1c), the amplitude of the wave and the resulting distortion of the vortex edge become more pronounced. At this time, the bal-loon represented by the cross symbol is caught within this distortion. The amplitude of the wave continue to grow as the wave propagates leading to equator-ward wave breaking event on 23 and 24 November (Fig. 1e–f), and a development of a tongue of air masses with high PV values (in magnitude). On 25 November, this tongue is completely separated from the main vortex and appears as an isolated blob (Fig. 1g). The balloon, which was trapped within the tongue, is now pulled off the polar vortex and is located in the surf zone (the location of this balloon is represented by a cross in Fig. 1). The results presented in Fig. 1 show that the formation of the tongue and the ejection of the balloon from the vortex are due to a Rossby wave breaking event. We note that several other balloons, which were flying during the same times as the one that was ejected, were not caught within the wave breaking region, and stayed inside the polar vortex (the stars superim-posed in Fig. 1 denote the locations of these balloons).
As noted above, the PV maps suggest the presence of a planetary wave and a smaller Rossby wave. The presence of the planetary wave is more evident in Fig. 2a. This figure shows the distribution of the Montgomery potential calcu-lated from ECMWF analyses on 19 November at 500 K. The Montgomery potential (or the dry static energy) represents,
after scaling by the Coriolis parameter, the stream function for the geostrophic flow along isentropic surfaces (Andrews et al., 1987).
The distribution of the Montgomery potential (Fig. 2a) shows a clear evidence of presence of a Rossby wave sig-nature with the wave-number 1 that is dominating the flow. Comparison between the gradients across the contours of the Montgomery potential indicates that the winds in the cy-clonic part (e.g. 60–40◦
S and 0–90◦
E in Fig. 2a) of the wave are more pronounced than those found in the anticy-clonic part (e.g. 60–40◦
S and 180–90◦
W in Fig. 2a). This is because the planetary wave prevents the vortex from be-ing centered on the pole; and that the cyclonic winds associ-ated with the displaced vortex add up to the cyclonic circu-lation induced by the wave. Figure 2b shows the distribution of the Montgomery potential field on 24 November at 500 K. This distribution is similar to the one found 5 days earlier (Fig. 2a), indicating that the observed wave is the QSW1. This wave has high amplitude in the stratosphere and dom-inates by far the flow in the Southern Hemisphere during spring (Agosta and Canziani, 2011; Hartman, 1977; Randel, 1988; Moustaoui et al., 2003b).
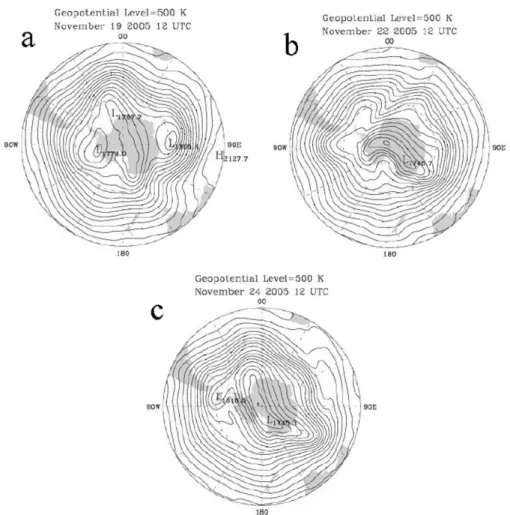
Fig. 3.Distributions of the geopotential field at 500 K level from ECMWF:(a)on 12:00 UTC, 19 November 2005,(b) on 12:00 UTC, 22 November 2005, and(c)on 12:00 UTC, 24 November 2005. The unit is 10 m.
high PV was found (Fig. 1f), suggesting that these shorter waves are the ones that contribute to the observed Rossby wave breaking.
A regional zoom of the PV distribution on 24 November is presented in Fig. 4. We note the presence of small eddies that develop inside the tongue. According to McIntyre and Palmer (1984), such eddies could be produced by local insta-bilities because of the change in the sign of the gradient of PV across the tongue. Nevertheless, these eddies could also reflect the limitation of the ECMWF analyses to resolve the fine structures of these eddies as they became too narrow.
4 Reconstruction of Rossby wave breaking and the role of the flow configuration induced by the QSW1
4.1 Reconstruction of Rossby wave breaking
Before analyzing the role of the flow configuration induced by the QSW1, we will first show that the air masses enclos-ing the balloon after its ejection from the polar vortex are originating from the vortex edge. For this purpose, we
Fig. 4.A zoom for the isentropic potential vorticity distribution from ECMWF around the location of the tongue at 500 K on 12:00 UTC, 24 November 2005. The cross indicates the location of the balloon.
connected to the edge of the vortex through a thin filament in the CAS results (the balloon locations are indicated by dots in Fig. 5b). Thus, the reconstructed PV fields are able to re-solve the small-scale filament connecting the blob of high IPV to the main vortex, and demonstrate that the air masses enclosing the balloon location after its ejection from the po-lar vortex are pulled from the vortex edge.
4.2 The role of the flow configuration induced by the QSW1
As stated in the introduction, many previous studies have shown that wave breaking is confined within regions of weak zonal winds (Nakamura and Plumb, 1994; Peters and Waugh, 1996, 2003; Swanson et al., 1997; Swanson, 2000; Waugh and Polvani, 2000). Moustaoui et al. (2003b) used similar ar-guments based on the climatology of the mean zonal flow to explain the existence of preferred regions for wave breaking and air exchange between high and low latitudes in the SH stratosphere during spring. Peters and Waugh (2003) identi-fied four configurations for the mean zonal flow in the SH upper troposphere during winter including a single, broken and double jet. They showed that the location and the charac-teristics of wave breaking depend on the flow configuration.
Fig. 5. Distributions of the isentropic potential vorticity field re-constructed by the CAS method at 500 K level:(a)on day 22 and
(b)on day 25. The contours represented have a magnitude values of 28, 32, 36 and 40 PVU. The black dot indicates the location of the balloon.
Fig. 6. Distributions of(a)the background wind speed (m s−1) and
(b)the background horizontal PV gradient fields from ECMWF at 500 K level, averaged within the period between 19 and 25 Novem-ber 2005. The black-dashed curve represents the real isopycnic tra-jectory of the balloon observed between day 19 and day 25. The col-ored curves represent the PV contour with the magnitude of 28 PVU from the CAS calculations on day 19 (blue), day 21 (red), day 23 (green) and day 25 (black). For each day, the location of the balloon is denoted by a dot using the same color.(c)Distribution of the wind field obtained on day 21.
the present case study was centered off the pole due to the presence of the QSW1. The background flow induced by the QSW1 shows asymmetry along the vortex edge, with a con-figuration that include a sector where the wind speed is weak-ening (lower-left part of the vortex edge) and a region where the QSW1 produces a localized jet (upper-right part of the edge). This structure is similar to the one referred to as a Sin-gle Jet (SJ) configuration of the upper tropospheric subtrop-ical jet presented by Peters and Waugh (2003). We note that in our case, the localized jet is not related to the subtropical jet since the winds are taken in the stratosphere at the isen-tropic level of 500 K, which is well above the location of the subtropical jet, and include both the zonal and the meridional components. The localized jet structure in our case is due to the presence of the QSW1, which tends to create asymme-try in the distribution of the wind magnitude along the edge of the polar vortex. The full isopycnic trajectory of the bal-loon observed between day 19 and day 25 is represented in Fig. 6a by the black-dashed line. We note that the balloon escapes the main polar vortex (the main polar vortex will be shown in Fig. 8a) in a region where the QSW1 induces weak winds. In Fig. 6a, we also superimposed the PV contour with the magnitude of 28 PVU that was obtained from the CAS calculations on day 19 (blue), day 21 (red), day 23 (green) and day 25 (black). In each day, the balloon locations (repre-sented by dots using the same color) were enclosed by these PV contours. These contours show the presence of Rossby waves with smaller wavelengths that propagate along the vor-tex edge. As these waves enter the sector where the winds are weak, they amplify and result in Rossby wave break-ing. The wave breaking causes the balloon to be transported outside the main polar vortex on day 25. Figure 6b is the same as Fig. 6a except that here we plot the magnitude of the mean PV gradient, which is calculated as follows. First, The PV fields at 500 K are averaged within 7 days. The re-sulting mean PV field is used to calculate the magnitude of the total PV gradient (including both the eastward and the northward components). Then the mean PV gradient is fil-tered to remove the noise using a spectral filter. The QSW1 induces asymmetry in the mean PV gradient along the vor-tex edge. In the region where the PV gradient is high (upper right) the amplitude of Rossby waves is small because of the strong restoring force due to the high PV gradient. As these waves enter the region where the PV gradient is weak (lower left) they amplify and break. This is consistent with previ-ous studies which have suggested that the PV gradient tends to inhibit wave breaking (Hitchman and Huesmann, 2007; Haynes et al., 2007).
5 Simulations using a 3-D isentropic model
Fig. 7. A sequence for the magnitude of potential vorticity fields obtained from the 3-D isentropic model simulations at 500 K level on day
whereVh is the horizontal velocity vector along the isen-tropic coordinate,f is the Coriolis parameter,θis the poten-tial temperature,σ is the isentropic density given by
σ= −1 g
∂p
∂θ, (4)
pis the pressure,5=cp(p/pr)κis the Exner function, and
M is the Montgomery potential, which can be written in terms of the Exner function asM=θ 5+gz.
The above equations are solved on the sphere using the divergence-vorticity form of the equations. The numerical model is spectral in the horizontal with a triangular spec-tral truncature of T106. In the vertical, 8 isentropic levels are used with staggered grid spacing where the vorticity, the di-vergence and the Montgomery potential are placed half a grid point away from the pressure and the Exner function. The vertical isentropic levels are uniformly distributed between 350 K and 700 K, with a grid spacing of 50 K. The numerical scheme uses a third order Runge–Kutta method. The simula-tions are driven by the FNL analyses. At the upper and the bottom boundaries, we impose the pressure (at 700 K) and the geopotential (at 350 K), respectively. The geopotential at the bottom boundary is used to specify the wave forcing.
5.1 Realistic simulation
In the first simulation, we conducted a 5-day real simula-tion of the polar vortex dynamics starting on 19 Novem-ber at 12:00 UTC and ending on 24 NovemNovem-ber 2005 at 12:00 UTC. The initial conditions are interpolated from the analyses on day 19. The upper boundary conditions use a time-independent pressure distribution obtained from a tem-poral average of the NFL pressure fields at 700 K between 19 and 25 November. At the bottom boundary, we use the instantaneous geopotential distributions obtained by interpo-lating the geopotential fields from the FNL analyses at 350 K to the time step and to the grid point locations of the simula-tion. Figure 7 shows the daily evolution of the PV distribu-tion at 500 K simulated by the model from 19 to 24 Novem-ber. The remarkable agreement between the fields presented
tex off the pole, the QSRW1 induces an asymmetry of the winds along the vortex edge, and creates a preferred region for wave breaking where the mean winds are weak. This ex-plains the location where the balloon was ejected during the VORCORE experiment.
5.2 Idealized simulation
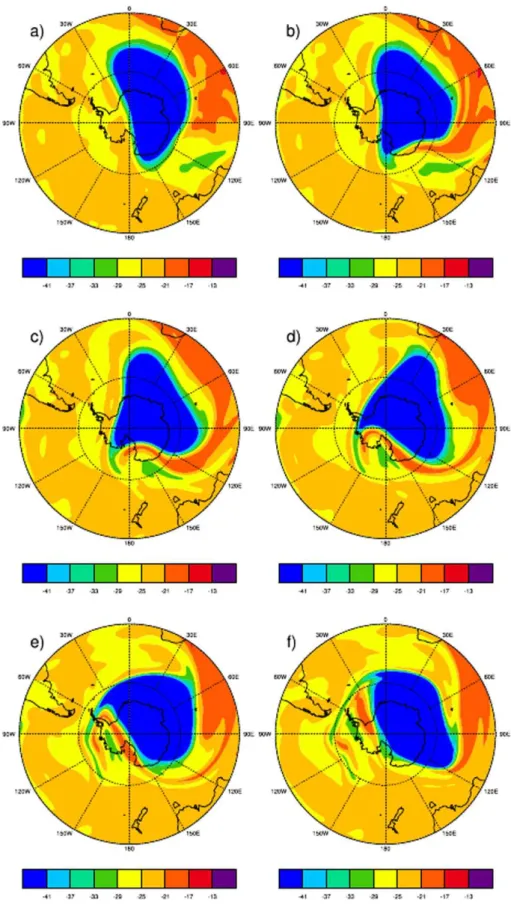
To confirm the role and the importance of the QSW1 on the modification of the mean winds and its consequence in the development of wave breaking, we conducted two idealized simulations. In one of these simulations, all the fields used in the model are obtained from the FNL analyses after av-eraging in time within 7 days (between day 19 and day 25) both the initial and the boundary conditions. In this case, the prescribed pressure at the top and the geopotential at the bot-tom boundaries are both averaged and are fixed (time inde-pendent). Figure 8a–b shows the temporal mean of PV and the wind fields used for the initialization. This figure shows that the mean wind speed distribution is asymmetric along the vortex edge. The QSW1 induces higher winds along the upper right region of the vortex, and low winds in the lower left part of it. These fields, after 5 days’ evolution, are shown in Fig. 8c–d. The distributions of the wind speed show that the QSW1 still dominates the flow (Fig. 8d). The PV field shows a formation of a tongue of high IPV values in the re-gion where the winds are weak (Fig. 8c).
wave along the vortex edge persists and the tongue of high PV develops. In contrast, when the forcing due to this wave is removed, the polar vortex tends to move and to be cen-tered on the pole, the initial contribution of the QSW1 decays with time, and the tongue of high PV does not form. These two idealized simulations confirm the role of the QSW1 on the configuration of the wind speed along the polar vortex edge, and demonstrate the role of the QSW1 on the location of Rossby wave breaking that caused the observed ejection of the balloon from the polar vortex during the VORCORE experiment.
6 Conclusions
We studied lower stratospheric dynamics in the Antarc-tic region associated with Rossby wave breaking event that occurred in spring of 2005 and was registered by a balloon launched during the VORCORE experiment. In the VORCORE campaign of measurements, several super-pressured balloons were launched inside the polar vortex. We showed that all these balloons evolved inside the vortex for several days, except one of them. In this case the bal-loon was caught in a wave breaking event, and was pulled off the vortex within a tongue of high PV. The formation and the evolution of this tongue were studied in details. We ana-lyzed the evolution of the planetary waves that were present during the wave breaking event and the subsequent forma-tion of the tongue. The structure of the potential of Mont-gomery showed the presence of a QSW1, which dominated the Rossby wave field and resulted in the global distortion of the polar vortex by preventing it from being centered on the pole. Other shorter waves propagating along the vortex edge causing local distortions of the vortex edge were also identi-fied from the distribution of the PV maps and the geopoten-tial height field.
The evolution of the tongue was examined and followed for the period starting on 19 November 2005 and ending on 25 November 2005. During the last three days of this pe-riod, the balloon was caught within a tongue of air masses with high PV originating from the polar vortex and was transported towards the Equator. The balloon was thereafter ejected from the main vortex.
High-resolution simulations using the CAS technique re-produced the evolution of the observed wave breaking event and the formation of the tongue. They confirmed that the air masses surrounding the balloon location after its ejection were stripped from the polar vortex. The formation and the location of the tongue were explained by the configuration of the wind field induced by the QSW1. This wave causes asymmetry along the edge of the polar vortex with formation of a region with a localized jet and high PV gradient. Smaller Rossby waves propagating along the vortex edge amplify then break as they enter the region where the mean wind and the PV gradient are weak. The role of the QSW1 is further
confirmed by three-dimensional simulations. These simula-tions demonstrated that when the forcing due to QSW1 is present, wave breaking and the tongue develops in the region where the QSW1-induced winds are weak. If this forcing is suppressed, the polar vortex tends to be centered on the pole and the tongue of high PV does not develop.
This study was motivated by the observation of a balloon that was expelled from the vortex within a tongue of high PV during the VORCORE experiment. The mechanism re-sponsible for the equator-ward transport of the balloon and its ejection into the surf zone, and the role of the QSW1 in creating the weak flow conditions that caused Rossby wave breaking near the vortex edge in a real atmosphere are pre-sented for the first time. Finally, since the QSW1 dominates the stratospheric dynamics during the SH springtime, Rossby wave breaking similar to the event presented in this paper are expected to be more frequent and may significantly con-tribute to the climatological variability of tracers and air ex-change between high and low latitudes during spring.
Acknowledgements. This work was partially supported by NSF grants ATM-0934592 and EF 1049251. We are thankful to the ECMWF for the free access to its archived analyses. We also thank the VORCORE team for the balloon data.
Topical Editor C. Jacobi thanks two anonymous referees for their help in evaluating this paper.
References
Agosta, E. A. and Canziani, P. O.: Austral Spring Stratospheric and Tropospheric Circulation Interannual Variability, J. Climate, 24, 2629–2647, doi:10.1175/2010JCLI3418.1, 2011.
Andrews, D. G., Holton, J. R., and Leovy, C. B.: Middle Atmo-sphere Dynamics, Edition 6, Academic Press, pp. 489, 1987. Bowman, K. P.: Barotropic simulation of large-scale mixing in the
Antarctic polar vortex, J. Atmos. Sci., 50, 2901–2914, 1993. Dritschel, D. G.: Contour dynamics and contour surgery:
numer-ical algorithms for extended, high-resolution modelling of vor-tex dynamics in two-dimensional, inviscid, incompressible flows, Computer Physics Reports, 10, 77–146, 1989.
Dritschel, D. G., Haynes, P. H., Juckes, M. N., and Shepherd, T. G.: The stability of a two-dimensional vorticity filament under uniform strain, J. Fluid Mech., 230, 647–665, 1991.
Esler, J. G. and Haynes, P. H.: Baroclinic Wave Breaking and the Internal Variability of the Tropospheric Circulation, J. Atmos. Sci., 56, 4014–4031, 1999.
Geller, M. A. and Wu, M. F.: Troposphere-stratosphere general circulation statistics, Transport Processes in the Middle Atmo-sphere, edited by: Visconti, G. and Garcia, R., Reidel, 3–17, 1987.
Hartman, D. L.: Stationary planetary waves in the Southern Hemi-sphere, J. Geophys. Res., 77, 437–471, 1977.
phys. Res., 102, 6131–6142, 1997.
McIntyre, M. E. and Palmer, T. N.: Breaking planetary waves in the stratosphere, Nature, 305, 593–600, 1983.
McIntyre, M. E. and Palmer, T. N.: The surf zone in the stratosphere, J. Atmos. Terr. Phys., 46, 825–849, 1984.
McIntyre, M. E. and Palmer, T. N.: A note on the general concept of wave breaking for Rossby and gravity waves, Pure Appl. Geo-phys., 123, 964–975, 1985.
Moustaoui, M., Teitelbaum, H., and Valero, F. P. J.: Ozone laminae inside the Antactic vortex produced by pole- ward filaments, Q. J. Roy. Meteorol. Soc., 129, 3121–3136, 2003a.
Moustaoui, M., Teitelbaum, H., and Valero, F. P. J.: Vertical dis-placements induced by quasi-stationnary waves in the southern Hemisphere during spring, Mon. Weather Rev., 131, 2279–2289, 2003b.
Nakamura, M. and Plumb, R. A.: The effects of flow asymmetry on the direction of Rossby wave breaking, J. Atmos. Sci., 51, 2031– 2045, 1994.
Ndarana, T. and Waugh, D. W.: A Climatology of Rossby Wave Breaking on the Southern Hemisphere Tropopause, J. Atmos. Sci., 68, 798–811, 2011.
Orlanski, I.: Bifurcation in Eddy Life Cycles: Implications for storm track variability, J. Atmos. Sci., 60, 993–1023, 2003.
Peters, D. and Waugh, D. W.: Influence of barotropic shear on the poleward advection of upper tropospheric air, J. Atmos. Sci., 53, 3013–3031, 1996.
Peters, D. and Waugh, D. W.: Rossby Wave Breaking in the South-ern Hemisphere Wintertime Upper Troposphere, Mon. Weather Rev., 131, 2623–2634, 2003.
Plumb, R. A.: Stratospheric transport, J. Meteorol. Soc. Jpn., 80, 793–809, 2002.
Plumb, R. A., Waugh, D. W., Atkinsons, R. J., Newman, P. A. Lait, L. R., Schoeberl, M. R., Browel, E. V., Simmons, A. J., and Lowenstein, M.: Intrusion into the lower stratospheric Arc-tic vortex during the winter of 1991/92, J. Geophys. Res., 99, 1089–1106, 1994.
Polvani, L. M. and Plumb, R. A.: Rossby wave breaking, filamen-tation and secondary vortex formation: The dynamics of a per-turbed vortex, J. Atmos. Sci., 49, 462–476, 1992.
barotropic storm tracks, J. Atmos. Sci., 54, 791–810, 1997. Teitelbaum, H. and Moustaoui, M.: Observation of a
tongue pulled out from the Antarctic vortex due to barotropic instability, SPARC 4th General Assembly, avail-able at: http://www.atmosp.physics.utoronto.ca/SPARC/ SPARC2008GA/Posters/SessionB P97 A68 Teitelbaum.pdf, 2008.
Teitelbaum, H., Moustaoui, M., Van Velthoven, P. F. J., and Kelder, H.: Decrease of total ozone at low latitudes in the southern hemi-sphere by a combination of linear and non-linear processes, Q. J. Roy. Meteorol. Soc., 124, 2625–2644, 1998.
Vincent, R. A., Hertzog, A., Boccara, G., and Vial, F.: Quasi-Lagrangian superpressure balloon measurements of gravity waves momentum fluxes in the polar stratosphere of both hemispheres, Geophys. Res. Lett., 34, L19804, doi:10.1029/2007GL031072, 2007.
Waugh, D. W. and Plumb, R. A.: Contour advection with surgery: A technique for investigating fine scale structure in tracer transport, J. Atmos. Sci., 51, 330–540, 1994.
Waugh, D. W. and Polvani, L. M.: Intrusions into the tropical upper troposphere, Geophys. Res. Lett., 27, 3857–3860, 2000. Waugh, D. W. and Polvani, L. M.: Stratospheric polar vortices,
in: The Stratosphere: Dynamics, Chemistry, and Transport, Geo-phys. Monogr. Ser., 190, edited by: Polvani, L. M., Sobel, A. H., and Waugh, D. W., pp. 43–57, AGU, Washington, D.C., 2010. Waugh, D. W. and Randel, W. J.: Climatology of Arctic and
Antarc-tic polar vorAntarc-tices using ellipAntarc-tical diagnosAntarc-tics, J. Atmos. Sci., 56, 1594–1613, 1999.
Waugh, D. W., Plumb, R. A., Atkinsons, R. J. , Schoeberl, M. R., Lait, L. R., Newman, P. A., Lowenstein, M., Toohey, D. W., Aval-lone, L. M., Webster, C. R., and May, R. D.: Transport out of the lower stratospheric Arctic vortex by Rossby wave breaking, J. Geophys. Res., 99, 1071–1088, 1994.