www.atmos-chem-phys.net/13/2723/2013/ doi:10.5194/acp-13-2723-2013
© Author(s) 2013. CC Attribution 3.0 License.
Atmospheric
Chemistry
and Physics
Geoscientiic
Geoscientiic
Geoscientiic
Geoscientiic
Sensitivity of cloud condensation nuclei to regional changes in
dimethyl-sulphide emissions
M. T. Woodhouse1, G. W. Mann1,2, K. S. Carslaw1, and O. Boucher3,*
1Institute for Climate and Atmospheric Science, School of Earth and Environment, University of Leeds, Leeds, LS2 9JT, UK 2National Centre for Atmospheric Science, University of Leeds, Leeds, LS2 9JT, UK
3Met Office Hadley Centre, FitzRoy Road, Exeter, Devon, EX1 3PB, UK
*now at: Laboratoire de M´et´eorologie Dynamique, Centre National de la Recherche Scientifique/Universit´e Pierre et Marie
Curie, 4 place Jussieu, 75252, Paris, France
Correspondence to:M. T. Woodhouse ([email protected])
Received: 27 July 2012 – Published in Atmos. Chem. Phys. Discuss.: 18 October 2012 Revised: 13 February 2013 – Accepted: 26 February 2013 – Published: 8 March 2013
Abstract. The atmospheric oxidation of dimethyl-sulphide (DMS) derived from marine phytoplankton is a significant source of marine sulphate aerosol. DMS has been proposed to regulate climate via changes in cloud properties, though recent studies have shown that present-day global cloud con-densation nuclei (CCN) concentrations have only a weak de-pendence on the total emission flux of DMS. Here, we use a global aerosol microphysics model to examine how effi-ciently CCN are produced when DMS emissions are changed in different marine regions. We find that global CCN produc-tion per unit mass of sulphur emitted varies by more than a factor of 20 depending on where the change in oceanic DMS emission flux is applied. The variation in CCN pro-duction efficiency depends upon where CCN propro-duction processes (DMS oxidation, SO2 oxidation, nucleation and
growth) are most efficient and removal processes (deposi-tion) least efficient. The analysis shows that the production of aerosol sulphate through aqueous-phase oxidation of SO2
limits the amount of H2SO4available for nucleation and
con-densational growth and therefore suppresses CCN formation, leading to the weak response of CCN to changes in DMS emission. Our results show that past and future changes in the spatial distribution of DMS emissions (through changes in the phytoplankton population or wind speed patterns) could exert a stronger control on climate than net increases in bio-logical productivity.
1 Introduction
Dimethyl-sulphide (DMS) is a climate-relevant trace gas pro-duced in the surface oceans by some species of phytoplank-ton (Stefels et al., 2007). Some DMS is vented to the atmo-sphere by gas transfer processes (e.g. Liss et al., 1997), where it is oxidized (Barnes et al., 2006). The oxidation products of DMS can contribute to atmospheric aerosol, either lead-ing to formation of new particles, or grow existlead-ing particles. Observations (Andreae et al., 1999; O’Dowd et al., 1999b; Yang et al., 2011) have shown that aqueous-phase oxidation is the dominant sulphate production mechanism in marine stratocumulus regions.
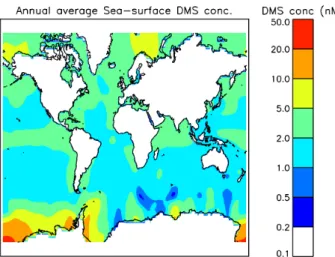
Surface ocean DMS concentrations are highly variable with season and location. Concentrations range from<0.1 to
>50.0 nM, the highest concentrations occurring in the high-latitude oceans during summer. Annual mean DMS concen-trations from the Kettle and Andreae (2000) observational climatology are on the order of a few nanomols, and are shown in Fig. 1. Sea-surface DMS concentrations have been observed to increase by 8.5 nM in response to iron addition experiments (Boyd et al., 2007), but such changes are short-lived and affect only a small area. Vallina et al. (2007) found that sea-surface DMS concentrations increased locally by up to 0.5 nM in response to a global warming scenario with a marine ecosystem model.
Fig. 1.Annual mean sea-surface DMS concentrations from the Ket-tle and Andreae (2000) observational climatology.
20–80 % of non sea-salt sulphate near the surface over the Northern Hemisphere oceans and more than 80 % in most of the Southern Hemisphere.
In what is now known as the CLAW hypothesis, Charl-son et al. (1987) suggested that changes in phytoplankton-derived DMS arising from climate change could impact the number of cloud condensation nuclei (CCN) and hence al-ter cloud optical properties through the first (cloud albedo, Twomey, 1974) and second (cloud lifetime, Albrecht, 1989) aerosol indirect effects. A feedback may then operate that links climate change to cloud albedo. The direction (positive or negative) of the CLAW feedback is not certain however (Ayers and Cainey, 2007; Carslaw et al., 2010).
Estimates of the potential magnitude of the CLAW feed-back include Gabric et al. (2001) who predicted an in-crease in DMS flux of 1–6 % in the mid-latitude southern oceans from a climate-change scenario, resulting in a radia-tive effect of−0.3 W m−2. From a CO2doubling experiment
in a coupled ocean-atmosphere general circulation model (GCM), Bopp et al. (2004) calculated a 3 % increase in global mean DMS flux leading to a global mean (empirically cal-culated) radiative effect of−0.05 W m−2. Local changes up to −1.5 W m−2 were simulated in the mid-latitude south-ern oceans. A more recent estimate by Gunson et al. (2006) found a radiative effect of −1.8 W m−2 from a doubling
of DMS flux. In a modal microphysical aerosol scheme in a GCM nudged by reanalysis meteorology, by switching off oceanic DMS emission, Thomas et al. (2010) found that the contribution of DMS-derived cloud droplet number (CDN) to radiative effect was −2.0 W m−2. Although these stud-ies demonstrate a significant radiative effect from DMS, this does not necessarily translate to a signficant CLAW feed-back. Current thinking (Woodhouse et al., 2010; Quinn and Bates, 2011) suggests that the CLAW feedback is very weak and not relevant within the present-day climate system.
Wind speed is an important control of DMS flux due to the non-linear (power) relationship between flux and wind speed (e.g. Nightingale et al., 2000). Wind speed is also an important factor in determining mixed layer depth (Mellor and Durbin, 1975), which has been shown by Vallina and Sim´o (2007) to have a strong connection to sea-surface DMS concentration, acting through sunlight penetration and nutri-ent availability. Compiled observational data from the mid-19th century to present-day suggests that alterations in at-mospheric circulation are occurring (Trenberth et al., 2007). For instance, storm tracks have moved poleward, with an in-crease in intensity but dein-crease in total number of storms. Increases in wind speed in the tropical North Atlantic and extra-tropical North Pacific, and decreases in the equatorial Atlantic, tropical South Atlantic, and subtropical North Pa-cific have been observed. Mid-latitude westerlies are also observed to have changed in both hemispheres (Trenberth et al., 2007). Using satellite measurements, Young et al. (2011) found an increase in global wind speeds. Korho-nen et al. (2010) showed that an increase in wind speed of 0.45±0.2 m s−1decade−1at 50–65◦S since the early 1980’s caused a 22 % increase in CCN concentrations at these lat-itudes. They calculated that locally up to 33 % of CCN changes due to changes in wind speed could be due to higher DMS fluxes, with the rest being due to changes in sea-spray. A recent geoengineering suggestion (Wingenter et al., 2007) proposed that by artificially increasing the sea-surface concentration of DMS and thereby increasing the number of CCN, a climate cooling effect related to the first aerosol indi-rect effect (Twomey, 1974) could be achieved. The impact on CCN of this suggestion was modelled by Woodhouse et al. (2008), and found to be much lower than anticipated by Win-genter et al. (2007).
The response of global CCN to changes in DMS has been studied in models. Korhonen et al. (2008) used the sectional microphysical aerosol scheme GLOMAP-bin to show that the main pathway for production of CCN from DMS is through nucleation of H2SO4 in the free
tropo-sphere, followed by coagulation and condensational growth. Korhonen et al. (2008) also found spatial differences in the CCN response when perturbing DMS flux. In a precursor to the study presented here, Woodhouse et al. (2010) inves-tigated the impact on CCN number concentrations of us-ing different sea-surface DMS climatologies in the modal aerosol scheme GLOMAP-mode. A global CCN sensitivity (1CCN/1FluxDMS) of 63 cm−3(mg m−2day−1sulphur)−1
was found, with substantial regional variation (−43 to 166 cm−3(mg m−2day−1sulphur)−1). The wide range was
CLAW feedback is not important in modern-day climate change.
Despite the low CCN sensitivity on a global scale, some regions are sensitive to DMS flux changes (Woodhouse et al., 2010). The strong influence of wind speed on sea-air transfer, the observed changes in regional winds occurring over re-cent decades, and the potential geoengineering application of Wingenter et al. (2007), motivate this study. Here, the same microphysical aerosol scheme as used in Woodhouse et al. (2008) and Woodhouse et al. (2010) is used to explore the CCN sensitivity to regional sea-surface DMS perturbations and the processes that contribute to new CCN. Regions with high and low CCN sensitivities are highlighted and discussed in terms of the controls of CCN sensitivity.
2 Methods
2.1 The aerosol model
We use the modal version of the Global Model of Aerosol Processes, GLOMAP-mode (Manktelow et al., 2007; Mann et al., 2010) in the TOMCAT chemical transport model (Chipperfield, 2006). Meteorological fields in TOMCAT are from European Centre for Medium-Range Weather Forecasts (ECMWF) ERA-40 reanalyses (Uppala et al., 2005) for the year 2000. The spatial resolution is 2.8◦×2.8◦, with 31 ver-tical levels up to 10 hPa. GLOMAP represents seven gas-phase sulphur species, with six-hourly monthly mean fields of NO3, O3, OH and HO2driving DMS and SO2oxidation
(see Spracklen et al., 2005; Manktelow, 2008). GLOMAP contains internal mixtures of sulphate, sea-salt, black carbon (BC) and organic carbon (OC) (including secondary organ-ics). The modal version of GLOMAP was recently shown to compare well with the more detailed sectional version (GLOMAP-bin) by Mann et al. (2012).
Anthropogenic and volcanic emissions are from AeroCom (Dentener et al., 2006), with size assumptions for primary emissions of BC, OC and sulphate as in Stier et al. (2005). Sea-salt emissions are calculated online in the model us-ing the Gong (2003) parameterization between 0.035 and 30.0 µm dry radius. Dust is neglected in this study, as the impact of dust on sulphate aerosol is small, even during a large dust storm (Lee et al., 2009; Manktelow et al., 2010). GLOMAP simulates aerosol microphysical processes such as coagulation, condensation, nucleation, cloud processing, and wet and dry deposition within a two-moment aerosol dy-namics scheme. Aqueous-phase production of sulphate oc-curs through oxidation of SO2 with O3 and H2O2 in grid
boxes containing low cloud according to the International Satellite Cloud Climatology Project monthly mean fields (Rossow and Schiffer, 1999). Only aerosol particles in the soluble modes with a dry radius greater than 37.5 nm are sub-ject to growth from aqueous-phase oxidation.
Binary homogeneous nucleation of sulphuric acid parti-cles is simulated based on Kulmala et al. (1998). Several studies (e.g. Spracklen et al., 2010) have shown that binary homogeneous nucleation cannot explain the boundary layer nucleation (BLN) events frequently seen in a range of envi-ronments (e.g. Kulmala et al., 2004). Yu et al. (2010) com-pared the effect of using different nucleation schemes in a global aerosol model on total aerosol number concentra-tions in the lower troposphere, and found that over remote oceans BLN is not required to explain observed number con-centrations. Korhonen et al. (2008) and Yu and Luo (2009) found that nucleation in the free troposphere and subsequent re-entrainment in the boundary layer is the main source of sulphate particles over the tropical and mid-latitude oceans. Since Merikanto et al. (2009) showed that binary nucleation and primary emissions account for ∼90 % of CCN in the marine boundary layer, we do not include a BLN parame-terization here. GLOMAP-mode using Kulmala et al. (1998) has been verified against marine CN and CCN observations in Mann et al. (2010, 2012) and Woodhouse et al. (2010).
Sea-air DMS fluxes are calculated interactively based on the Kettle and Andreae (2000) observational sea-surface DMS climatology, with the Nightingale et al. (2000) wind speed dependent air-sea flux parameterization, giving an an-nual DMS flux of 18.6 Tg a−1sulphur.
2.2 Experiment setup
To investigate further the global CCN sensitivity (1CCN/1FluxDMS) calculated in Woodhouse et al.
(2010), multiple perturbations to sea-surface DMS concen-tration are applied to 20 patches located as shown in Fig. 2. The patch-perturbations are applied over approximately equal areas (2 million km2, to within 5 %) by increasing or decreasing sea-surface DMS concentrations in relation to the Kettle and Andreae (2000) climatology. When calculating CCN sensitivity, we define CCN as soluble particles larger than 35 nm dry radius, which corresponds to the minimum size particles would activate at∼0.22 % supersaturation.
Simulations are carried out with the sea-surface DMS con-centration increased by +0.5, +1.0, +2.0, +5.0 and +10.0 nM for all patches, and decreases of−0.5, −1.0 and−2.0 nM to some patches, such that the concentration doesn’t become negative. The magnitude of the patch perturbations is guided by the observed DMS responses to ocean iron addition ex-periments, as summarized in Boyd et al. (2007).
NA1
NA2
NA3
SA1
SA2
IO1
IO2 NP3
NP1 NP2
SP1
SP2 SP3
SP4
SO1 SO2 SO3 SO4 SO5 SO6
Fig. 2.The location, size and names of the 20 patches used in this study.
1FluxDMS,abs=FluxDMS,patch−FluxDMS,control (1)
1FluxDMS,rel=1FluxDMS,abs/FluxDMS,control (2)
1CCNabs=CCNpatch−CCNcontrol (3)
1CCNrel=1CCNabs/CCNcontrol (4)
Note that 1CCN values are global surface means (cm−3) and1Flux
DMSvalues are global ocean-only means
(mg m−2day−1sulphur). In this study, there are multiple
sea-surface DMS perturbations for each patch, resulting in multi-ple datapoints on a plot of1FluxDMSvs.1CCN (not shown).
We fit a straight line to these data, deriving the CCN sensi-tivity as the gradient (m) of the fit, and also calculate the Pearson correlation coefficient (r). The majority ofrvalues are very close to 1, suggesting a highly linear relationship between1CCN and1FluxDMSover the range of1FluxDMS
tested. Where ther value is not close to 1, the change in
1CCN is insignificant. We define the absolute CCN sensi-tivity as1CCNabs/1FluxDMS,absand the relative CCN
sen-sitivity as 1CCNrel/1FluxDMS,rel. Thus, the relative CCN
sensitivity is the fractional change in CCN per fractional change in DMS flux. For example, if a 10 % change in DMS flux results in a 1 % change in global mean CCN then rela-tive CCN sensitivity is equal to 0.1. Relarela-tive CCN sensitivity is the most useful metric because most model studies report the % change in DMS flux, and the % change in CCN takes into account the background CCN (from other sources) and is most relevant to cloud albedo.
3 Results and discussion 3.1 Absolute CCN sensitivities
The December mean surface CCN concentration for the con-trol simulation is shown in Fig. 3a. Figure 3b is an exam-ple of the surface CCN response to a +2.0 nM perturbation to the South Pacific patch SP2. The peak CCN response from the patch is∼2 cm−3, and occurs some distance from the patch as additionally nucleated particles are transported while growing to CCN sizes. Another peak in1CCN occurs over the patch and is caused by growth of Aitken mode par-ticles to CCN size. This “double-peak” behaviour was noted in Woodhouse et al. (2008). The global mean CCN response is 0.08 cm−3. The areas of decreased CCN concentration in
Fig. 3 suggest that the CCN response is complex.
The absolute sensitivity of CCN (>35 nm dry ra-dius) to DMS flux perturbations in all 20 patches is shown in the top panels in Fig. 4. There is a large range of sensitivities, varying with month and loca-tion, from 12 cm−3(mg m−2day−1sulphur)−1 (patch SA1) to 261 cm−3(mg m−2day−1sulphur)−1 (SP1), both in December in the Southern Hemisphere (SH). Hemispheric and global mean CCN sensitivities are summarized in Table 1. The June and Decem-ber combined hemispheric mean CCN sensitivity is 80 cm−3(mg m−2day−1sulphur)−1, slightly higher but comparable to the 63 cm−3(mg m−2day−1sulphur)−1mean calculated in Woodhouse et al. (2010).
The mean summer hemisphere CCN sensitivity is 75 cm−3(mg m−2day−1sulphur)−1, compared to the winter
hemisphere value of 82 cm−3(mg m−2day−1sulphur)−1.
These sensitivities are higher than the equiv-alents in Woodhouse et al. (2010), 47 and 78 cm−3(mg m−2day−1sulphur)−1 for summer and winter hemispheres respectively, but repeat the pattern of the winter hemisphere CCN being more sensitive to changes in DMS flux than the summer hemisphere. The contrast in CCN sensitivities between summer and winter hemispheres is less here than in Woodhouse et al. (2010). In the present study, the location of the patches determines the mean sensitivity, so it is difficult to compare with Woodhouse et al. (2010) where are an inhomogeneous global distribution of DMS was perturbed.
3.2 Relative CCN sensitivities
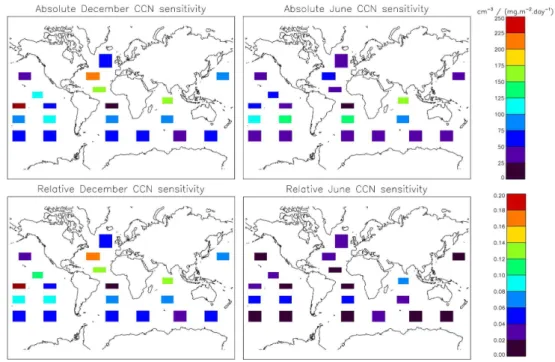
Fig. 3. (a)December mean surface CCN>35 nm concentration for the control simulation and(b) difference in surface CCN>35 nm concentration resulting from the SP2 patch (location indicated by black box) with +2.0 nM DMS perturbation.
Fig. 4.Global mean absolute (top panels) and relative (bottom panels) CCN sensitivities for each patch for December (left) and June (right). The position of the shaded patches on the maps corresponds to the location of the perturbed patch in the experiment. The colour of the patch indicates the global mean sensitivity arising from that patch.
Relative sensitivities lie between <0.01 and 0.22. The efficiency with which DMS adds to global CCN therefore varies by a factor of >20, with a strong spatial depen-dence on where the DMS is emitted. Relative CCN sensitiv-ity means are summarized in Table 1. The combined hemi-spheric June and December mean CCN sensitivity is 0.06, close to the equivalent sensitivity (0.05) calculated in Wood-house et al. (2010) from present-day climatologies. Mean relative summer hemisphere CCN sensitivity here is 0.06, slightly higher than the winter hemisphere sensitivity of 0.05.
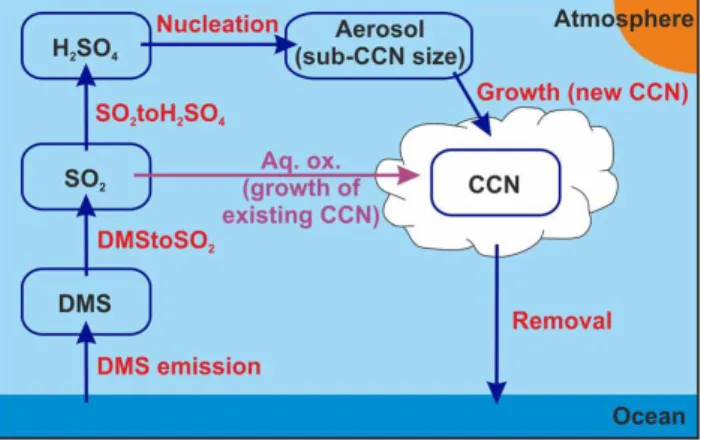
3.3 Microphysical pathways to new CCN
We examine the response of chemical and aerosol processes to the patch perturbations in order to explore the reasons be-hind the spatially variable CCN sensitivities noted in the pre-vious section. The processes considered here are oxidation from DMS to SO2, gas-phase oxidation from SO2to H2SO4,
H2SO4 nucleating to form new particles, growth of
exist-ing particles (condensation of H2SO4 vapour onto the
nu-cleation and Aitken modes), aqueous-phase (in-cloud) oxida-tion of SO2to aerosol sulphate, and aerosol deposition (total
Table 1. Summary of absolute (units cm−3(mg m−2 day−1 sulphur)−1) and relative CCN sensitivities resulting from the DMS flux perturbations.
Absolute Relative Dec Jun Dec Jun Global 94 63 0.08 0.03 NH 115 50 0.09 0.02 SH 85 68 0.07 0.03
in Fig. 5, and can be divided into “production” (those that form new CCN) and “removal” (those that remove CCN) processes. The aqueous-phase oxidation process is classi-fied separately from the production and removal processes, as aqueous-phase oxidation does not lead to the formation of new CCN, but rather adds mass to existing CCN. In contrast to the CCN sensitivities, which are surface level means, the process sensitivities are whole-atmosphere means. Consider-ing whole-atmosphere means is necessary because processes which lead to enhanced CCN near the surface may have oc-curred at different levels in the atmosphere, e.g. nucleation in the model mostly occurs in the free troposphere.
The processes are defined in terms of mass fluxes of sul-phur:
1Fluxprocess,abs=Fluxprocess,patch−Fluxprocess,control (5)
where “process” is one of the processes shown in Fig. 5. As with the CCN sensitivities, the process sensitivities are cal-culated by fitting a straight line to the datapoints on a plot of
1FluxDMSvs.1Fluxprocess,abs(not shown). The majority of
the calculated correlation coefficientsr for these fitted lines are very close to 1 (not shown).
3.4 Microphysical control of CCN sensitivity
As already noted, the two patches with the highest and low-est absolute CCN sensitivities are SP1 in the South Pacific and SA1 in the South Atlantic. Both patches are located at the same latitude (centred on 14◦S), and are located near the centre (longitudinally) of their respective oceans. Despite these similarities, they have very different process sensitivi-ties leading to very different CCN responses.
Like CCN sensitivity, the process sensitivities depend on month and patch location. Figure 6 shows the absolute pro-cess sensitivities. Relative sensitivities are not discussed, as they are strongly influenced by the background rates of each process. Note the different orders of magnitude involved in the absolute process sensitivities. The magnitude of the sen-sitivity does not indicate its importance for CCN in compar-ison with the other sensitivities.
To compare the sensitivities we use the standard scoreZ:
Z=(X−µ)/σ (6)
Fig. 5. Schematic indicating the processes through which DMS-derived sulphur can form new CCN. The aqueous-phase oxidation process is also included (highlighted in purple), despite not forming new CCN.
whereXis the value to be standardized,µis the combined June and December mean, andσ is the combined June and December standard deviation of the process in question. The standard score shows the relationship of the variable to the mean in terms of standard deviations, so that a standard score of one is 1σ above the mean. To understand which processes control CCN sensitivity we plot the CCN sensitivity against the process standard score (Figs. 7 and 8).
The data in Figs. 7 and 8 do not show which process is responsible for a high or low CCN sensitivity in any one patch, but it does give an indication as to the global impor-tance of a process in influencing CCN sensitivity. There is no statistically significant correlation between CCN sensi-tivity standard score and the DMS to SO2 sensitivity
stan-dard score at the 95 % confidence level in either December or June. In December, the SO2 to H2SO4 sensitivity
CCN sensitivity Nucleation sensitivity Growth sensitivity Dep. sensitivity
SO >2H SO sensitivity2 4
DMS>SO2sensitivity Aq. ox. sensitivity
Fig. 6. Absolute sensitivities of processes and CCN. Absolute sensitivities for the different processes cover sev-eral orders of magnitude, and are accounted for by multiplying the value from the plot by the scaling indicated on the y-axis. Units for 1CCNabs/1FluxDMS,abs are cm−3(mg m−2day−1sulphur)−1; 1FluxDMS to SO2,abs/1FluxDMS,abs,
1FluxSO2to H2SO4,abs/1FluxDMS,abs,1FluxNucl.,abs/1FluxDMS,abs,1FluxAq.ox.,abs/1FluxDMS,absand1FluxGrowth,abs/1FluxDMS,abs
are mg m−3 day−1 sulphur (mg m−2 day−1 sulphur)−1;1FluxDep.,abs/1FluxDMS,abs are mg m−2 day−1 sulphur (mg m−2 day−1 sulphur)−1.
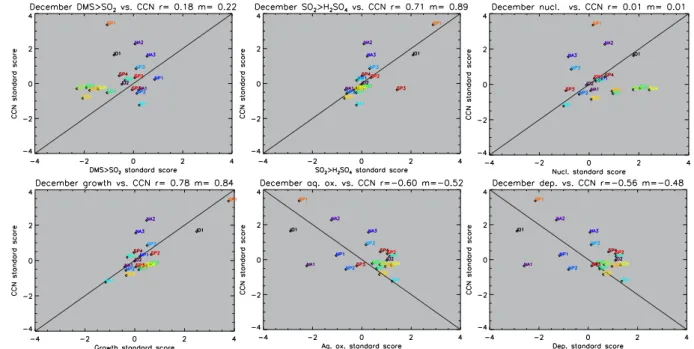
Fig. 7.December standard scores for CCN sensitivities plotted against the process sensitivities for each patch. Also shown are the 1 : 1 line (or negative 1 : 1 line),randmvalues of the linear best fit. The patch names are shown next to their respective datapoints. Colours are used to help differentiate the datapoints from one another.
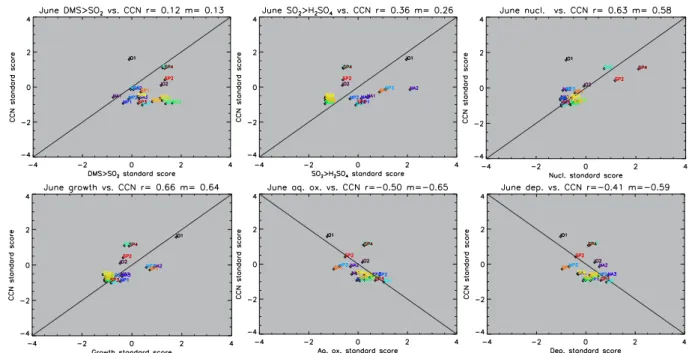
Standard scores for CCN sensitivity are correlated against the aqueous-phase oxidation sensitivity in Figs. 7 and 8. The De-cember Pearson correlation coefficientrin Fig. 7 is−0.60, significant at the 99 % confidence level. In June the correla-tion is−0.50, significant at the 95 % confidence level. These negative correlations confirm that a high aqueous-phase ox-idation rate near the patch restricts CCN production from DMS-derived SO2, leading to a low sensitivity.
The production processes track the stages through which DMS-derived sulphur goes to form new CCN. The correla-tions in Figs. 7 and 8 show a close link between CCN sensi-tivity and the SO2to H2SO4, growth, and aqueous-phase
ox-idation processes. The DMS to SO2oxidation process has
lit-tle influence on CCN sensitivity. The SO2to H2SO4, growth,
and aqueous-phase oxidation processes are closely linked. The fate of SO2is significant, as in order to form new CCN,
Fig. 8.June standard scores for CCN sensitivities plotted against the process sensitivities for each patch. Also shown are the 1 : 1 line (or negative 1 : 1 line),randmvalues of the linear best fit. The patch names are shown next to their respective datapoints. Colours are used to help differentiate the datapoints from one another.
subsequently nucleate new particles or condense onto ex-isting particles, growing them to CCN sizes. Andreae et al. (1999), O’Dowd et al. (1999b) and Yang et al. (2011) have demonstrated from observations that aqueous-phase oxida-tion of SO2is the dominant pathway for sulphate production
in regions of marine stratocumulus clouds. Despite not yield-ing new CCN, aqueous-phase oxidation can influence CCN formation indirectly by diverting SO2away from gas-phase
H2SO4and therefore suppressing condensational growth.
The link between CCN sensitivity and aqueous-phase ox-idation is clear in the patches with the two highest CCN sensitivities (SP1 and NA2 in December). In both of these patches, the aqueous-phase oxidation sensitivity is low, and so does not limit formation of new CCN. Also of interest is patch NA3, situated in the biomass burning outflow from North Africa. Patch NA3 has a high CCN sensitivity, but an aqueous-phase oxidation sensitivity near the mean. It is likely that the high CCN sensitivity of NA3 is the result of the biomass burning aerosol providing an abundant source of Aitken mode particles that are aged and grown to CCN-relevant size.
The effect of aqueous-phase oxidation on CCN sensitiv-ity also explains the uniformsensitiv-ity of DMS to SO2 sensitivity
between different patches compared to the SO2 to H2SO4
sensitivity, which varies over an order of magnitude (Fig. 6). Thus, the competition for SO2 from aqueous-phase
oxida-tion introduces significant variability into the SO2to H2SO4
sensitivities.
4 Conclusions
A global microphysical aerosol model was used to investigate the CCN response resulting from 20 patch perturbations to sea-surface DMS concentra-tion. The study revealed seasonally and spatially vari-able CCN sensitivities (1CCN/1FluxDMS), from 12 to
261 cm−3(mg m−2day−1sulphur)−1. Relative CCN sensi-tivities range from <0.01 to 0.22. A patch in the tropical South Pacific Ocean in December has the highest absolute and relative CCN responses to changes in the DMS flux. The mean CCN sensitivities are comparable to those calculated in Woodhouse et al. (2010), suggesting that the sensitivities are robust after being calculated using two different ap-proaches. The generally low CCN sensitivities calculated in this study and in Woodhouse et al. (2010) suggest that future changes in DMS flux as a result of small-scale changes in phytoplankton activity will not be important for present-day climate change.
There are two implications of our model results for the role of DMS in climate regulation.
significant local implications for DMS flux, due to the strong dependence of DMS flux on wind speed. The co-incidence of these wind speed changes with regions of high CCN sensitivity could therefore be important for CCN concentrations locally. For example, wind speed increases in the tropical North Atlantic and decreases in the sub-tropical North Pacific are coincident with mod-erate to high CCN sensitivities (in December), while the wind speed changes identified in Korhonen et al. (2010) in the Southern Ocean are coincident with low CCN sensitivities. If a changing climate leads to adjust-ments in the location of DMS-producers (e.g. Cameron-Smith et al., 2011), the spatially variable CCN sensi-tivities may cause changes in the production of CCN even for a constant global DMS flux. Cameron-Smith et al. (2011) calculate an increase in DMS flux between 60 and 70◦S of 70 % resulting from an increased CO2 scenario within a coupled climate model with a marine biogeochemical module. However, we have shown here that the Southern Ocean is a region of low CCN sensi-tivity. For the Southern Ocean patches (SO1–6 at 50 to 60◦S) the relative CCN sensitivity is 0.03. Thus a 70 % increase in DMS flux would cause only a 2.1 % increase in CCN. Loss of Arctic sea-ice could also lead to a new source of CCN from DMS (and also sea-salt), poten-tially offsetting the decrease in surface albedo with an increase in cloud albedo. A fully-coupled earth system model, with a comprehensive representation of aerosol and cloud microphysics and detailed marine ecosystem model, is required to study these links further.
2. The sensitivity of CCN to changes in DMS emission is suppressed in regions of low cloud because the DMS-derived SO2 tends to be oxidized in cloud droplets
rather than in the gas-phase, resulting in growth of ex-isting CCN rather than production of new CCN. To be effective in climate regulation, CCN changes in cloudy regions are required, thus the suppression of CCN for-mation in cloudy regions limits the CLAW mechanism. This model-derived result matches the fate of sulphur species in marine stratocumulus clouds observed in field observations Andreae et al. (1999), O’Dowd et al. (1999b) and Yang et al. (2011) and predicted in mod-els (e.g. O’Dowd et al., 1999a). To form new CCN from DMS, SO2must be oxidized in the gas-phase to form
H2SO4which is available for nucleation of new
parti-cles and condensational growth. The representation of aqueous-phase oxidation (and by association, clouds) in microphysical aerosol models will strongly influence the CCN response to DMS flux perturbations.
While the focus of this study has been on CCN response to perturbations to natural DMS emissions, the findings are equally applicable to surface emissions of SO2, e.g. from
anthropogenic sources. For example, variations in the ox-idation pathways of SO2 also influence differences in the
production of CCN from anthropogenic SO2from different
continents (Manktelow et al., 2009). The results are partic-ularly important for CCN production from shipping emis-sions. Although changes in cloud properties are clearly as-sociated with ship tracks (Taylor et al., 2000), the perturba-tions in cloud droplet concentraperturba-tions will be strongly con-trolled by the fraction of SO2 that is oxidized in the cloud
droplets compared to the fraction that forms gas-phase sul-phuric acid. The higher production efficiency of CCN from emissions in cloud-free regions suggests that far-field effects of ship-emitted SO2should be considered. CCN sensitivity
from SO2emitted from volcanoes is likely to be higher than
that from other SO2sources, as continuously degassing
vol-canoes usually emit directly into the free troposphere, where aqueous-phase oxidation is less important (Schmidt et al., 2012).
Acknowledgements. MTW was funded by a NERC
UK-SOLAS CASE studentship with the UK Met Office, and thanks Steven J. Pickering for his help with GLOMAP, Joonas Merikanto for sub-micron sea-salt CCN contributions, and Tom Breider, Lindsay Lee and Anja Schmidt for discussion. The work of OB was supported by the Joint DECC and Defra Integrated Climate Programme – DECC/Defra (GA01101). GWM is an NCAS funded Research Fellow.
Edited by: F. Yu
References
Albrecht, B. A.: Aerosols, cloud microphysics, and fractional cloudiness, Science, 245, 1227–1230, 1989.
Andreae, M. O., Elbert, W., Cai, Y., Andreae, T. W., and Gras, J.: Non-sea-salt sulfate, methanesulfonate, and nitrate aerosol con-centrations and size distributions at Cape Grim, Tasmania RID B-1068-2008, J. Geophys. Res.-Atmos., 104, 21695–21706, 1999. Ayers, G. P. and Cainey, J. M.: The CLAW hypothesis: a review of
the major developments, Environ. Chem., 4, 366–374, 2007. Barnes, I., Hjorth, J., and Mihalopoulos, N.: Dimethyl sulfide and
dimethyl sulfoxide and their oxidation in the atmosphere, Chem. Rev., 106, 940–975, 2006.
Bopp, L., Boucher, O., Aumont, O., Belviso, S., Dufresne, J. L., Pham, M., and Monfray, P.: Will marine dimethylsulfide emis-sions amplify or alleviate global warming? A model study, Can. J. Fish. Aquat. Sci., 61, 826–835, 2004.
Boyd, P. W., Jickells, T., Law, C. S., Blain, S., Boyle, E. A., Bues-seler, K. O., Coale, K. H., Cullen, J. J., de Baar, H. J. W., Follows, M., Harvey, M., Lancelot, C., Levasseur, M., Owens, N. P. J., Pollard, R., Rivkin, R. B., Sarmiento, J., Schoe-mann, V., Smetacek, V., Takeda, S., Tsuda, A., Turner, S., and Watson, A. J.: Mesoscale iron enrichment experiments 1993– 2005: Synthesis and future directions, Science, 315, 612–617, 2007.
Carslaw, K. S., Boucher, O., Spracklen, D. V., Mann, G. W., Rae, J. G. L., Woodward, S., and Kulmala, M.: A review of nat-ural aerosol interactions and feedbacks within the Earth system, Atmos. Chem. Phys., 10, 1701–1737, doi:10.5194/acp-10-1701-2010, 2010.
Charlson, R. J., Lovelock, J. E., Andreae, M. O., and Warren, S. G.: Oceanic phytoplankton, atmospheric sulfur, cloud albedo and cli-mate, Nature, 326, 655–661, 1987.
Chin, M. A. and Jacob, D. J.: Anthropogenic and natural contribu-tions to tropospheric sulfate: a global model analysis, J. Geophys. Res.-Atmos., 101, 18691–18699, 1996.
Chipperfield, M. P.: New version of the TOMCAT/SLIMCAT off-line chemical transport model: intercomparison of stratospheric tracer experiments, Q. J. Roy. Meteorol. Soc., 132, 1179–1203, 2006.
Dentener, F., Kinne, S., Bond, T., Boucher, O., Cofala, J., Gen-eroso, S., Ginoux, P., Gong, S., Hoelzemann, J. J., Ito, A., Marelli, L., Penner, J. E., Putaud, J.-P., Textor, C., Schulz, M., van der Werf, G. R., and Wilson, J.: Emissions of primary aerosol and precursor gases in the years 2000 and 1750 pre-scribed data-sets for AeroCom, Atmos. Chem. Phys., 6, 4321– 4344, doi:10.5194/acp-6-4321-2006, 2006.
Gabric, A. J., Whetton, P. H., and Cropp, R.: Dimethylsulphide pro-duction in the subantarctic southern ocean under enhanced green-house conditions, Tellus B, 53, 273–287, 2001.
Gong, S. L.: A parameterization of sea-salt aerosol source function for sub- and super-micron particles, Global Biogeochem. Cy., 17, 1097, doi:10.1029/2003GB002079, 2003.
Gunson, J. R., Spall, S. A., Anderson, T. R., Jones, A., Totter-dell, I. J., and Woodage, M. J.: Climate sensitivity to ocean dimethylsulphide emissions, Geophys. Res. Lett., 33, L07701, doi:10.1029/2005GL024982, 2006.
Kettle, A. J. and Andreae, M. O.: Flux of dimethylsulfide from the oceans: a comparison of updated data seas and flux models, J. Geophys. Res.-Atmos., 105, 26793–26808, 2000.
Korhonen, H., Carslaw, K. S., Spracklen, D. V., Mann, G. W., and Woodhouse, M. T.: Influence of oceanic dimethyl sul-fide emissions on cloud condensation nuclei concentrations and seasonality over the remote Southern Hemisphere oceans: a global model study, J. Geophys. Res.-Atmos., 113, D15204, doi:10.1029/2007JD009718, 2008.
Korhonen, H., Carslaw, K. S., Forster, P. M., Mikkonen, S., Gor-don, N. D., and Kokkola, H.: Aerosol climate feedback due to decadal increases in Southern Hemisphere wind speeds, Geo-phys. Res. Lett., 37, L02805, doi:10.1029/2009GL041320, 2010. Kulmala, M., Laaksonen, A., and Pirjola, L.: Parameterizations for sulfuric acid/water nucleation rates, J. Geophys. Res.-Atmos., 103, 8301–8307, 1998.
Kulmala, M., Vehkamaki, H., Petaja, T., Dal Maso, M., Lauri, A., Kerminen, V. M., Birmili, W., and McMurry, P. H.: Formation and growth rates of ultrafine atmospheric particles: a review of observations, J. Aerosol Sci., 35, 143–176, 2004.
Lee, Y. H., Chen, K., and Adams, P. J.: Development of a global model of mineral dust aerosol microphysics, Atmos. Chem. Phys., 9, 2441–2458, doi:10.5194/acp-9-2441-2009, 2009. Liss, P. S., Hatton, A. D., Malin, G., Nightingale, P. D., and
Turner, S. M.: Marine sulphur emissions, Philos. T. Roy. Soc. B, 352, 159–168, 1997.
Manktelow, P. T.: Understanding the Complex Behaviour of Tropo-spheric Sulfate in a Global Aerosol Microphysics Model, Ph. D. thesis, School of Earth and Environment, University of Leeds, Leeds, UK, 2008.
Manktelow, P. T., Mann, G. W., Carslaw, K. S., Spracklen, D. V., and Chipperfield, M. P.: Regional and global trends in sul-fate aerosol since the 1980s, Geophys. Res. Lett., 34, L14803, doi:10.1029/2006GL028668, 2007.
Manktelow, P. T., Carslaw, K. S., Mann, G. W., and Spracklen, D. V.: Variable CCN formation potential of re-gional sulfur emissions, Atmos. Chem. Phys., 9, 3253–3259, doi:10.5194/acp-9-3253-2009, 2009.
Manktelow, P. T., Carslaw, K. S., Mann, G. W., and Spracklen, D. V.: The impact of dust on sulfate aerosol, CN and CCN during an East Asian dust storm, Atmos. Chem. Phys., 10, 365–382, doi:10.5194/acp-10-365-2010, 2010. Mann, G. W., Carslaw, K. S., Spracklen, D. V., Ridley, D. A.,
Manktelow, P. T., Chipperfield, M. P., Pickering, S. J., and Johnson, C. E.: Description and evaluation of GLOMAP-mode: a modal global aerosol microphysics model for the UKCA composition-climate model, Geosci. Model Dev., 3, 519–551, doi:10.5194/gmd-3-519-2010, 2010.
Mann, G. W., Carslaw, K. S., Ridley, D. A., Spracklen, D. V., Pringle, K. J., Merikanto, J., Korhonen, H., Schwarz, J. P., Lee, L. A., Manktelow, P. T., Woodhouse, M. T., Schmidt, A., Breider, T. J., Emmerson, K. M., Reddington, C. L., Chipper-field, M. P., and Pickering, S. J.: Intercomparison of modal and sectional aerosol microphysics representations within the same 3-D global chemical transport model, Atmos. Chem. Phys., 12, 4449–4476, doi:10.5194/acp-12-4449-2012, 2012.
Mellor, G. L. and Durbin, P. A.: Structure and dynamics of ocean surface mixed layer, J. Phys. Oceanogr., 5, 718–728, 1975. Merikanto, J., Spracklen, D. V., Mann, G. W., Pickering, S. J.,
and Carslaw, K. S.: Impact of nucleation on global CCN, At-mos. Chem. Phys., 9, 8601–8616, doi:10.5194/acp-9-8601-2009, 2009.
Nightingale, P. D., Malin, G., Law, C. S., Watson, A. J., Liss, P. S., Liddicoat, M. I., Boutin, J., and Upstill-Goddard, R. C.: In situ evaluation of air-sea gas exchange parameterizations using novel conservative and volatile tracers, Global Biogeochem. Cy., 14, 373–387, 2000.
O’Dowd, C. D., Lowe, J. A., and Smith, M. H.: Coupling sea-salt and sulphate interactions and its impact on cloud droplet concen-tration predictions, Geophys. Res. Lett., 26, 1311–1314, 1999a. O’Dowd, C. D., Lowe, J. A., and Smith, M. H.: Observations and
modelling of aerosol growth in marine stratocumulus – case study, Atmos. Environ., 33, 3053–3062, 1999b.
Quinn, P. K. and Bates, T. S.: The case against climate regulation via oceanic phytoplankton sulphur emissions, Nature, 480, 51– 56, 2011.
Rossow, W. B. and Schiffer, R. A.: Advances in understanding clouds from ISCCP, B. Am. Meteorol. Soc., 80, 2261–2287, 1999.
Spracklen, D. V., Pringle, K. J., Carslaw, K. S., Chipperfield, M. P., and Mann, G. W.: A global off-line model of size-resolved aerosol microphysics: I. Model development and prediction of aerosol properties, Atmos. Chem. Phys., 5, 2227–2252, doi:10.5194/acp-5-2227-2005, 2005.
Spracklen, D. V., Carslaw, K. S., Merikanto, J., Mann, G. W., Reddington, C. L., Pickering, S., Ogren, J. A., Andrews, E., Baltensperger, U., Weingartner, E., Boy, M., Kulmala, M., Laakso, L., Lihavainen, H., Kivek¨as, N., Komppula, M., Mi-halopoulos, N., Kouvarakis, G., Jennings, S. G., O’Dowd, C., Birmili, W., Wiedensohler, A., Weller, R., Gras, J., Laj, P., Sellegri, K., Bonn, B., Krejci, R., Laaksonen, A., Hamed, A., Minikin, A., Harrison, R. M., Talbot, R., and Sun, J.: Explain-ing global surface aerosol number concentrations in terms of pri-mary emissions and particle formation, Atmos. Chem. Phys., 10, 4775–4793, doi:10.5194/acp-10-4775-2010, 2010.
Stefels, J., Steinke, M., Turner, S., Malin, G., and Belviso, S.: Envi-ronmental constraints on the production and removal of the cli-matically active gas dimethylsulphide (DMS) and implications for ecosystem modelling, Biogeochemistry, 83, 245–275, 2007. Stier, P., Feichter, J., Kinne, S., Kloster, S., Vignati, E., Wilson, J.,
Ganzeveld, L., Tegen, I., Werner, M., Balkanski, Y., Schulz, M., Boucher, O., Minikin, A., and Petzold, A.: The aerosol-climate model ECHAM5-HAM, Atmos. Chem. Phys., 5, 1125–1156, doi:10.5194/acp-5-1125-2005, 2005.
Taylor, J. P., Glew, M. D., Coakley, J. A., Tahnk, W. R., Platnick, S., Hobbs, P. V., and Ferek, R. J.: Effects of aerosols on the radiative properties of clouds, J. Atmos. Sci., 57, 2656–2670, 2000. Thomas, M. A., Suntharalingam, P., Pozzoli, L., Rast, S.,
Dev-asthale, A., Kloster, S., Feichter, J., and Lenton, T. M.: Quan-tification of DMS aerosol-cloud-climate interactions using the ECHAM5-HAMMOZ model in a current climate scenario, At-mos. Chem. Phys., 10, 7425–7438, doi:10.5194/acp-10-7425-2010, 2010.
Trenberth, K. E., Jones, P. D., Ambenje, P., Bojariu, R., East-erling, D., Klein Tank, A., Parker, D., Rahimzadeh, F., Ren-wick, J. A., Rusticucci, M., Soden, B., and Zhai, P.: Climate Change 2007: The Physical Science Basis. Contribution of Working Group I to the Fourth Assessment Report of the Inter-governmental Panel on Climate Change, chap. 3, Observations: Surface and Atmospheric Climate Change, Cambridge Univer-sity Press, Cambridge, UK, and New York, NY, USA, 2007. Twomey, S.: Pollution and planetary albedo, Atmos. Environ., 8,
1251–1256, 1974.
Uppala, S. M., Kallberg, P. W., Simmons, A. J., Andrae, U., Bech-told, V. D., Fiorino, M., Gibson, J. K., Haseler, J., Hernandez, A., Kelly, G. A., Li, X., Onogi, K., Saarinen, S., Sokka, N., Al-lan, R. P., Andersson, E., Arpe, K., Balmaseda, M. A., Bel-jaars, A. C. M., Van De Berg, L., Bidlot, J., Bormann, N., Caires, S., Chevallier, F., Dethof, A., Dragosavac, M., Fisher, M., Fuentes, M., Hagemann, S., Holm, E., Hoskins, B. J., Isaksen, L., Janssen, P. A. E. M., Jenne, R., McNally, A. P., Mahfouf, J. F., Morcrette, J. J., Rayner, N. A., Saunders, R. W., Simon, P., Sterl, A., Trenberth, K. E., Untch, A., Vasiljevic, D., Viterbo, P., and Woollen, J.: The ERA-40 re-analysis, Q. J. Roy. Meteorol. Soc., 131, 2961–3012, 2005.
Vallina, S. M. and Sim´o, R.: Strong relationship between DMS and the solar radiation dose over the global surface ocean, Science, 315, 506–508, 2007.
Vallina, S. M., Sim´o, R., and Manizza, M.: Weak response of oceanic dimethylsulfide to upper mixing shoaling induced by global warming, Proceedings Of The National Academy Of Sci-ences Of The United States Of America, 104, 16004–16009, 2007.
Wingenter, O. W., Elliot, S. M., and Blake, D. R.: New Directions: enhancing the natural sulfur cycle to slow global warming, At-mos. Environ., 41, 7373–7375, 2007.
Woodhouse, M. T., Mann, G. W., Carslaw, K. S., and Boucher, O.: New Directions: the impact of oceanic iron fertilisation on cloud condensation nuclei, Atmos. Environ., 42, 5728–5730, 2008. Woodhouse, M. T., Carslaw, K. S., Mann, G. W., Vallina, S. M.,
Vogt, M., Halloran, P. R., and Boucher, O.: Low sensitivity of cloud condensation nuclei to changes in the sea-air flux of dimethyl-sulphide, Atmos. Chem. Phys., 10, 7545–7559, doi:10.5194/acp-10-7545-2010, 2010.
Yang, M., Huebert, B. J., Blomquist, B. W., Howell, S. G., Shank, L. M., McNaughton, C. S., Clarke, A. D., Hawkins, L. N., Russell, L. M., Covert, D. S., Coffman, D. J., Bates, T. S., Quinn, P. K., Zagorac, N., Bandy, A. R., de Szoeke, S. P., Zuidema, P. D., Tucker, S. C., Brewer, W. A., Benedict, K. B., and Collett, J. L.: Atmospheric sulfur cycling in the southeastern Pacific longitudinal distribution, vertical profile, and diel vari-ability observed during VOCALS-REx, Atmos. Chem. Phys., 11, 5079–5097, doi:10.5194/acp-11-5079-2011, 2011.
Young, I. R., Zieger, S., and Babanin, A. V.: Global trends in wind speed and wave height, Science, 332, 451–455, 2011.
Yu, F. and Luo, G.: Simulation of particle size distribution with a global aerosol model: contribution of nucleation to aerosol and CCN number concentrations, Atmos. Chem. Phys., 9, 7691– 7710, doi:10.5194/acp-9-7691-2009, 2009.