1
Impacts of climate and land use changes on the hydrological and erosion
1processes of two contrasting Mediterranean catchments
23
D. Serpa 1, J.P. Nunes 1,*, J. Santos 1, E. Sampaio2, R. Jacinto 1, S. Veiga2, J.C. Lima2, M. Moreira2, J. 4
Corte-Real2, J.J. Keizer 1, N. Abrantes 1 5
6
1CESAM & Department of Environment and Planning, University of Aveiro, Campus de Santiago, 7
3810-193 Aveiro, Portugal. 8
2ICAAM – Institute of Mediterranean Agricultural and Environmental Sciences, University of Évora, 9
Apartado 94, 7006-554 Évora, Portugal. 10
11
Correspondence to: [email protected] 12
13
Keywords: hydrology; erosion; Mediterranean; climate change; land use change 14 15 16 17 18 19 20 21 22 23 24 25 26
2 Abstract
27
The impacts of climate and land use changes on streamflow and sediment export were evaluated 28
for a humid (São Lourenço) and a dry (Guadalupe) Mediterranean catchment, using the SWAT 29
model. SWAT was able to produce viable streamflow and sediment export simulations for both 30
catchments, which provided a baseline for investigating climate and land use changes under the 31
A1B and B1 emission scenarios for 2071-2100. Compared to the baseline scenario (1971-2000), 32
climate change scenarios showed a decrease in annual rainfall for both catchments (humid: -12%; 33
dry: -8%), together with strong increases in rainfall during winter. Land use changes were derived 34
from a socio-economic storyline in which traditional agriculture is replaced by more profitable land 35
uses (i.e. corn and commercial forestry at the humid site; sunflower at the dry site). Climate change 36
projections showed a decrease in streamflow for both catchments, whereas sediments export 37
decreased only for the São Lourenço catchment. Land use changes resulted in an increase in 38
streamflow, but the erosive response differed between catchments. The combination of climate 39
and land use change scenarios led to a reduction in streamflow for both catchments, suggesting a 40
domain of the climatic response. As for sediments, contrasting results were observed for the humid 41
(A1B: -29%; B1: -22%) and dry catchment (A1B: +222%; B1: +5%), which is mainly due to differences 42
in the present-day and forecasted vegetation types. The results highlight the importance of climate-43
induced land-use change impacts, which could be similar to or more severe than the direct impacts 44
of climate change alone. 45 46 47 1 Introduction 48 49
The impact of changes in climate and land cover on watershed dynamics has been well established 50
worldwide. Among the most important impacts from a watershed management perspective are 51
potential alterations to the hydrological (Bangash et al., 2013; Kalantari et al. 2014; Khoi and 52
3 Suetsugi, 2014; Luo et al., 2013; Mango et al., 2011; Milly et al., 2005; Montenegro and Ragab, 53
2012; Mourato et al., 2015; Wilson and Weng, 2011) and erosive response (Bangash et al., 2013; 54
García-Ruiz et al. 2013; Khoi and Suetsugi, 2014; Lu et al., 2013; Vanmaercke et al., 2011; Wilson 55
and Weng, 2011). These changes will in turn affect the ecosystem service functioning of 56
watersheds, such as water provisioning and erosion control (Bangash et al., 2013). 57
The Mediterranean Basin has been identified as one of the most vulnerable regions of the 58
world to climate change, and the Intergovernmental Panel on Climate Change’s Fifth Assessment 59
Report points to projected changes to both the hydrological and erosive response of watersheds 60
due to future shifts in precipitation and temperature regimes (IPCC, 2013). Under the projected 61
climate changes, runoff is expected to decrease (IPCC, 2007, 2013; Nunes et al., 2008) as a result of 62
lower rainfall, higher soil water deficits, and higher potential evapotranspiration (PET) (Molina-63
Navarro et al., 2014; Nunes et al., 2008, 2013), thereby leading to a decrease in streamflow (Lopéz-64
Moreno et al., 2011, 2014; Molina-Navarro et al., 2014). As for soil erosion, there is greater 65
heterogeneity in the trends across the Mediterranean Basin, as the processes linking climate and 66
erosion are dependent on a number of variables; including rainfall amount and intensity, soil water 67
content, evapotranspiration, and plant cover(García-Ruiz et al. 2013; Nearing et al., 2005; Nunes 68
and Nearing, 2011). 69
The magnitude of climate change impacts on hydrological and erosion processes is expected 70
to be strongly influenced by land use/cover, as this driver per se is known to strongly influence these 71
processes (Cerdan et al. 2010; García-Ruiz and Lana-Renault, 2011; García-Ruiz et al. 2013; Nunes 72
and Nearing, 2011). Several studies conducted in the Mediterranean Basin have indicated that the 73
hydrological behaviour of different land-cover types is linked to the existing vegetation and to its 74
spatial and seasonal variation patterns (García-Ruiz and Lana-Renault, 2011; López-Vicente et al., 75
2013; Nunes et al., 2010, 2011). For example, a rise in shrub and forest cover has been reported to 76
produce a decline in surface runoff and streamflow discharge (Begueria et al., 2003; Gallart and 77
Llorens, 2004; García-Ruiz and Lana-Renault, 2011). Land cover also affects soil erosion, as land with 78
4 permanent vegetation cover (shrub, grassland, or forest) typically has lower soil losses and 79
sediment yields than an arable land (Cerdan et al. 2010; García-Ruiz, 2010). 80
While it is important to consider the individual effects of climate and land use change on 81
hydrological and erosion processes, assessing how their combined effects will interact is crucial for 82
assessments of the future state of water resources (Hoque et al., 2014; Khoi and Suetsugi, 2014; Li 83
et al., 2004; Li et al., 2009; Li et al. 2012). For the Mediterranean region, only a few modelling studies 84
have addressed the combined effects of these drivers (e.g. López-Moreno et al., 2014; Molina-85
Navarro et al., 2014). Most studies have focused on the effects of climate change without 86
considering land use/cover change as well (Nunes et al., 2008, 2013; Bangash et al., 2013; 87
Kalogeropoulos and Chalkias, 2013; Zabaleta et al., 2014). Others have only evaluated the impacts 88
of land use changes without considering future climate conditions (De Girolamo and Lo Porto, 2012; 89
López-Vicente et al., 2013; Nunes et al., 2011). 90
All climate and land use change assessment studies have associated uncertainties in the model 91
results and the selected scenarios (see e.g. Ludwig et al., 2010, for a discussion on this issue). 92
Uncertainties in observed data can mislead model calibration (McMillan et al., 2010; Sellami et al., 93
2013), and the existence of multiple acceptable model formulations and/or parameterizations can 94
lead to different results for different climate conditions (Beven, 2012; Lespinas et al., 2014). 95
Calibrated model parameters often compensate for shortcomings in the model structure and errors 96
in data (Lespinas et al., 2014). Therefore, uncertainty issues can be partly overcome by restricting 97
possible parameter values through direct measurement, by using multiple observed variables in the 98
calibration process (Beven, 2012; Efstratiadis and Koutsoyiannis, 2010), and by evaluating the 99
model for a large range of climatic conditions (Beven, 2012; Xu and Singh, 2004). 100
Scenario uncertainties include different projections of socio-economic conditions and 101
greenhouse gas emission (IPCC, 2007, 2013); different response of climate to greenhouse gas 102
concentrations given by different Global Circulation Models (GCMs); different climate downscaling 103
results according to the selection of Regional Climate Models (RCMs) or statistical approaches 104
5 (Deidda et al., 2013; Maraun et al., 2010); or different land-use scenarios according to different 105
interpretations of future socio-economic conditions (e.g. Stigter et al., 2015). The variability 106
between these scenarios for the Mediterranean can lead to quite different projections of 107
hydrological change (Majone et al., 2015; Piras et al., 2014; Stigter et al., 2014). To mitigate this 108
issue, a smaller number of future scenarios (or even hypothetical scenarios) can be analyzed to 109
detail particular impacts, becoming in effect a study of sensitivity to climate and land use change 110
(Nunes et al., 2008, 2013; Xu and Singh, 2004). 111
In this work, the impacts of climate and land use changes on streamflow discharge and 112
sediment export were evaluated both individually, to assess the relative strength of their impacts; 113
and in an integrated manner, to provide a more realistic assessment of future (combined) impacts. 114
This study was performed in two small experimental Portuguese basins (i.e. a paired-catchment 115
approach), one located in a humid region (São Lourenço) and the other in a dry region (Guadalupe). 116
These catchments were selected because: (i) each catchment is representative of the landscapes in 117
their region (i.e. north-western and interior-southern Portugal); (ii) the responses to climate and 118
land use changes are expected to differ in each of these regions due to their contrasting climate, 119
soil, and land cover characteristics; and (iii) the availability of several measured parameters and 120
hydrological variables reduces model uncertainty. A limited number of climate and land use 121
scenarios were selected to evaluate the sensitivity of the study sites to these changes. 122
The specific objectives of the present study were: 123
i) to calibrate and validate the Soil Water Assessment Tool model (SWAT) for the São Lourenço 124
and Guadalupe basins; 125
ii) to simulate the separate responses of stream discharge and sediment export for two 126
scenarios of climate and land use change; 127
iii) to evaluate the effects of two scenarios combining changes in climate and land use. 128
129
2 Methodology 130
6 131
2.1 Study sites 132
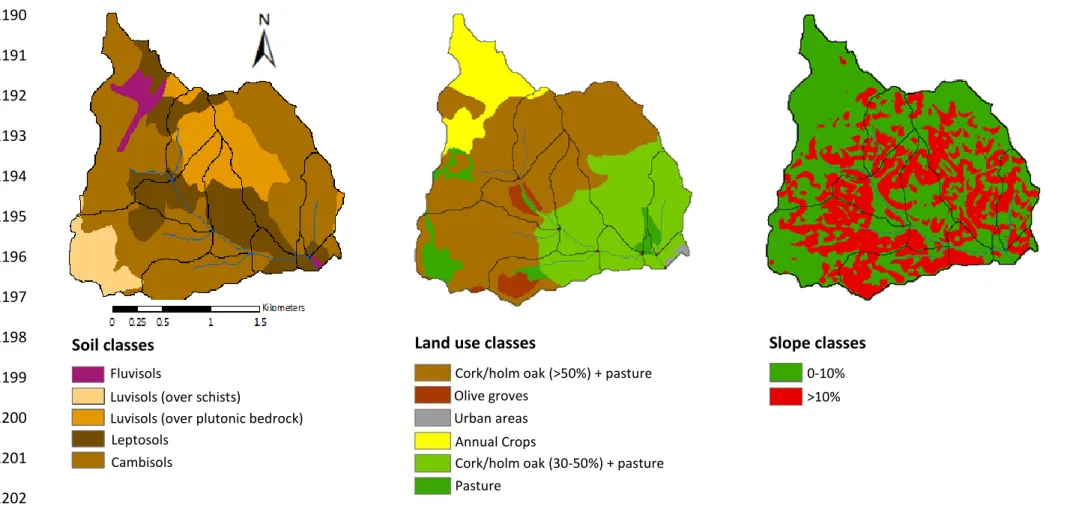
The present work was carried out in two small agro-forested catchments in Portugal. The humid 133
catchment – São Lourenço (6.20 km2; Coordinates: 40° 25' 58''N; 8° 30' 6''W)is located in North 134
Central Portugal (Fig. 1), whereas the dry catchment – Guadalupe (4.49 km2; Coordinates: 38° 34’ 135
39’’N; 8° 2’ 26’’W) – is located in South Eastern Portugal (Fig. 1). 136
Due to its proximity to the sea, São Lourenço is significantly influenced by the Atlantic Ocean, 137
resulting in mild and wet winters with strong precipitation events and warm and dry summers. The 138
average annual rainfall and temperature in the region (1973 - 2012) was 925 mm and 15.7 °C 139
(SNIRH, 2014a). Elevations range from 40 m a.s.l. to 100 m a.s.l and gentle slopes (<5%) dominate 140
the area (Fig. 2). The soils are dominated by Humic Cambisols (50%) with high depth and high 141
organic matter content; with a significant proportion of Chromic Luvisols (23%) and Calcaric 142
Cambisols (18%) in the watershed (Fig. 2; DGADR, 2013). As part of an important Portuguese 143
winegrowing region – the Bairrada – almost half of the São Lourenço basin is occupied by vineyards 144
whereas the remaining area is mostly maritime pine plantations and annual rain-fed crops, such as 145
corn, potato, and pasture (Fig 2). 146
In contrast, Guadalupe has typical inland Mediterranean climate, characterized by highly 147
variable rainfall, few flood events, and an ephemeral watercourse. The average annual rainfall and 148
temperature (1973 - 2012) in Guadalupe was considerably drier (533 mm) than São Lourenço, but 149
differed little in temperature (15.5 °C) (SNIRH, 2014a). The watershed is dominated by moderate 150
slopes (10%) (Fig. 3), and is located between 260 to 380 m a.s.l.. The predominant soils are relatively 151
shallow Cambisols (54%), Luvisols (22%), and Leptosols (21%), which are associated with the intense 152
agricultural production of the watershed in the last decades. This land use has led to severe 153
problems of land degradation, and the area has been identified as having a high risk of 154
desertification (Nunes et al., 2008). As in other dry regions of southern Portugal and Spain, 155
7 Guadalupe is dominated by the “montado” agro-forestry system, where open cork oak stands are 156
interspersed with annual crops and pastures (Fig. 3). 157
158
2.2 Hydrological modelling 159
The SWAT model (Neitsch et al., 2011) has been widely applied to different size watersheds and 160
applications all over the world, including assessments of the effects of climate and land-cover 161
change on water quantity and soil erosion (SWAT Database, 2014). 162
SWAT is a conceptual, time-continuous and semi-distributed hydrologic model initially 163
developed to predict changes in landscape management practices on water, sediment, and 164
chemical yields (Arnold et al., 1998; Neitsch et al., 2011). However, its structure also allows SWAT 165
to explicitly account for climate and land use changes. For instance, the model is able to simulate 166
the impacts of temperature changes and soil water deficit on vegetation growth, as well as the 167
effects of climate change on the water balance, and therefore on the processes controlling surface 168
and base flow generation (Neitsch et al., 2011). By simulating changes in vegetation and runoff, 169
SWAT is also able to predict the erosive response. Regarding the effects of land use changes, the 170
model allow for simulation of alternative land use distributions, which in turn affects all the other 171
processes, i.e. water balance, runoff generation, and soil erosion (Neitsch et al., 2011). 172
SWAT typically operates on a daily time step and accounts for spatial heterogeneities by 173
dividing the watershed into sub-basins, which are further divided into one or more Hydrologic 174
Response Units (HRUs). Each HRU consists of a unique combination of soil, slope, and land use. 175
The hydrological component of SWAT calculates the daily water balance for each HRU. The 176
model takes into account precipitation, evapotranspiration, soil water balance, surface runoff, 177
subsurface runoff, and aquifer recharge. From the available methods for calculating 178
evapotranspiration in SWAT, the Hargreaves method (Hargreaves et al., 1985) was selected for the 179
present study. Regarding runoff, the model uses the Soil Conservation Service Curve Number 180
method (SCS, 1985) to estimate surface runoff and a kinematic percolation model to predict 181
8 subsurface runoff (Neitsch et al., 2002). Predictions of peak runoff rates for each HRU are made 182
using the rational method (Neitsch et al., 2002). Once the model determines the water loadings 183
from each HRU, the water flow is routed through the main channel using the variable storage 184
coefficient method (Neitsch et al., 2011). 185
In SWAT, soil erosion is calculated according to the Modified Universal Soil Loss Equation – 186
MUSLE (Neitsch et al., 2011). Sediment loadings from each HRU are then summed at the sub-basin 187
level, and the resulting loads are routed by streamflow and distributed to the watershed outlet. 188
Sediment transport in the channel network is controlled simultaneously by deposition and 189
degradation processes, which depend on the sediment loads coming from upland areas and on the 190
channel transport capacity. 191
A complete description of the SWAT model and theory can be found in Neitsch et al. (2011) 192
and Arnold et al. (2011). 193
194
2.2.1 Model set-up and input data 195
SWAT requires as input hydro-meteorological data, a land-cover map, a soil map, and a Digital 196
Elevation Model (DEM); the source of which for the present study is summarized in Table 1. After 197
data compilation, ArcSWAT version 9.3 (Neitsch et al., 2011) was used for watershed delineation 198
and sub-basin discretization using the DEM. In both watersheds, 10 sub-basins were delimited and 199
then divided into multiple HRUs (123 in São Lourenço and 107 in Guadalupe) according to the land 200
cover, soil types, and slope classes presented in Figs. 2 and 3. 201
Prior to running the model, SWAT databases (Soils, Land Cover/Plant Growth, Fertilizers, 202
Urban) were modified to account for the specific characteristics of each watershed. Soil 203
parameterization was performed according to the existing literature on Portuguese soils (Cardoso, 204
1965, 1973) and the data collected on soil properties (i.e. soil depth, soil texture, organic matter 205
content, bulk density, hydraulic conductivity) in several soil surveys carried out at the two 206
catchments. As for land cover, parameterization was done according to the literature for 207
9 Mediterranean vegetation and crops (Nunes et al., 2008). Information on agricultural and 208
fertilization practices as well as other management operations was obtained from the data 209
published by the Portuguese Ministry of Agriculture (INIA-LQARS, 2000). 210
211
2.2.2 Model calibration, validation and performance evaluation 212
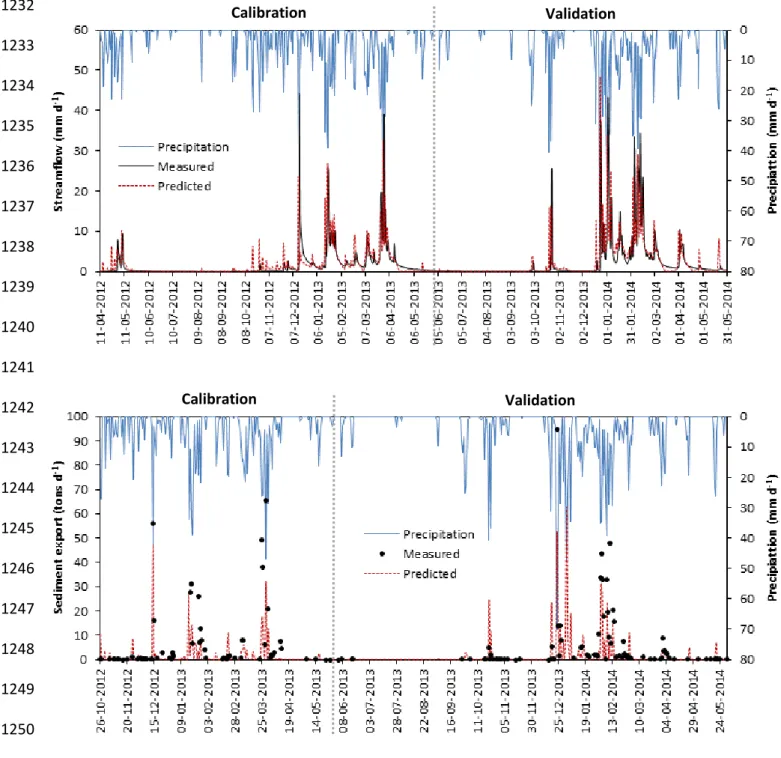
SWAT was calibrated and validated against streamflow and sediment data collected at the São 213
Lourenço and Guadalupe hydrometric stations, which were installed on April 2012 and April 2011, 214
respectively. Daily streamflow was calculated based on water levels recorded at a 2 minute 215
frequency, and the stage-discharge curve of each basin, which in São Lourenço was measured in an 216
artificial regular channel. Daily sediment data for São Lourenço was obtained by interpolating the 217
measured values of total suspended solids (TSS) in water samples collected by an ISCO3700 218
automatic sampler triggered by a water level sensor through a CR200 data-logger (Campbell 219
Scientific®). The sediment data for Guadalupe was estimated using an OBS-3 optical turbidity sensor 220
(continuous measurements) linked to a CR800 data-logger (Campbell Scientific®), which was 221
calibrated using TSS data from stream water samples collected at various intervals. For São 222
Lourenço, 1-year of data was used for model calibration (May 2012 – May 2013) and another for 223
model validation (May 2013 – May 2014). For Guadalupe, the two periods differed in duration; ca. 224
1.5 years for calibration (September 2011 – May 2013) and 1 year for validation (May 2013 – May 225
2014). Prior to calibration, both models were warmed-up (São Lourenço – 15 years; Guadalupe – 9 226
years) to eliminate initial bias, taking advantage of existing meteorological data. 227
In addition to the streamflow and sediment records, measurements of runoff, erosion and soil 228
moisture were also calibrated. These were conducted at 6 experimental plots implemented in the 229
vineyard and montado area of the São Lourenço and Guadalupe catchments, respectively. For 230
Guadalupe, actual evapotranspiration, leaf area index, and biomass of pasture and montado were 231
also calibrated using data from 2 eddy covariance towers (Gilmanov et al., 2007; Paço et al., 2009; 232
Reichstein et al., 2003). Model calibration was performed manually and on a daily time step; 233
10 streamflow was first calibrated independently, and then was slightly adjusted during a subsequent 234
calibration of sediment yield. The calibrated model parameters are presented in Table 2. 235
Model performance, defined as the goodness of fit between observed and predicted 236
streamflow and sediment export, was evaluated using the Nash-Sutcliffe coefficient (NSE), and the 237
ratio between the Root Mean Square Error and the sample standard deviation (RSR) (Moriasi et al., 238
2007). The magnitude of model errors compared to observations was evaluated by the percent of 239
bias, PBIAS (Moriasi et al., 2007). Positive PBIAS values indicate model underestimation, whereas 240
negative values indicate overestimation. According to Moriasi et al. (2007), NSE values greater than 241
0.5 and RSR values below 0.7 indicate reasonable model performance for monthly simulations of 242
streamflow and sediment export. PBIAS values below 25% for streamflow and below 55% for 243
sediments are also considered reasonable (Moriasi et al., 2007). 244
245
2.3 Climate change scenarios 246
Climate change scenarios were developed for the period between 2071 and 2100, using the 247
ECHAM5 GCM (Roeckner et al., 2003) driven by the A1B (more severe) and B1 (more moderate) 248
emission scenarios, defined by Nakićenović and Swart (2000). GCM simulations were then 249
statistically downscaled to obtain local daily predictions of rainfall and temperature (Fig. 4), using 250
the predictor transformation approach (Maraun et al., 2010). This methodology is described in 251
detail by Veiga (2013), and uses Mean Sea Level Pressure (MSLP) in the Atlantic Ocean as a predictor 252
since it is related with climate in Portugal (e.g. Corte-Real et al., 1998). The methodology consists 253
of three consecutive steps: 254
1) A relationship was established between the historical MLSP in the Atlantic Ocean (Compo et 255
al., 2011) and rainfall and temperature at two meteorological stations: Coimbra (close to S. 256
Lourenço) and Évora (close to Guadalupe). The relationship with rainfall was determined for 1950-257
2000 at the seasonal scale using canonical correlation analysis, while the relationship with 258
11 temperature was determined for 1970-2000 at the monthly scale using stepwise multiple linear 259
regressions. 260
2) Future MSLP was estimated from anomalies between ECHAM5 predictions for 2071-2100 and 261
1971-2000 (reference period) for both the A1B and B1 scenarios. The resulting MSLP predictions 262
were used to calculate a first estimate of future seasonal rainfall and monthly temperature using 263
the above-mentioned relationship. The final estimate of seasonal rainfall and monthly temperature 264
was calculated from anomalies between MSLP-based estimates for 2071-2100 and 1971-2000 for 265
A1B and B1. 266
3) Daily rainfall and temperature were calculated using the fragments method (Svanidze, 1977). 267
Each future prediction of seasonal rainfall and monthly temperature was compared with the closest 268
period in the historical observations, and the daily values of the historical periods were used to 269
represent the daily values of the future periods. 270
Since this method did not predict noticeable changes to temperature, the resulting daily time-271
series was further adjusted by adding a fixed anomaly to each day (following Kilsby et al., 2007), 272
which were selected conservatively as the lower bound of forecasts for each study site by the 273
Regional Climate Models used in projects PRUDENCE (Déqué et al., 2005) and ENSEMBLES (Van Der 274
Linden and Mitchell, 2009). The added anomaly was 2.2ºC for the A1B scenario and 1.1ºC for the B1 275
scenario. 276
277
2.4 Land use change scenarios 278
Land use scenarios for both catchments were defined according to the methodology applied by 279
Jacinto et al. (2013), which is shown in Fig. 4. The first step consisted in a linear downscaling of 280
European trends for generic land use types in Portugal (IPCC, 2007; Rounsevell et al., 2006; Verburg 281
et al., 2006). These scenarios forecast a decrease of agricultural area in Portugal for 2100, of 73% 282
and 54% for emissions scenario A1B and B1 respectively, and suggest a number of possible land-283
cover type replacements including forestry and crops for bio-fuel production. 284
12 Local trends were then defined based on an analysis of historical land use patterns in order to 285
capture the socio-ecological characteristics of both study sites (Graffin et. al, 2004). This included 286
an analysis of literature of agriculture and forest change (e.g. Jones et al., 2011; Moreira et al., 2001; 287
Tavares et al., 2012), and a comparison of land use between 1990, 2000, and 2006 using Corine 288
land cover maps. These trends were used to identify patterns of land use change in the second half 289
of the 20th century (a period of large-scale agricultural abandonment and afforestation in Portugal) 290
to provide further insights on which types of agricultural areas would preferentially be abandoned 291
at each study site, and what the likely replacing land uses would be. 292
Finally, the socio-economic trends used to generate scenarios A1B and B1 were analyzed to gain 293
insight into the driving forces behind land use changes, taking into account that the A1B scenario 294
would put greater emphasis on economic value while the B1 scenario would also emphasize nature 295
conservation values (IPCC, 2007). Generic land use change rules for A1B and B1 were created from 296
IPCC (2007), Rounsevell et al. (2006) and Verburg et al. (2006). These generic rules were combined 297
with the local trend analysis to define: (i) the most likely crops subject to abandonment in the A1B 298
and B1 scenarios, assuming a similar degree of abandonment as forecasted at the Portuguese scale; 299
and (ii) likely replacement land-cover or crops in the A1B and B1 scenarios. This approach ensured 300
consistency between climate and land use changes since land use scenarios followed the same 301
storylines as climate change scenarios. 302
303
3 Results 304
305
3.1 Model calibration and validation 306
The model results based on the performance indicators considered in the present study are shown 307
in Table 3. A good agreement was found between observed and predicted monthly streamflow for 308
both catchments and for both the calibration and validation period. The sediment export predicted 309
for São Lourenço fit reasonably well with the measured values, despite some model 310
13 underestimation in both the calibration (PBIAS = 28%) and validation period (PBIAS = 32%). For the 311
sediment export in the Guadalupe catchment, model performance might be considered reasonable 312
for the validation period but not for the calibration period (Table 3). 313
Model performance for daily streamflow and sediment export (Figs. 5 and 6) was worse than 314
for monthly values, particularly in Guadalupe (Table 3). 315
316
3.2 Future scenarios 317
3.2.1 Climate change scenarios 318
Compared to the baseline period of 1971 to 2000, the forecasts for 2071 to 2100 indicated a small 319
decrease in annual rainfall for both São Lourenço (ca. 12%) and Guadalupe (ca. 8%) together with 320
higher rainfall in winter, on average 19% and 40% respectively, for the humid and dry catchment 321
(Fig. 7). For both catchments, the A1B and B1 scenarios differed mainly in seasonal rainfall 322
distribution, but not in the annual rainfall volumes (Fig. 7). Due to the downscaling method used 323
(see Section 2.3), the same changes in average annual temperature were predicted for the two 324
catchments (Fig. 7): an increase of 2.2°C was forecasted for scenario A1B as opposed to an increase 325
of 1.1°C for scenario B1. 326
327
3.2.2 Land use change scenarios 328
Future land use changes for the São Lourenço and Guadalupe catchments are presented in Tables 329
4 and 5, respectively. In accordance with the forecasts for Portugal as described earlier, a large 330
decrease in agricultural lands for food production was assumed under scenarios A1B and B1, but 331
with a larger change in the A1B scenario. 332
The differences between the study sites are related to the different historical land use change 333
trends in the latter half of the 20th century, as described above. In the northern region, traditional 334
agricultural crops such as potato and pastures were predicted to be replaced primarily by corn (for 335
biofuel production) and by commercial forests (Table 4), all of which are already present locally. In 336
14 the southern region, traditional crops (wheat and other cereals) and pasture are predicted to be 337
replaced by sunflower for biofuel production and abandoned to become shrublands (Table 5). 338
While sunflower is not present locally, it is cultivated in other places in southern Portugal and has 339
a high potential to tolerate the warmer and drier conditions forecasted under climate change 340
(Camacho-B et al., 1974). 341
The differences between the A1B and B1 scenarios are related to their storylines, also as 342
described above. Hence the A1B scenario is more focused on economic development, whereas the 343
B1 scenario is more directed towards environmentally-friendly options (IPCC, 2007). Under scenario 344
A1B, the existing permanent pastures and mixed forests in São Lourenço were foreseen to be 345
converted into eucalypt forests, because this is a more valuable species from the economic point 346
of view. Under the B1 scenario these areas were converted into pine forests, as it is a more 347
appropriate species from an environmental point of view (Table 4). Likewise, small vineyard areas 348
in São Lourenço were assumed to be replaced by corn and eucalypt plantations under the A1B 349
scenario and to be maintained under scenario B1. 350
For Guadalupe, the areas permanently occupied by pastures were assumed to be converted 351
into sunflower plantations to a much larger extent under the A1B scenario than under the B1 352
scenario (Table 5). As for pastures associated with the “montado” system, in areas where oak cover 353
is currently less than 50%, pastures were assumed to be fully converted into sunflower plantations 354
under the A1B scenario, but maintained under the B1 scenario. In areas with more than 50% oak 355
cover, pastures were assumed to be abandoned and naturally replaced by Mediterranean 356
shrublands for both scenarios. 357
358
3.3 Effects of climate changes 359
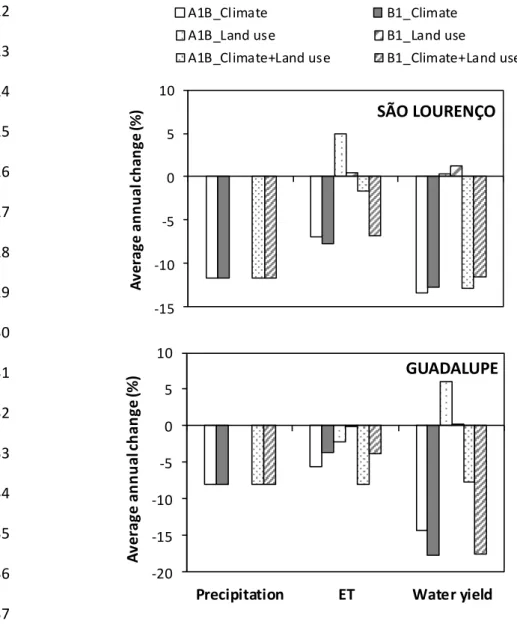
Under both climate change scenarios, annual streamflow was forecasted to decrease by 13% in the 360
São Lourenço basin (Fig. 8). This decrease in streamflow was accompanied by large decreases in 361
actual evapotranspiration (ET) by the main land cover types of vine (-10 to -11%) and maritime pine 362
15 (-7 to -8%), as shown in Table 6. In Guadalupe, the reduction in streamflow was higher (Fig. 8), from 363
a 14% reduction in the A1B scenario, to an 18% decrease in the B1 scenario. However, the decreases 364
in actual ET from the main land cover types of oak (-4 to -6%) and pasture (-4 to -5%) were smaller 365
than in the humid catchment (Table 7). 366
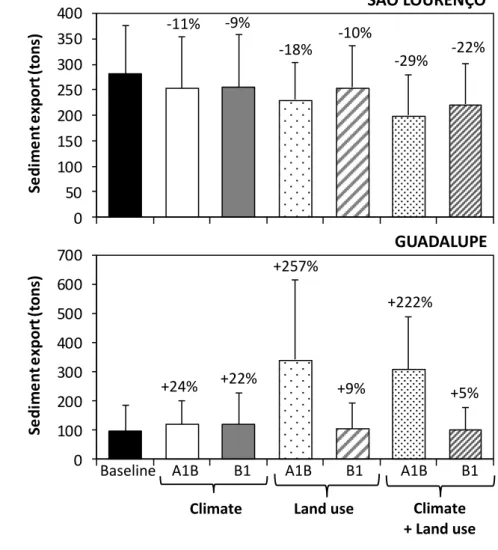
Regarding sediment export, the model predicted a decrease of 9% in the A1B scenario and of 367
11% in the B1 scenario for the São Lourenço basin (Fig. 9). For Guadalupe, an increase in sediment 368
export of 24% and 22% was forecasted for the A1B and the B1 scenarios respectively (Fig. 9). 369
370
3.4 Effects of land use changes 371
In contrast to the predicted climate change impacts, land use changes led to a small increase in 372
average annual streamflow for both catchments (São Lourenço: 0.2 – 1%; Guadalupe: 0.3 – 6%) 373
under both scenario A1B and B1 (Fig. 8). 374
Sediment export exhibited different behaviors in the two catchments. In São Lourenço, a 375
decrease of 10% (B1 scenario) and 18% (A1B scenario) in annual sediment export was predicted 376
due to land use changes (Fig. 9). In Guadalupe, erosion was forecasted to increase for both 377
scenarios, by 257% in the A1B scenario and by 9% in the B1 scenario. 378
379
3.5 Combined effects of climate and land use changes 380
For both basins, the decrease in streamflow caused by climate change was offset by the increase 381
caused by land use changes (Figs. 8 and 10). In São Lourenço, the streamflow reduction was greater 382
under the A1B scenario, whereas in Guadalupe the reduction was greater under the B1 scenario 383
(Fig. 8). 384
The decrease in sediment export caused by climate change in São Lourenço was cumulative 385
with the decrease caused by the land use change, leading to an overall reduction of 29% and 22%, 386
for scenario A1B and B1 respectively (Fig. 9). For Guadalupe, by contrast, the increase caused by 387
climate change did not added up to the increase caused by land use change. In this catchment, the 388
16 overall change in sediment export relative to the baseline scenario amounted to an increase of 389
222% for scenario A1B and of 5% for scenario B1 (Fig. 9). 390 391 4 Discussion 392 393 4.1 Model performance 394
Based on the criteria for model performance established by Moriasi et al. (2007), the model 395
adequately simulated monthly streamflow discharge in both catchments (Table 3). The model also 396
adequately simulated sediment export in São Lourenço, despite some underestimation in both the 397
calibration and validation periods (Table 3). This underestimation may be in part due to the method 398
of estimating sediment export, as there was not a continuous measurement of sediment 399
concentrations in this basin. 400
Monthly sediment export predictions in Guadalupe were only accurate for the validation 401
period (Table 3). However, this can be consider an artefact, since the single sediment peak during 402
the calibration period was located between two months (March and April 2013).Daily-scale model 403
errors within this relatively short time span propagate into the monthly analysis, as can be seen in 404
Fig. 6. When the evaluation is corrected for this artefact (i.e. comparing 30-day averages), the RSR 405
decreases to 0.3 and NSE increases to 0.86, indicating an accurate simulation of monthly sediments 406
in Guadalupe during the calibration period as well. 407
As the model performance statistics RSR and NSE are known to be overly sensitive to model 408
fit to peak streamflow events (Beven, 2012), a poorer performance for Guadalupe (especially for 409
sediments) would be expected compared with São Lourenço, especially at the daily scale (Table 3 410
and Figs. 5 and 6). A similar explanation can be given for the lower model performance at the daily 411
scale compared with the monthly scale, also discussed by Moriasi et al. (2007) for the SWAT model, 412
since performances conducted on monthly measurements tend to smooth out the predicted error 413
by reducing the peaks and troughs in the data. 414
17 SWAT was thus successfully applied to both catchments, indicating that it is a valid tool for 415
simulating the effects of climate and land use changes. Arguably, an assessment of data and model 416
uncertainty would have been important for this study since it would impact the predictions for the 417
chosen scenarios; it would also have been interesting to compare model and scenario uncertainty 418
(discussed below). Uncertainty in streamflow and especially sediment data could limit the validity 419
of the SWAT calibration (Sellami et al., 2013), but this was not quantified. The short period for data 420
collection could also limit the variability of conditions used for calibration (Lespinas et al., 2014; 421
Piras et al., 2014). However, the marked intra-annual variability, combined with the selection of a 422
drought year (2011/2012) for calibration in Guadalupe, could have helped to limit the importance 423
of this issue. In fact, Lespinas et al. (2014) found the length of the calibration period to be less 424
important than the selection of model structure (in their case, the evapotranspiration calculation 425
method) for reducing uncertainty. In this case, the use of streamflow, runoff, soil moisture and (in 426
Guadalupe) evapotranspiration data would have helped to decrease uncertainty through a multi-427
objective calibration approach (Efstratiadis and Koutsoyiannis, 2010; Beven, 2012). Furthermore, 428
measured data was used to severely restrict the range of calibrated parameters (SOL_AWC, USLE_K, 429
ALPHA_BF and DEP_IMP in Table 2) which could have further limited parameter uncertainty (Beven, 430
2012). Finally, model structure could have contributed for uncertainty, notably due to the erosion 431
simulation method not accounting for rain-splash erosion (Arnold et al., 2011). 432
433
4.2 Effects of climate changes 434
The impacts of climate change scenarios on stream discharge (Fig. 8) seemed to be related to the 435
decrease in precipitation forecasted for both catchments (Fig. 10). These results agree with findings 436
from studies in other basins of the Iberian Peninsula (e.g. Lopéz-Moreno et al., 2014; Molina-437
Navarro et al., 2014; Nunes et al., 2008, 2013; Zabaleta et al., 2014), as well as elsewhere in the 438
Mediterranean (e.g. Lespinas et al., 2014; Piras et al., 2014; Stigter et al., 2014). In these studies, a 439
decrease in precipitation due to climate changes has been identified as the main cause of reduced 440
18 surface water availability. In most of these basins, as in the present ones, the decrease in 441
precipitation results in a greater decrease in surface water. For example, Molina-Navarro et al. 442
(2014) estimated in the Ompólveda River (Spain) that an annual precipitation decrease of 6% 443
(scenario AB1) to 9% (scenario B1) in average would lead to a 22% (scenario A1B) to 34% (scenario 444
B1) reduction in annual streamflow. 445
Although the greater decrease in precipitation at the humid site of São Lourenço (see section 446
2.3) would suggest a more pronounced impact on streamflow, the reverse was found in the present 447
study. In São Lourenço, a larger decrease (-7 to -8%) in ET (Fig. 10) can be attributed to the large 448
decreases in the main land-cover types of vine (-9 to -11%) and maritime pine (-7 to -8%), as seen 449
in Table 6. In Guadalupe, the lower decrease in ET (-4 to -6%) is linked with lower decreases in the 450
main covers of oak (-4 to -6%) and pasture (-4 to -5%), as seen in Table 7. The differences between 451
the catchments may be that vine and maritime pine are less able to control evapotranspiration than 452
Mediterranean evergreen oaks, while annual crops benefit from warmer winters by increased 453
growth under wet conditions (Nunes and Seixas, 2011). As a result, the impacts of climate changes 454
on water yield were slightly more pronounced at Guadalupe 14 to -18%) than in São Lourenço (-455
13%). 456
With respect to sediment export, the 9 to 11% decrease in annual export predicted for São 457
Lourenço may be due to the decrease in precipitation predicted for this catchment. Reduction in 458
rainfall is generally linked with decreased runoff and soil erosion (Kalogeropoulos and Chalkias, 459
2013; Nunes et al., 2008; Perazzoli et al., 2013; Zabaleta et al., 2014), particularly in regions where 460
there is year round crop cover (Cerdan et al., 2010; Nunes et al., 2011). The most important land-461
cover types in São Lourenço (i.e. vineyards and maritime pine) are permanent, and both showed a 462
decrease in erosion (Table 8). Similar results have been reported in other humid regions for climate 463
change scenarios forecasting a reduction in precipitation (Bangash et al., 2013; Khoi and Suetsugi, 464
2014; Lu et al., 2013; Mullan, 2013). In Guadalupe, on the other hand, sediment export increased 465
under both climate change scenarios, mostly due to large increases in erosion for wheat and 466
19 pasture (i.e. annual crops; Table 9). The increase in precipitation forecasted in winter months, which 467
is associated with the generally low vegetation cover during the cold season, increased soil erosion 468
in this catchment. This finding agrees with the results of other authors (Khoi and Suetsugi, 2014; Li 469
et al., 2012; Nunes et al., 2008). However, it should be noted that the permanent vegetation cover 470
in this catchment (i.e. oak and olive groves) showed a reduction in erosion rates (Table 9) similar to 471
the findings from the humid catchment (Table 8). 472
As discussed earlier, the uncertainty in climate scenario was not considered in this study. Two 473
greenhouse gas emission scenarios were assessed, but only one GCM and downscaling method was 474
applied. The resulting climate predictions were within the bounds simulated by the PRUDENCE 475
(Déqué et al., 2005) and ENSEMBLES projects (Van Der Linden and Mitchell, 2009), but close to the 476
lowest degree of change (see Nunes et al., 2008). A more complete assessment should consider 477
uncertainty in GCM and downscaling methods, and in particular assess the impacts of more 478
extreme climate change scenarios. 479
480
4.3 Effects of land use changes 481
In contrast to the climate change impacts, land use change had a minor impact on stream discharge 482
(Fig. 8). For São Lourenço, a very small increase in discharge was predicted under both scenarios, 483
despite an increase in ET (Fig. 10). This mostly was due to the expansion of corn, which is irrigated 484
and adds another source of water to the catchment. The replacement of vineyards and pastures by 485
forests and cereals also led to higher interception and transpiration, as seen in Table 6. This finding 486
agrees with previous studies examining the impact of cereals (García-Ruiz and Lana-Renault, 2011; 487
Vicente et al., 2013) and of forests (Jordan et al., 2014; Khoi and Suetsugi, 2014; López-488
Moreno et al., 2014; Molina-Navarro et al., 2014; Montenegro and Ragab, 2012). However, a 489
decrease in ET in eucalypts should also be noted (Table 6) and is linked to its expansion to soils with 490
lower water holding capacity. In contrast, the higher increase in flow discharge in Guadalupe under 491
the A1B scenario was mainly related to a decrease in ET (Figs. 8 and 10), linked with the conversion 492
20 of pastures into sunflower plantations, since the latter is a spring crop with lower cover and water 493
demands (Table 7). 494
With respect to soil erosion, the larger decrease (-18%) in sediment export in São Lourenço 495
under scenario A1B (Fig. 9) was mainly the result of a reduction in vineyard areas (Table 4). This 496
crop type has previously been found to have the highest erosion rates (Table 8) among the cultures 497
typically cultivated in the Mediterranean basin (Cerdan et al., 2010). By contrast, the decrease 498
observed under scenario B1 (-10%) resulted from the conversion of pasture into pine plantations, 499
since forests typically have lower erosion rates (Table 8) than grasslands (e.g. Cerdan et al., 2010; 500
García-Ruiz and Lana-Renault, 2011; Nunes et al., 2011). For Guadalupe, on the other hand, the 501
replacement of pasture by sunflower (A1B scenario) led to a sharp increase in soil erosion (+257%). 502
This may be attributed to the lack of ground cover during the wet season leading to higher soil 503
losses (Table 9) than would occur with permanent vegetation cover (Cerdan et al., 2010; Nearing et 504
al., 2005; Nunes et al., 2011). For scenario B1, a considerably smaller increase in sediment export 505
(+9%) was observed in Guadalupe, largely because there was less of a conversion of pasture into 506
sunflower than in the A1B scenario (Table 5), but also because the erosion rates of sunflower and 507
wheat (which was fully replaced by sunflower in scenario B1) tend to be very similar (respectively, 508
1.34 and 1.67 tons ha-1; Table 9). 509
From the results of the present study, the differences between the two catchments with 510
regards to sediment export were largely related to the growing cycle of the different crops (García-511
Ruiz and Lana-Renault, 2011; Nearing et al., 2004). In the humid area, most crops have year-round 512
soil cover, whereas in the dry areas soils are often bare in the winter. This reduces the protection 513
of soils against rain-splash and particle detachment during the rainy season, thereby exposing the 514
soils to enhanced erosion (Cerdan et al., 2010; García-Ruiz and Lana-Renault, 2011; Nearing et al., 515
2004, 2005; Nunes et al., 2008). 516
The land use change scenarios assumed a single societal response for each socio-economic 517
storyline, but these responses can have a high degree of uncertainty (see Stigter et al., 2015). For 518
21 example, an incentive for planting vineyards instead of eucalypts in São Lourenço, or olive trees 519
instead of sunflower in Guadalupe, could have led to different erosion rates. A more complete work 520
should consider different plausible land-use changes to assess a range of impacts. 521
522
4.4 Combined effects of climate and land use changes 523
Climate and land use changes showed off-setting effects on stream discharge and sediment export 524
at the humid catchment. In this watershed, flow discharge and sediment export were forecasted to 525
decrease, particularly under the A1B scenario (Figs. 8 and 9), as a combined effect of reduced 526
precipitation and cultivation of more soil-protective crops (Nunes et al., 2008). A different response 527
was observed for the dry catchment, as a decrease in streamflow and an increase in sediment 528
export was predicted as a result of combined climate and land use changes (Figs. 8 and 9). For 529
Guadalupe, the cultivation of less water-demanding species was not able to offset the reduction in 530
stream discharge resulting from reduced precipitation. On the other hand, the increase in sediment 531
export associated with the cultivation of highly erosion-prone crops was not aggravated by the 532
higher rainfall amounts forecasted for winter months. In fact, the combined impact of climate and 533
land use changes on soil erosion, particularly under the A1B scenario was less severe than would 534
be expected, mostly due to a decrease in erosion from sunflower under the combined scenarios 535
(from 1.44 to 1.30 tons ha-1; Table 9), but also due to the decrease in olive groves. A decrease in 536
erosion under climate change for spring crops could be associated with warmer winters leading to 537
more vegetation cover in the wet season (Nunes and Seixas, 2011). Nonetheless, the high erosion 538
rates predicted for Guadalupe, which are higher than the tolerable soil erosion rates in Europe ( 1 539
tons ha-1; Verheijen et al., 2012), might pose severe problems for soil productivity due to the 540
shallowness and poor quality of local soils (Nunes et al., 2008).The combined scenario analysis also 541
did not address the uncertainties which underlie climate and land-use scenarios. One method to 542
ensure this in a more complete work would be to adopt an uncertainty assessment framework, 543
22 such as the one proposed by Ludwig et al. (2010), to address uncertainty at each step of the impact 544 assessment study. 545 546 5 Conclusions 547
In the present work, SWAT was successfully applied to a humid and dry Mediterranean catchment, 548
demonstrating its application as a valid tool for predicting the impacts of climate and land use 549
changes on streamflow and sediment export. 550
From the integrated analysis of the effect of the two environmental stressors, climate changes 551
were predicted to have a more pronounced impact on water availability than land use changes. The 552
reverse was predicted for sediment export, which reinforces the importance of land use changes 553
for the future state of Mediterranean soils and for minimizing the indirect effects of climate 554
changes. In this case, the potential negative impact of the expansion of sunflower cultivation for 555
soil protection in the dry site is stressed, suggesting alternative land use policies with equivalent 556
economic value, such as the expansion of olive groves. 557
The results of this study stress the importance of present-day land cover for climate change 558
impacts. The humid catchment, with permanent vegetation cover, is expected to experience less 559
negative impacts on available water resources and even an increase of soil protection. The dry 560
catchment by contrast, which has either drought-adapted permanent vegetation or annual winter 561
crops, is expected to experience larger negative impacts on both water resources and soil 562
protection. While vegetation cover is an indirect function of climate, these results also point to land 563
use policies that could help mitigate the impacts of climate change on soil degradation, e.g. by 564
promoting the maintenance of vegetation with permanent cover, such as pasture, olive groves, or 565
natural shrublands. 566
This study did not address scenario uncertainty, i.e. from greenhouse gas emission, selection 567
of climate model and downscaling method, and selection of socio-economic scenario, since the 568
relatively limited objectives only required a small number of plausible scenarios. However, a 569
23 complete assessment of potential climate change impacts should take these uncertainties into 570
account, especially by considering a large range of GCM/RCM combinations and of socio-economic 571
responses. 572
From the present work, it becomes evident that an integrated approach combining the effects 573
of climate and land cover change is crucial for a realistic evaluation of the future state of natural 574
resources. Despite being a starting point towards a better understanding of the direct and indirect 575
impacts of climate change on Mediterranean watersheds, this study provides important 576
information that can be useful for decision-makers to design adaptive measures to climate changes. 577
Future work should address the range of foreseeable scenarios for the study area, to take into 578
account the uncertainty inherent to climate and land use change predictions. 579
580
Acknowledgments 581
582
This study was funded by the European Regional Development Fund (through the Competitiveness 583
Factors Operational Programme – COMPETE), the European Social Fund (through Human Potential 584
Operational Programme) and the Portuguese Republic (through the Portuguese Foundation for 585
Science and Technology – FCT), under the scope of the PEst (PEst-C/MAR/LA0017/2013), VITAQUA 586
AMB/112438/2009 and FCOMP-01-0124-FEDER-013912) and ERLAND (PTDC/AAC-587
AMB/100520/2008 and FCOMP-01-0124-FEDER-008534) Projects. Serpa D. was a recipient of a 588
grant from FCT (SFRH/BPD/92650/2013) as well as Abrantes N. (SFRH/BPD/84833/2012) and Nunes 589
J. P. (SFRH/BPD/39721/2007 and SFRH/BPD/87571/2012). The authors would also like to thank 590
MSc. Daniel Hawtree for the revision of the English language and to two anonymous reviewers for 591
their valuable comments on the manuscript. 592
593
References 594
24 Arnold JG, Kiniry JR, Srinivasan R, Williams JR, Haney EB, Neitsch SL. Soil and Water Assessment Tool 596
theoretical documentation, Version 2009, 2011. Texas: Texas Water Resources Institute technical 597
report No 365; 2011. 598
599
Arnold JG, Srinivasan R, Muttiah RS, Williams JR. 1998. Large area hydrologic modeling and 600
assessment – Part 1: Model development. Journal of the American Water Resources Association 601
34, 73–89. 602
603
Bangash RF, Passuello A, Sanchez-Canales M, Terrado M, López A, Elorza FJ, Ziv G, Acuña V, 604
Schuhmacher M. 2013. Ecosystem services in Mediterranean river basin: Climate change impact on 605
water provisioning and erosion control. Science of the Total Environment 458–460, 246–255. 606
607
Beguería S, López-Moreno JI, Lorente A, Seeger M, García-Ruiz JM. 2003. Assessing the effect of 608
climate oscillations and land-use changes on streamflow in the Central Spanish Pyrenees. Ambio 609
32, 283–286. 610
611
Beven KJ. Rainfall-Runoff Modelling: The Primer. Hoboken: Wiley-Blackwell; 2012. 612
613
Camacho-B SE, Hall AE, Kaufmann MR. 1974. Efliciency and Regulation of Water Transport in Some 614
Woody and Herbaceous Species. Plant Physiology 54, 169–172. 615
616
Cardoso JC, Bessa MT, Marado MB. 1973. Carta dos solos de Portugal – 1:1.000.000. Agronomia 617
Lusitana 33 (1-4), 481–602. 618
619
Cardoso JVJC. Os solos de Portugal, sua classificação, caracterização e génese: 1- a sul do rio Tejo. 620
Lisbon: General-Directorate for Agricultural Services; 1965. 621
25 622
Cerdan O, Govers G, Le Bissonnais Y, Van Oost K, Poesen J , Saby N, Gobin A, Vacca A, Quinton J, 623
Auerswald K, Klik A, Kwaad FJPM, Raclot D, Ionita I, Rejman J, Rousseva S, Muxart T, Roxo MJ, Dostal 624
T. 2010. Rates and spatial variations of soil erosion in Europe: A study based on erosion plot data. 625
Geomorphology 122, 167–177. 626
627
Compo GP, Whitaker JS, Sardeshmukh PD, Matsui N, Allan RJ, Yin X, Gleason BE, Vose RS, Rutledge 628
G, Bessemoulin P, Brönnimann S, Brunet M, Crouthamel RI, Grant AN, Groisman PY, Jones PD, Kruk 629
M, Kruger AC, Marshall GJ, Maugeri M, Mok HY, Nordli Ø, Ross TF, Trigo RM, Wang XL, Woodruff 630
SD, Worley SJ. 2011. The Twentieth Century Reanalysis Project. Quarterly Journal of the Royal 631
Meteorological Society 137, 1–28. 632
633
Corte-Real J, Qian B, Xu H. 1998. Regional climate change in Portugal: precipitation variability 634
associated with large-scale atmospheric circulation. International Journal of Climatology 18, 619– 635
635. 636
637
De Girolamo AM, Lo Porto A. 2012. Land use scenario development as a tool for watershed 638
management within the Rio Mannu Basin. Land Use Policy 29, 691–701. 639
640
Deidda R, Marrocu M, Caroletti G, Pusceddu G, Langousis A, Lucarini V, Puliga M, Speranza A. 2013. 641
Regional climate models' performance in representing precipitation and temperature over selected 642
Mediterranean areas. Hydrology and Earth System Sciences 17, 5041–5059. 643
644
Déqué M, Jones RG, Wild M, Giorgi F, Christensen JH, Hassell DC, Vidale PL, Rockel B, Jacob D, 645
Kjellström E, de Castro M, Kucharski F, van den Hurk B. 2005. Global high resolution versus Limited 646
26 Area Model climate change projections over Europe: quantifying confidence level from PRUDENCE 647
results. Climate Dynamics 25, 653–670. 648
649
DGADR, Direcção-Geral de Agricultura e Desenvolvimento Rural. 2013. Solos, cartografia e 650
informação geográfia. Available online at: http://www.dgadr.mamaot.pt/cartografia/cartas-solos-651
cap-uso-digital. Last accessed on February 2013. 652
653
Efstratiadis A, Koutsoyiannis D. 2010. One decade of multi-objective calibration approaches in 654
hydrological modelling: a review. Hydrological Sciences Journal 55, 58–78. 655
656
Gallart F, Llorens P. 2004. Observations on land cover changes and water resources in the 657
headwaters of the Ebro catchment, Iberian Peninsula. Physics and Chemistry of the Earth 29, 769– 658
773. 659
660
García-Ruiz JM. 2010. The effects of land uses on soil erosion in Spain: a review. Catena 81, 1–11. 661
662
García-Ruiz JM, Lana-Renault N. 2011. Hydrological and erosive consequences of farmland 663
abandonment in Europe, with special reference to the Mediterranean region – A review. 664
Agriculture, Ecosystems and Environment 140, 317–338. 665
666
García-Ruiz JM, Nadal-Romero E, Lana-Renault N, Beguería S. 2013. Erosion in Mediterranean 667
landscapes: Changes and future challenges. Geomorphology 198, 20–36. 668
669
Gilmanov TG, Soussana JF, Aires L, Allard V, Ammann C, Balzarolo M, Barcza Z, Bernhofer C, 670
Campbell CL, Cernusca A, Cescatti A, Clifton-Brown J, Dirks BOM, Dore S, Eugster W, Fuhrer J, 671
27 Gimeno C, Gruenwald T, Haszpra L, Hensen A, Ibrom A, Jacobs AFG, Jones MB, Lanigan G, Laurila T, 672
Lohila A, Manca G, Marcolla B, Nagy Z, Pilegaard K, Pinter K, Pio C, Raschi A, Rogiers N, Sanz MJ, 673
Stefani P, Sutton M, Tuba Z, Valentini R, Williams ML, Wohlfahrt G. 2007. Partitioning European 674
grassland net ecosystem CO2 exchange into gross primary productivity and ecosystem respiration 675
using light response function analysis, Agriculture, Ecosystems and Environment 121, 9–120. 676
677
Graffin SR, Rosenzweig CR, Xing X, Yetman G. Downscaling and geo-spatial gridding of socio-678
economic projections from the IPCC Special Report on Emissions Scenarios (SRES). Columbia: 679
CIESIN, Center for Climate Systems Research, Columbia University; 2004. 680
681
Hargreaves GL, Hargreaves GH, Riley JP. 1985. Agricultural benefits for Senegal River Basin. Journal 682
of Irrigation and Drainage Engineering 111, 113–124. 683
684
Hoque YM, Raj C, Hantush MM, Chaubey I, Govindaraju RS. 2014. How Do Land-Use and Climate 685
Change Affect Watershed Health? A Scenario-Based Analysis. Water Quality, Exposure and Health 686
6, 19–33. 687
688
IGeoE, Instituto Geográfico do Exército. 1990. Carta de ocupação do solo COS 90. Available online 689
at: http://dgterritorio.pt/e-IGEO/egeo_downloads.htm. Last accessed on February 2013. 690
691
IGeoE, Instituto Geográfico do Exército. 2007. Carta de ocupação do solo COS 2007. Available online 692
at: http://dgterritorio.pt/e-IGEO/egeo_downloads.htm. Last accessed on February 2013. 693
694
IGeoE, Instituto Geográfico do Exército. 2013. Modelo Digital do Terreno para Portugal. Available 695
online at: http://www.igeoe.pt/index.php?id=39. Last accessed on February 2013. 696
28 697
INIA-LQARS, Instituto Nacional de Investigação Agrária. Manual de fertilização das culturas. Lisbon: 698
Ministério da Agricultura, do Desenvolvimento Rural e das Pescas; 2000 699
700
IPCC, Intergovernmental Panel on Climate Change. Contribution of Working Group II to the Fourth 701
Assessment Report of the Intergovernmental Panel on Climate Change. Parry ML, Canziani OF, 702
Palutikof JP, van der Linden PJ, Hanson CE, editors. Cambridge, New York: Cambridge University 703
Press; 2007. 704
705
IPCC, Intergovernmental Panel on Climate Change. Climate Change 2013: The Physical Science 706
Basis. Contribution of Working Group I to the Fifth Assessment Report of the Intergovernmental 707
Panel on Climate Change. Stocker TF, Qin D, Plattner G-K, Tignor M, Allen SK, Boschung J, Nauels A, 708
Xia Y, Bex V, Midgley PM, editors. Cambridge, New York: Cambridge University Press; 2013. 709
710
Jacinto R, Cruz MJ, Santos FD. 2013. Development of water use scenarios as a tool for adaptation 711
to climate change. Drinking Water Engineering and Science 6, 61–68. 712
713
Jones N, Graaff J, Rodrigo I, Duarte F. 2011. Historical review of land use changes in Portugal (before 714
and after EU integration in 1986) and their implications for land degradation and conservation, with 715
a focus on Centro and Alentejo regions. Applied Geography 31, 1036–1048. 716
717
Jordan YC, Ghulam A, Hartling S. 2014. Traits of surface water pollution under climate and land use 718
changes: A remote sensing and hydrological modeling approach. Earth-Science Reviews 128, 181– 719
195. 720
29 Kalantari Z, Lyon SW, Folkeson L, French HK, Stolte J, Jansson P-E, Sassner M. 2014. Quantifying the 722
hydrological impact of simulated changes in land use on peak discharge in a small catchment. 723
Science of the Total Environment 466–467,741–754. 724
725
Kalogeropoulos K, Chalkias C. 2013. Modelling the impacts of climate change on surface runoff in 726
small Mediterranean catchments: empirical evidence from Greece. Water and Environment Journal 727
27, 505–513. 728
729
Khoi DN, Suetsugi T. 2014. The responses of hydrological processes and sediment yield to land-use 730
and climate change in the Be River Catchment, Vietnam. Hydrological Processes 28, 640–652. 731
732
Kilsby CG, Tellier SS, Fowler HJ, Howels TR. 2007. Hydrological impacts of climate change on the 733
Tejo and Guadiana Rivers. Hydrology and Earth Systems Science 11, 1175–1189. 734
735
Lespinas F, Ludwig W, Heussner S. 2014. Hydrological and climatic uncertainties associated with 736
modeling the impact of climate change on water resources of small Mediterranean coastal rivers. 737
Journal of Hydrology 511, 403–422. 738
739
Li D, Tian Y, Liu C, Hao F. 2004. Impact of land-cover and climate changes on runoff of the source 740
regions of the Yellow River. Journal of Geographical Sciences 14, 330-338. 741
742
Li H, Zhang Y, Vaze J, Wang B. 2012. Separating effects of vegetation change and climate variability 743
using hydrological modelling and sensitivity-based approaches. Journal of Hydrology 420–421, 403– 744
418. 745
30 Li Z, Liu W-Z, Zhang X-C, Zheng F-L. 2009. Impacts of land use change and climate variability on 747
hydrology in an agricultural catchment on the Loess Plateau of China. Journal of Hydrology 377, 35– 748
42. 749 750
López-Moreno JI, Vicente-Serrano SM, Moran-Tejeda E, Zabalza J, Lorenzo-Lacruz J, García-Ruiz JM. 751
2011. Impact of climate evolution and land use changes on water yield in the Ebro basin. 752
Hydrological Earth System Sciences 15, 311–22. 753
754
López-Moreno JI, Zabalza J, Vicente-Serrano SM, Revuelto J, Gilaberte M, Azorin-Molina C, Morán-755
Tejeda E, García-Ruiz JM, Tague C. 2014. Impact of climate and land use change on water availability 756
and reservoir management: Scenarios in the Upper Aragón River, Spanish Pyrenees. Science of the 757
Total Environment 493, 1222–1231. 758
759
López-Vicente M, Poesen J, Navas A, Gaspar L. 2013. Predicting runoff and sediment connectivity 760
and soil erosion by water for different land use scenarios in the Spanish Pre-Pyrenees. Catena 102, 761
62–73. 762
763
Lu XX, Ran LS, Liu S, Jiang T, Zhang SR, Wang JJ. 2013. Sediment loads response to climate change: 764
A preliminary study of eight large Chinese rivers. International Journal of Sediment Research 28, 0– 765
14. 766 767
Ludwig R, Soddu A, Duttmann R, Baghdadi N, Benabdallah S, Deidda R, Marrocu M, Strunz G, 768
Wendland F, Engin G, Paniconi C, Prettenthaler F, Lajeunesse I, Afifi S, Cassiani G, Bellin A, Mabrouk 769
B, Bach H, Ammerl T. 2010. Climate induced changes on the hydrology of Mediterranean basins - A 770
research concept to reduce uncertainty and quantify risk. Fresenius Environmental Bulletin 19. 771
31 Luo Y, Ficklin DL, Liu X, Zhang M. 2013. Assessment of climate change impacts on hydrology and 773
water quality with a watershed modeling approach. Science of the Total Environment 450–451, 72– 774
82. 775 776
Majone B, Villa F, Deidda R, Bellin A. 2015. Impact of climate change and water use policies on 777
hydropower potential in the south-eastern Alpine region. Science of The Total Environment, in 778
press. DOI: 10.1016/j.scitotenv.2015.05.009. 779
780
Mango LM, Melesse AM, McClain ME, Gann D, Setegn SG. 2011. Land use and climate change 781
impacts on the hydrology of the upper Mara River Basin, Kenya: results of a modeling study to 782
support better resource management. Hydrological Earth System Sciences 15, 2245–2258. 783
784
Maraun D, Wetterhall F, Ireson AM, Chandler RE, Kendon EJ, Widmann M, Brienen S, Rust HW, 785
Sauter T, Themeßl M, Venema VKC, Chun KP, Goodess CM, Jones RG, Onof C, Vrac M, Thiele‐Eich I. 786
2010. Precipitation downscaling under climate change: Recent developments to bridge the gap 787
between dynamical models and the end user. Reviews of Geophysics 48, RG3003. 788
789
McMillan H, Freer J, Pappenberger F, Krueger T, Clark M. 2010. Impacts of uncertain river flow data 790
on rainfall-runoff model calibration and discharge predictions. Hydrological Processes 24, 1270– 791
1284. 792
793
Middleton N, Thomas D. World Atlas of Desertification. London: United Nations Environment 794
Program, UNEP; 1997. 795
796
Milly PCD, Dunne KA, Vecchia AV. 2005. Global pattern of trends in stream flow and water 797
availability in a changing climate. Nature 438, 347–50. 798
32 799
Molina-Navarro E, Trolle D, Martinez-Perez S, Sastre-Merlin A, Jeppesen E. 2014. Hydrological and 800
water quality impact assessment of a Mediterranean limno-reservoir under climate change and 801
land use management scenarios. Journal of Hydrology 509, 354–366. 802
803
Montenegro S, Ragab R. 2012. Impact of possible climate and land use changes in the semi arid 804
regions: A case study from North Eastern Brazil. Journal of Hydrology 434–435, 55–68. 805
806
Moreira F, Rego FC, Ferreira PG. 2001. Temporal (1958–1995) pattern of change in a cultural 807
landscape of northwestern Portugal: implications for fire occurrence. Landscape Ecology 16, 557– 808
567. 809
810
Moriasi DN, Arnold JG, Van Liew MW, Bingner RL, Harmel RD, Veith TL. 2007. Model evaluation 811
guidelines for systematic quantification of accuracy in watershed simulations. American Society of 812
Agricultural and Biological Engineers 50, 885−900. 813
814
Mourato S, Moreira M, Corte-Real J. 2015. Water resources impact assessment under climate 815
change scenarios in Mediterranean watersheds. Water Resources Management, in press. DOI: 816
10.1007/s11269-015-0947-5. 817
818
Mullan D. 2013. Soil erosion under the impacts of future climate change: Assessing the statistical 819
significance of future changes and the potential on-site and off-site problems. Catena 109, 234– 820
246. 821
33 Nakićenović N, Swart R. Special Report on Emissions Scenarios. A Special Report of Working Group 823
III of the Intergovernmental Panel on Climate Change. Cambridge: Cambridge University Press; 824
2000. 825
826
NCDC, National Climatic Data Center of the National Oceanic and Atmospheric Administration. 827
2014. Global Summary of the Day. Available online at: http://www.ncdc.noaa.gov/. Last accessed 828
on June 2014. 829
830
Nearing MA, Jetten V, Baffaut C, Cerdan O, Couturier A, Hernandez M, Le Bissonnais Y, Nichols MH, 831
Nunes JP, Renschler CS, Souchère V, van Oost K. 2005. Modeling response of soil erosion and runoff 832
to changes in precipitation and cover. Catena 61, 131–154. 833
834
Nearing MA, Pruski FF, O'Neal MR. 2004. Expected climate change impacts on soil erosion rates: a 835
review. Journal of Soil and Water Conservation 59, 43–50. 836
837
Neitsch SL, Arnold JG, Kiniry JR, Williams JR. Soil and Water Assessment Tool theoretical 838
documentation. Version 2009. Texas: Texas Water Resources Institute Technical Report No. 406, 839
Texas A&M University System; 2011. 840
841
Neitsch SL, Arnold JG, Kiniry JR, Williams JR, Kiniry KW. Soil and Water Assessment Tool theoretical 842
documentation. Texas: Texas Water Resources Institute, TWRI report TR-191; 2002. 843
844
Nunes AN, Almeida AC, Coelho COA. 2011. Impacts of land use and cover type on runoff and soil 845
erosion in a marginal area of Portugal. Applied Geography 31, 687–699. 846