www.solid-earth.net/7/1551/2016/ doi:10.5194/se-7-1551-2016
© Author(s) 2016. CC Attribution 3.0 License.
Using Landsat Thematic Mapper (TM) sensor to detect change
in land surface temperature in relation to land use
change in Yazd, Iran
Sajad Zareie1, Hassan Khosravi2, Abouzar Nasiri3, and Mostafa Dastorani4
1GIS & Remote Sensing, Institute of Earth Sciences, Saint Petersburg State University, Saint Petersburg, Russia
2Department of Arid and Mountainous Reclamation Region, Faculty of Natural Resources, University of Tehran, Tehran, Iran 3Department of Ecology and Environmental Management, Protection of the Natural Resource and Environment, Land Cadastre Faculty, State University of Land Use Planning, Moscow, Russia
4Department of Desertification, Faculty of Natural Resources and Earth Sciences, University of Kashan, Kashan, Iran Correspondence to:Hassan Khosravi ([email protected])
Received: 27 January 2016 – Published in Solid Earth Discuss.: 2 March 2016
Revised: 23 September 2016 – Accepted: 28 September 2016 – Published: 15 November 2016
Abstract.Land surface temperature (LST) is one of the key parameters in the physics of land surface processes from lo-cal to global slo-cales, and it is one of the indicators of envi-ronmental quality. Evaluation of the surface temperature dis-tribution and its relation to existing land use types are very important to the investigation of the urban microclimate. In arid and semi-arid regions, understanding the role of land use changes in the formation of urban heat islands is nec-essary for urban planning to control or reduce surface tem-perature. The internal factors and environmental conditions of Yazd city have important roles in the formation of spe-cial thermal conditions in Iran. In this paper, we used the temperature–emissivity separation (TES) algorithm for LST retrieving from the TIRS (Thermal Infrared Sensor) data of the Landsat Thematic Mapper (TM). The root mean square error (RMSE) and coefficient of determination (R2) were used for validation of retrieved LST values. The RMSE of 0.9 and 0.87◦C and R2of 0.98 and 0.99 were obtained for the 1998 and 2009 images, respectively. Land use types for the city of Yazd were identified and relationships between land use types, land surface temperature and normalized dif-ference vegetation index (NDVI) were analyzed. The Kappa coefficient and overall accuracy were calculated for accuracy assessment of land use classification. The Kappa coefficient values are 0.96 and 0.95 and the overall accuracy values are 0.97 and 0.95 for the 1998 and 2009 classified images, re-spectively. The results showed an increase of 1.45◦C in the
average surface temperature. The results of this study showed that optical and thermal remote sensing methodologies can be used to research urban environmental parameters. Finally, it was found that special thermal conditions in Yazd were formed by land use changes. Increasing the area of asphalt roads, residential, commercial and industrial land use types and decreasing the area of the parks, green spaces and fallow lands in Yazd caused a rise in surface temperature during the 11-year period.
1 Introduction
The study of soils requires an interdisciplinary approach involving geologists, biologists, physicists, chemists, anthro-pologists, economists, engineers, medical professionals, mil-itary professionals, sociologists and even artists. The most important soil-related critical challenges for research are bio-diversity, energy security, climate change, ecosystem ser-vices, food security, human health, land degradation and wa-ter security (Brevik et al., 2015). Soils provide fundamental ecosystem services, and management to change a soil pro-cess in support of one ecosystem service can provide co-benefits to other services. Fundamental research is needed to better understand the relationships between soils and the array of ecosystem services. More knowledge about soil and agricultural systems is required to utilize ecosystem services in order to protect and enhance soils in the long term (Smith et al., 2015). Soil scientists believe that soil knowledge has a key role in major global issues like food production, the loss of biodiversity and the availability of water resources. Agro-nomic studies show that land management strongly influ-ences pollutant behavior in soils because it influinflu-ences the fil-ter and buffer functions of soil (Mol and Keesstra, 2012). Us-ing modern soil information can improve the results of stud-ies related to food security, water scarcity, climate change, biodiversity loss and health threats (Keesstra et al., 2016). Management can help to improve the social, economic and environmental sustainability of agricultural and food systems (Decock et al., 2015). Loss of plant species diversity has important effects on the erosion resistance of slopes. The protection and restoration of vegetated covers are necessary to minimize soil erosion, which will not only contribute to greater safety in the most densely populated areas of the world, but will also help maintain soil fertility on pasture lands (Berendse et al., 2015).
Urban planning is often hindered by a lack of knowledge on how land use changes. In wet periods, saturation overland flows occur on urban and agricultural soils. Hydrophilic ur-ban and agricultural soils are characterized by increased in-filtration capacity during dry periods. In contrast, urban soils remain mostly hydrophilic, and have relatively high infiltra-tion capacities, whereas on the agricultural sites a rise in soil moisture leads to a decline in infiltration capacity, with soil saturation in areas of shallow soils (Ferreira et al., 2015). The spatial and temporal variability of overland flows and infil-tration affect flow connectivity depending on land use and soils. Understanding the mentioned concepts is necessary for land management in order to improve urban planning to min-imize flood hazards in territory (Ferreira et al., 2015). Param-eters such as water repellence, soil moisture content, vegeta-tion and litter surface soil cover are important for overland flow generation. Urban land use changes affect soil proper-ties and processes. The complexity in hydrological properproper-ties and processes of the land use changes as a result of the urban sprawl increases the unpredictability. Urban sprawl has the potential to alter the hydrological response and erosion pro-cesses in small catchments. Vegetation induces soil water
re-pellence, promoting discontinuous overland flow processes, which affect soil moisture content. These have major impli-cations for sustainable urban planning (Ferreira et al., 2012). Urban agriculture is a desirable land use for these spaces, but degraded soils are common. Urban agriculture can be pro-ductive in vacant urban land and also can improve soil quality at previously degraded sites (Beniston et al., 2016).
Remote sensing can be applied to detect and study vari-ous phenomena in Earth sciences and natural resources. For example, forest fires can be simulated using thermal remote sensing and normalized difference vegetation index (NDVI) indices derived from satellite imagery. NDVI data are a suit-able substitute for ground-based measurements in post-fire runoff predictions (Van Eck et al., 2016). Vegetation indices derived from the satellite data and remote sensing methods can be applied to investigate dynamic performance of plan-tations in terms of multitemporal dry biomass production (Zucca et al., 2015). Remote sensing instruments are key players to study and map land surface temperature (LST) at temporal and spatial scales (André et al., 2015). The LST indicator shows effects of different types of phenomena and features in the electromagnetic energy dispatch (Bingwei et al., 2015). Remote sensing methodology requires less time and lower cost than field methods to investigate various phe-nomena on the land surface (Niu et al., 2015). The advan-tages of using remote sensing methodology are the repetitive and consistent coverage, high resolution and evaluation of land surface characteristics (Owen et al., 1998). Thermal in-frared (TIR) data in remote sensing can help us obtain quan-titative information of surface temperature. Landsat imagery can be applied for monitoring different types of land use in arid and semi-arid regions (Baojuan et al., 2015). The Land-sat Thematic Mapper (TM) and ETM+(Enhanced Thematic Mapper Plus) sensor images can be used to study relationship between surface temperature and land use types using ther-mal quantitative indicators (Weng, 2003; Streutker, 2003). Land surface temperature can be retrieved using data from NOAA-11 (National Oceanic and Atmospheric Administra-tion) AVHRR (Advanced Very High Resolution Radiome-ter) channels 4 and 5 by emissivity calculation (France and Cracknell, 1994).
equa-tion, the mono-window and single-channel algorithms can be used to retrieve the LST from thermal infrared data of the TM sensor (José et al., 2004).
The NDVI is a good indicator for identifying long-term changes in the vegetation covers and their status (Baihua and Isabela, 2015). The NDVI calculation method using surface emissivity can be applied to areas with different soil and veg-etation types and where the vegveg-etation cover changes (Valor and Caselles, 1996). Therefore, analysis of spatial variabil-ity of NDVI, surface temperature and the relationship be-tween these parameters is essential in environmental studies. Combined study of NDVI, surface temperature and the tem-poral relation these two parameters with land use changes can be used to investigate climate change and global warm-ing (Schultz and Halpert, 1993). Vegetation cover change is the main factor that causes surface temperature changes. It should be noted that increasing surface temperature may in-crease vegetation cover density in the area, but only in ar-eas where there are sufficient water resources (Weixin et al., 2011). Different types of vegetation cover have differ-ent spatial responses to climate changes (Dehua et al., 2012). In the environmental studies, researchers have investigated land surface temperature using vegetation indices (Wei et al., 2015). Analysis of NDVI and LST of the different times (days, months, seasons and years) can be used to detect land use changes, which were formed because of deforestation, forest fires, mining activities, urban expansion and grassland regeneration (Sandra et al., 2015). Changes in land use and land cover can be evaluated by analysis of the vegetation cover and NDVI trends. The vegetation phenology was de-tected using Terra MODIS NDVI data by Gong et al. (2015). Land use changes, vegetation cover and soil moisture have strong effects on the land surface temperature; therefore, sur-face temperature can be applied to study land use changes, urbanization and desertification. Surface emissivity calcula-tion is important to estimate surface temperature. In the sev-eral studies, laboratory measurements of the emissivity data were used for estimation of land surface temperature (Salis-bury and D’Aria, 1992, 1994).
In the present study, heterogeneous surface temperature and NDVI of Yazd in Iran were calculated using Landsat TM sensor data. Surface temperature variation over different land use types in the Yazd are investigated and the relationship between NDVI and land surface temperature are analyzed. The aims of this study are to apply temperature–emissivity separation (TES) algorithm for LST retrieving from Landsat TM thermal data and to analyze the NDVI, different land use types and their roles in the surface temperature change. The main advantages of this study are TES algorithm (calculating emissivity) for retrieving LST, full statistical analysis for re-sults validation and simultaneous analysis of NDVI, LST and land use. The main difference between this study and previ-ous studies is to investigate the relationship between NDVI, LST and land use changes, and analysis of the effect of the land use changes on land surface temperature.
2 Material and methods 2.1 Study area
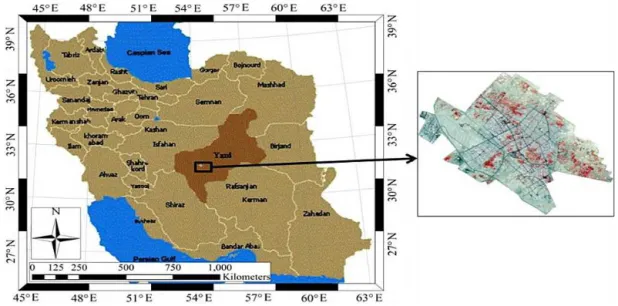
Yazd has been chosen as the study area, since there is a com-bination of different land use categories and it is susceptible to dust storms. Yazd is located in 31◦47′37′′–31◦57′56′′ N latitude and 54◦13′28′′–54◦27′10′′ E longitude in the Iran. This city has an altitude of 1230 m and covers an area of 2491 km2(Fig. 1). The study area is located in the arid and semi-arid belt in the Northern Hemisphere. In the arid and semi-arid areas, vegetation covers are affected by high di-urnal and seasonal variations of temperature, low amounts of precipitation and high evaporation (Dehghan, 2011). The predominant features of the territory are residential areas, waste land and bare soil. Land surface temperature in Yazd is affected by a warm, arid and semi-arid climate, low precipi-tation and the remoteness of major water resources, such as the Caspian Sea, Persian Gulf and Oman Sea.
2.2 Satellite data processing and methodology
The Landsat TM sensor data of 8 August 1998 and 6 Au-gust 2009 (daytime) were used in the present study. A sur-face emissivity calculation is the first step of land sursur-face temperature retrieving by the TES algorithm. The emissivity per pixel was obtained directly from Landsat TM sensor data. Natural surfaces at the resolution of 30 m are heterogeneous and they differ from each other in their emissivity. In addi-tion, the surface emissivity is affected by surface roughness, vegetation cover and different land use types. In the present study, surface emissivity was evaluated by analysis of NDVI and the fraction of vegetation cover per pixel. Emissivity is a quantification of the intrinsic ability of a surface in con-verting heat energy into above surface radiation and depends on the physical properties of the surface and on observation conditions (Sobrino et al., 2001). Surface emissivity can be extracted using NDVI values of the bare soil, full vegeta-tion and a mixture of bare soil and vegetavegeta-tion (Sobrino et al., 2004). In this study, the following equation was used to extract land surface emissivity for each pixel:
ε=εv·P v+εs·(1−P v)+dε, (1)
whereεis the LSE (Land Surface Emissivity),P vis the pro-portion of vegetation,εvis vegetation emissivity (0.99) and εsis soil emissivity (0.97). The term dεshows the geomet-ric distribution effect of natural surfaces and their internal re-flection. This term (dε)for our study area was not considered because it is negligible for surfaces with little height differ-ence. The proportion of vegetation (P v)is calculated with the following equation:
P v=
NDVI−NDVImin NDVImax−NDVImin
2
Figure 1.Yazd city location in Iran.
NDVI is obtained from spectral reflectance measurements in the visible (RED) and near-infrared regions (NIR) in the Ar-cGIS environment by
NDVI=NIR−RED
NIR+RED. (3)
The NDVI was calculated for two different time periods (1998 and 2009) to investigate the status of vegetation cover for the study area. High values of NDVI indicate dense and healthy vegetation. This method needs elementary knowl-edge of emissivity and NDVI for the different features and land use types.
The at-sensor spectral radiance is the amount of energy re-ceived by the satellite sensor. Calculation of spectral radiance is the fundamental step in converting satellite image data into a physically radiometric scale. Radiometric calibration of the Landsat TM sensor involves rescaling the raw digital num-bers of the satellite image to calibrated digital numnum-bers. The pixel values of unprocessed image data were converted to spectral radiance by radiometric calibration.
Spectral radiance (Lλ) at the sensor’s aperture in watts/(m2·ster·µm) is provided with the following equation:
Lλ+Grescale·QCAL+Brescale (4)
Spectral radiance is also expressed as
Lλ=
LMAX−LMIN QCALMAX−QCALMIN
·(QCAL−QCALMIN)+LMIN, (5)
where QCAL is the quantized calibrated pixel value in DN (Digital Number), Grescale is band-specific rescaling gain factor in (watts/(m2·ster·µm))/DN, Brescale is band-specific rescaling bias factor in watts/(m2·ster·µm)), LMIN
is the spectral radiance that is scaled to QCALMIN in watts/(m2·ster·µm), LMAX is the spectral radiance that is scaled to QCALMAX in watts/(m2·ster·µm), QCALMIN is the minimum quantized calibrated pixel value (correspond-ing to LMIN) in DN and QCALMAX is the maximum quan-tized calibrated pixel value (corresponding to LMAX) in DN. Table 1 summarize the TM spectral range, post-calibration dynamic ranges (LMIN and LMAX scaling parameters, the corresponding rescaling gain (Grescale) and rescaling bias (Brescale) values). QCALMIN=0 for data processed us-ing NLAPS (National Landsat Archive Production System) and QCALMIN=1 for data processed using LPGS (Level 1 Product Generation System).
Thermal band data (band 6 on TM) can be converted from spectral radiance to an effective brightness temperature. The brightness temperature assumes that the Earth’s surface is a black body (spectral emissivity of the black body is 1). Ther-mal radiance values were converted from spectral radiance to brightness temperature using the thermal constants with the following equation:
T = K2
lnK1L
λ+1
, (6)
where T =satellite brightness temperature (Kelvin), Lλ=TOA (Top of Atmosphere) spectral radiance, K1= calibration constant 1 from the metadata andK2= calibra-tion constant 2 from the metadata (Table 2).
Since brightness temperature (T) is a blackbody tempera-ture, the final step is the spectral emissivity according to the nature of the surface by temperature correction (Weng et al., 2004):
ST= TB
1+
λ·TBρ
·Lnε
Table 1.TM spectral range and post-calibration dynamic ranges.
Band Spectral Center LMIN LMAX Grescale Brescale
number range (µm) wavelength (w/(m2·sr·µm)) (w/(m2·sr·µm)) ((w/(m2·sr·µm))/DN) (w/(m2·sr·µm))
1 0.452–0.518 0.485 −1.52 169 0.671339 −2.19
−1.52 193 0.765827 −2.29
2 0.528–0.609 0.569 −2.84 333 1.322205 −4.16
−2.84 365 1.448189 −4.29
3 0.626–0.693 0.660 −1.17 264 1.043976 −2.21
4 0.776–0.904 0.840 −1.51 221 0.876024 −2.39
5 1.567–1.784 1.676 −0.37 30.2 0.120354 −0.49
6 10.45–12.42 11.435 1.2378 15.3032 0.055376 1.18
7 2.097–2.349 2.223 −0.15 16.5 0.065551 −0.22
Table 2.TM thermal band calibration constants.
Constant 1 – K1 Constant 2 – K2 (Kelvin)
(w/(m2·ster·µm))
Landsat 5 607.76 1260.56
where TB=satellite brightness temperature (Kelvin), λ=wavelength of emitted radiance (11.5 µm), ε=land surface emissivity, ρ=h·σc =1.438×10⁻²mK (σ =Boltzmann constant=1.38×10⁻²³J K−1, h=Planck’s constant=6.626×10⁻³⁴Js and c=velocity of light=2.998×10⁸m s−1).
Finally, derived land surface temperature in Kelvin was converted to Celsius by subtracting from 273.15.
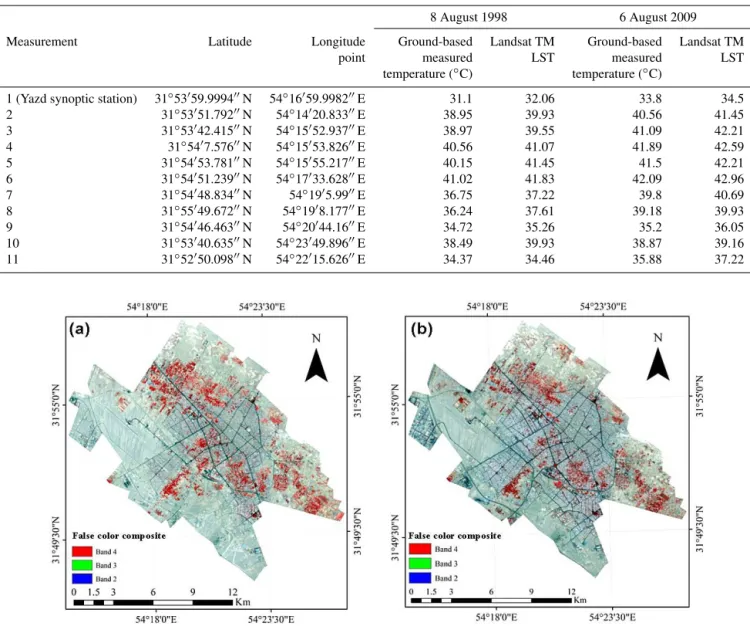
For processing satellite data and database building, the Gauss–Krueger coordinate system was selected. The false color composite imagery of Landsat TM data (8 August 1998 and 6 August 2009) covering the study area was produced in the ArcGIS environment (Fig. 3). Land use classes were se-lected in the false color composite imagery for supervised classification of image. Different land use types were clas-sified using maximum likelihood classification in ArcGIS environment (Fig. 4). Following land classification was ac-cepted using the Landsat TM data: asphalt road, park and green spaces, waste land and bare soil, fallow land, residen-tial (urban), commercial and industrial (Mallick et al., 2008). Classification was performed on Landsat TM for spectral reparability of the land use classes existing in the study area. Finally, the relationship between land use classes, surface temperature and NDVI in Yazd was analyzed in detail. 2.3 Calibration and validation of Landsat TM LST
and land use classification
The validation of LST by satellite products is performed us-ing ground-based measurements of surface temperature. In the present study, ground-based data of land surface temper-ature received from the Yazd Meteorological Bureau were
Figure 2.Location of the land surface temperature measurement points.
used to validate the LST of the Landsat TM sensors. Mea-suring land surface temperature was performed using ther-mometers with SMT160 temperature sensor. The thermome-ters have a temperature range of−45 to 130◦C. The most important characteristics of the SMT160 temperature sen-sor include absolute accuracy ∓0.7◦C and measurement range 175◦C. Geographical characteristics of the measure-ment points can be seen in Table 3 and Fig. 2.
2.4 Statistical analysis
(ground-Table 3.Coordinates of the land surface temperature measurement points and their ground-based and satellite temperatures.
8 August 1998 6 August 2009
Measurement Latitude Longitude Ground-based Landsat TM Ground-based Landsat TM
point measured LST measured LST
temperature (◦C) temperature (◦C)
1 (Yazd synoptic station) 31◦53′59.9994′′N 54◦16′59.9982′′E 31.1 32.06 33.8 34.5
2 31◦53′51.792′′N 54◦14′20.833′′E 38.95 39.93 40.56 41.45
3 31◦53′42.415′′N 54◦15′52.937′′E 38.97 39.55 41.09 42.21
4 31◦54′7.576′′N 54◦15′53.826′′E 40.56 41.07 41.89 42.59
5 31◦54′53.781′′N 54◦15′55.217′′E 40.15 41.45 41.5 42.21
6 31◦54′51.239′′N 54◦17′33.628′′E 41.02 41.83 42.09 42.96
7 31◦54′48.834′′N 54◦19′5.99′′E 36.75 37.22 39.8 40.69
8 31◦55′49.672′′N 54◦19′8.177′′E 36.24 37.61 39.18 39.93
9 31◦54′46.463′′N 54◦20′44.16′′E 34.72 35.26 35.2 36.05
10 31◦53′40.635′′N 54◦23′49.896′′E 38.49 39.93 38.87 39.16
11 31◦52′50.098′′N 54◦22′15.626′′E 34.37 34.46 35.88 37.22
Figure 3.False color composite (bands 2, 3 and 4) image of Landsat TM data of Yazd city:(a)8 August 1998,(b)6 August 2009.
based) and predicted (by satellite data) land surface temper-atures (Xiaolei et al., 2014). For the investigated area, accu-racy assessment of land surface temperatures retrieved from the TES algorithm was performed by RMSE andR2 param-eters (Fig. 9 and Table 8). The statistical analysis of the re-lationship between NDVI, surface temperature and land use type changes was performed (Fig. 10 and Tables 9, 10).
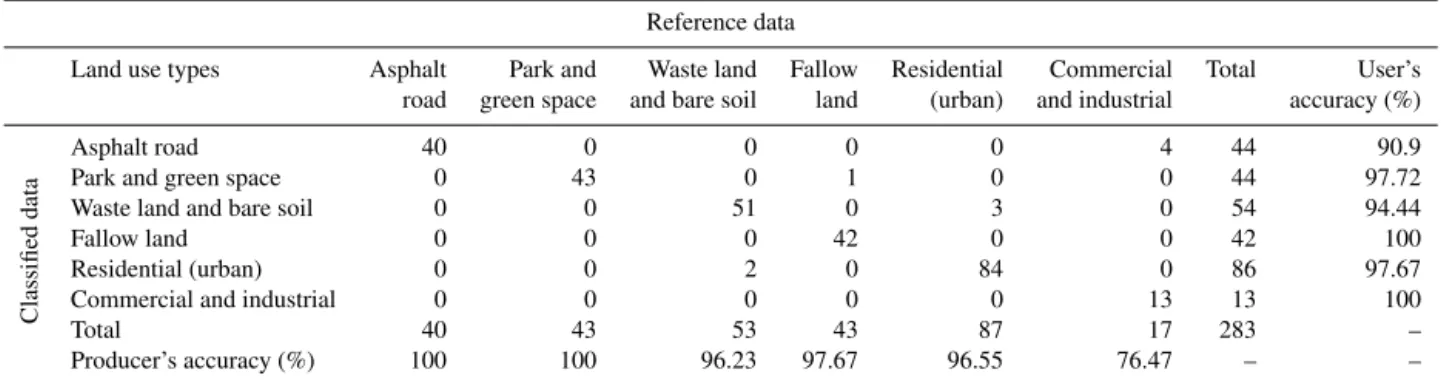
The Kappa coefficient and overall accuracy were used to validate the land use classification. The error matrix is used as an analytical statistical technique. The simplest descrip-tive statistical indicator is overall accuracy, which can be cal-culated using error matrix. Producer’s accuracy is the prob-ability that a pixel in the classified image is placed in the same class on land. In the calculation, the correct pixel to-tal in each class is divided by the pixel toto-tal of that class as derived from the reference data. The producer’s accuracy
Figure 4.Land use classified image of Yazd city by maximum likelihood classification:(a)8 August 1998,(b)6 August 2009.
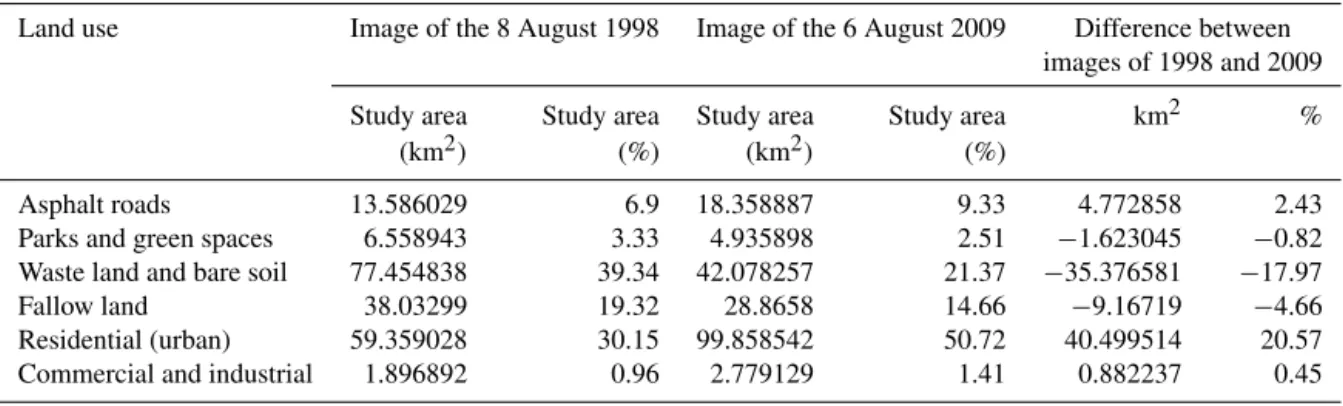
Table 4.Land use distribution of Yazd city using maximum likelihood classification.
Land use Image of the 8 August 1998 Image of the 6 August 2009 Difference between
images of 1998 and 2009
Study area Study area Study area Study area km2 %
(km2) (%) (km2) (%)
Asphalt roads 13.586029 6.9 18.358887 9.33 4.772858 2.43
Parks and green spaces 6.558943 3.33 4.935898 2.51 −1.623045 −0.82
Waste land and bare soil 77.454838 39.34 42.078257 21.37 −35.376581 −17.97
Fallow land 38.03299 19.32 28.8658 14.66 −9.16719 −4.66
Residential (urban) 59.359028 30.15 99.858542 50.72 40.499514 20.57
Commercial and industrial 1.896892 0.96 2.779129 1.41 0.882237 0.45
3 Results
3.1 Analysis of land use
By classifying land uses of the study area, six land use types for the study area were considered: asphalt roads, parks and green spaces, waste land and bare soil, fallow land, residen-tial, commercial and industrial areas. The land use distribu-tion in Yazd is described in Table 4. By comparing area per-centage values of different land use classes between images, it can be concluded that land use types of the study area were significantly converted in the 11-year period. Table 4 shows that the asphalt roads, commercial, industrial and residential (urban) classes of land use were increased. However, parks, green spaces, fallow lands, waste lands and bare soils were decreased during the time. The study results show that res-idential areas increased most compared to the other classes of land use. The main changes include conversion of parks, green spaces, bare soils and fallow lands to residential areas.
For example in the 1998 image, by comparing the refer-ence and classified data in the Table 5, it was observed that although 100 % of the asphalt roads were being correctly identified as asphalt roads, only 90.9 % of the areas called asphalt roads are actually asphalt roads.
Table 5.Error matrix used to assess the accuracy of a classification of the 8 August 1998 Landsat TM image.
Reference data
Land use types Asphalt Park and Waste land Fallow Residential Commercial Total User’s road green space and bare soil land (urban) and industrial accuracy (%)
Classified
data
Asphalt road 40 0 0 0 0 4 44 90.9
Park and green space 0 43 0 1 0 0 44 97.72
Waste land and bare soil 0 0 51 0 3 0 54 94.44
Fallow land 0 0 0 42 0 0 42 100
Residential (urban) 0 0 2 0 84 0 86 97.67
Commercial and industrial 0 0 0 0 0 13 13 100
Total 40 43 53 43 87 17 283 –
Producer’s accuracy (%) 100 100 96.23 97.67 96.55 76.47 – –
Table 6.Error matrix used to assess the accuracy of a classification of the 6 August 2009 Landsat TM image.
Reference data
Land use types Asphalt Park and Waste land Fallow Residential Commercial Total User’s road green space and bare soil land (urban) and industrial accuracy (%)
Classified
data
Asphalt road 20 0 0 0 2 1 23 86.96
Park and green space 0 21 0 0 0 0 21 100
Waste land and bare soil 0 0 26 0 0 0 26 100
Fallow land 0 2 0 22 0 0 24 91.67
Residential (urban) 1 0 2 0 42 0 45 93.33
Commercial and industrial 0 0 0 0 0 16 16 100
Total 21 23 28 22 44 17 155 –
Producer’s accuracy (%) 95.24 91.3 92.86 100 95.45 94.12 – –
75 80 85 90 95 100 105
Asphalt road Park and
green space and bare soilWaste land Fallow land Residential(urban) and industrialCommercial
A
ccu
ra
cy
(
%
)
User’s accuracy (%)
Producer’s accuracy (%)
Figure 5.Land use classes User’s and producer’s accuracy of the 8 August 1998 Landsat TM image.
75 80 85 90 95 100 105
Asphalt road Park and
green space
Waste land and bare soil
Fallow land Residential
(urban)
Commercial and industrial
A
ccu
ra
cy
(
%
) User’s accuracy
(%)
Producer’s accuracy (%)
Figure 7.Spatial distribution of NDVI obtained from Landsat TM data:(a)8 August 1998,(b)6 August 2009.
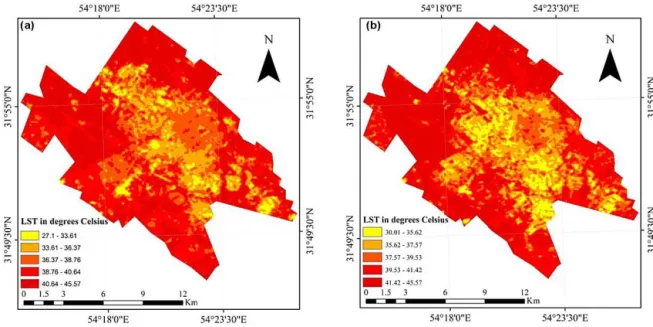
Figure 8.Land surface temperature retrieved from Landsat TM TIRS data at urban area of Yazd city:(a)8 August 1998,(b)6 August 2009.
3.2 Analysis of vegetation situation and NDVI
The spatial distribution of NDVI values from the Landsat TM image can be seen in Fig. 7. The 1998 NDVI values are in the range of−0.2 to 0.59, having a mean value of 0.195, and the 2009 NDVI values are in the range of−0.17 to 0.41, having a mean value of 0.12 (Fig. 7). In the figure it is shown that low values of NDVI (light green area) correspond to waste land, bare soil, commercial, industrial and residential areas on the different parts mainly in the southern and western sec-tions of the study area. High values of NDVI (dark green) that were observed in the central, north and southwest parts of the images correspond to parks and green spaces. The
green spaces in the year 2009 image are from 0.982 to 0.99, emissivity values of the fallow land class are from 0.979 to 0.982 and emissivity values of the asphalt roads, commercial and industrial, residential, waste land and bare soil are from 0.97 to 0.979. Wheat and barley are mainly grown in the agri-cultural lands of the study area (seasonal plants), which in the performed classification are placed on the fallow land class.
3.3 Land surface temperature analysis
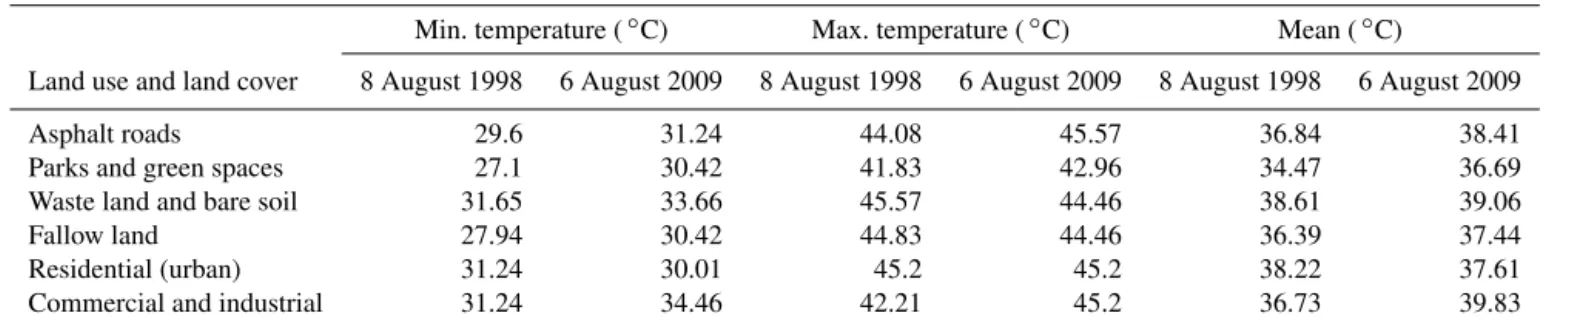
In the present study, land surface temperature was retrieved by the TES algorithm from TIRS (Thermal Infrared Sen-sor) data of the Landsat TM. The spatial distribution of sur-face temperature of the 1998 and 2009 images is shown in the Fig. 8. Surface temperature of the 1998 LST image ranged from 27.1 to 45.57◦C (mean of 36.34◦C), and sur-face temperature of the 2009 LST image ranged from 30.01 to 45.57◦C (mean of 37.79◦C). In the Fig. 8 high surface temperatures are shown by the dark red areas, this means that outlying parts of the city have a temperature higher than the central part. The results indicated that the average tem-perature of Yazd increased from 36.34 to 37.79◦C. Devel-opments in asphalt roads, residential and commercial areas increased dramatically between 1998 and 2009, and vegeta-tion cover has been reduced. The combinavegeta-tion of menvegeta-tioned factors caused an increase the overall temperature of the city. In the 1998 classified image, bare soil and waste land (mean value 38.61◦C) and residential (mean value 38.22◦C) classes have maximum values of surface temperature, and parks and green spaces have minimum values (mean value 34.47◦C). In the 2009 images, bare soil and waste land (mean value 39.06◦C), commercial and industrial (mean value 39.83◦C) classes have maximum values of surface temperature, and parks and green spaces have minimum val-ues (mean value 36.69◦C) (Fig. 8 and Table 7).
For the investigated area, results show that the land sur-face temperatures retrieved from TES algorithm using Land-sat TM sensor data have a high accuracy with a RMSE of 0.9◦C and 0.87◦C for 1998 and 2009 images, respectively. TheR2between the measured and predicted temperatures is 0.98 and 0.99 for 1998 and 2009, respectively (Fig. 9 and Table 8).
3.4 Statistical analysis of the relationship between land surface temperature, normalized difference vegetation index (NDVI) and land use changes
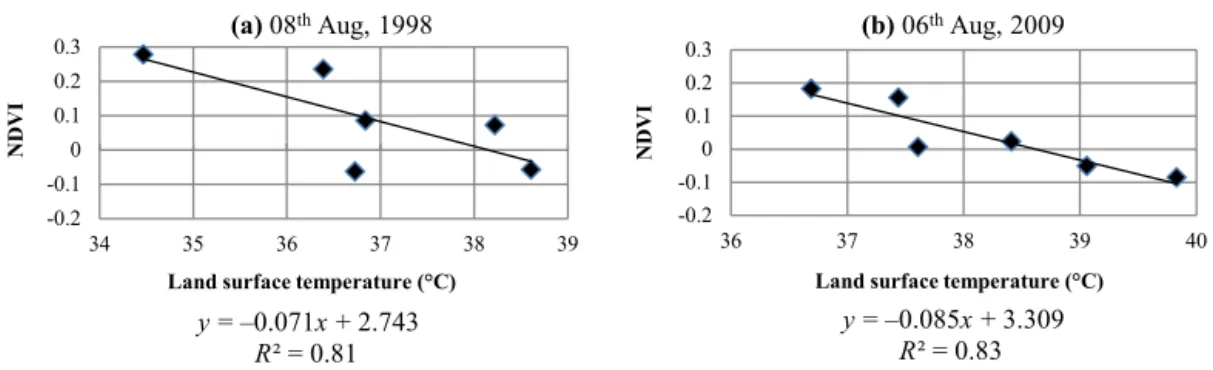
In the present study, a strong relation was observed be-tween NDVI, surface temperature and land use types changes (Fig. 10 and Tables 9 and 10). The spatial variations of surface temperature are affected by the conversion of land for human-dominated use (land use change) and vegetation cover. There is a linear regression between surface tempera-ture and NDVI (Fig. 10).
The significant differences less than 0.01 between NDVI values and temperatures of land use types for the 1998 and 2009 cases were obtained through statistical analysis of NDVI values and surface temperatures. According to the mentioned significant difference can be concluded that with a probability of 99 % a decrease in the NDVI values caused to increase temperature (Table 10).
4 Discussions
This paper proposed the TES algorithm to obtain LST from Landsat TM and change detection in land surface tempera-ture in relation to land use change. The spatial scales of TIRS pixel (100 m), land use and NDVI products (30 m) can re-duce accuracy of the results. The classified images show that the agricultural lands were classified as fallow land, and it was also observed that in some places of study fallow lands have been combined with waste land and bare soil because of the similar values between their spectral reflectance. As a result, the main factor of the conversion of land use types of study area in the 11-year period is the human activities for urban growth. Based on the results, the classified im-ages have significantly good accuracy over different land use types. Wheat and barley are mainly grown in the agricultural lands of the study area (seasonal plants) that in the performed classification are placed on the fallow land class because of similar values of spectral reflectance of these products and fallow lands. It should be noted that these agricultural products were harvested in May. As mentioned in Sect. 3.2, the NDVI values decreased over the studied period of time (1998–2009) because of plant-covered surface reduction. It should be noted that the central part of the study area had a slight decrease in the surface temperature. It was proba-bly due to the design and implementation of artificial green spaces and parks by managers in the city. Also, many cooling devices, which are used in residential areas (especially in the summer), were effective in creating this micro-climate. How-ever, reduction of vegetation cover and NDVI values and the consequent rise in temperature were observed in the entire study area. A higher temperature of outlying parts than the central part of city was due to keeping and increase parks and green spaces in the central part and the destruction of vegetation in the outlying parts of the city. Meanwhile, an in-crease in the overall temperature of Yazd is due to different reasons, including vegetation loss and land use change in the area.
y = 1.041x – 0.728
R² = 0.98 RMSE = 0.9 °C 30
32 34 36 38 40 42 44
30 32 34 36 38 40 42
LS
T (
°C)
Maseard (ground-based) temperature (°C) (a) 08th Aug, 1998
y = 0.991x + 1.176
R² = 0.99 RMSE = 0.9 °C 32
34 36 38 40 42 44
32 34 36 38 40 42 44
LS
T (
°C)
Measerd (ground-based) temperature (°C) (b) 06th Aug, 2009
Figure 9.Linear relationship between ground-based measured temperature and land surface temperature (LST) of Landsat TM sensor:(a)8
August 1998,(b)6 August 2009.
Table 7.Land surface temperature of different land use categories of Yazd city.
Min. temperature (◦C) Max. temperature (◦C) Mean (◦C)
Land use and land cover 8 August 1998 6 August 2009 8 August 1998 6 August 2009 8 August 1998 6 August 2009
Asphalt roads 29.6 31.24 44.08 45.57 36.84 38.41
Parks and green spaces 27.1 30.42 41.83 42.96 34.47 36.69
Waste land and bare soil 31.65 33.66 45.57 44.46 38.61 39.06
Fallow land 27.94 30.42 44.83 44.46 36.39 37.44
Residential (urban) 31.24 30.01 45.2 45.2 38.22 37.61
Commercial and industrial 31.24 34.46 42.21 45.2 36.73 39.83
Table 8.Accuracy assessment of land surface temperature derived from Landsat TM sensor data using calculation RMSE andR2.
LST Landsat TM sensor images Root mean square error (RMSE) Coefficient of determination (R2)
8 August 1998 0.9 0.98
6 August 2009 0.87 0.99
Table 9.Relationship between surface temperatures with NDVI of the different land use categories.
Mean temperature (◦C) NDVI value (mean)
Land use and land cover 8 August 1998 6 August 2009 8 August 1998 6 August 2009
Asphalt roads 36.84 38.41 0.085 0.023
Parks and green spaces 34.47 36.69 0.278 0.182
Waste land and bare soil 38.61 39.06 −0.058 −0.051
Fallow land 36.39 37.44 0.235 0.155
Residential (urban) 38.22 37.61 0.072 0.006
Commercial and industrial 36.73 39.83 −0.063 −0.086
surface temperature. This means that a decrease in NDVI corresponds to an increase in the temperature of land use types and vice versa. The strongest inverse relationship be-tween surface temperature and NDVI values was observed in the fallow lands, parks and green spaces. By reducing vegetation density (in this study waste land and bare soil), the inverse relationship between surface temperature and the
Accord-y = –0.071x + 2.743
R² = 0.81 -0.2
-0.1 0 0.1 0.2 0.3
34 35 36 37 38 39
NDVI
Land surface temperature (°C) (a) 08th Aug, 1998
y = –0.085x + 3.309
R² = 0.83 -0.2
-0.1 0 0.1 0.2 0.3
36 37 38 39 40
NDVI
Land surface temperature (°C) (b) 06th Aug, 2009
Figure 10.Linear relationship between NDVI values and land surface temperature (LST) of Landsat TM sensor:(a)8 August 1998,(b)6 August 2009.
Table 10.Variance analysis of relationship between land surface temperature and normalized difference vegetation index (NDVI) retrieved from Landsat TM data.
Landsat TM data date Source Sum of squares df Mean square P level
8 August 1998 Between groups 0.510 5 0.102 0.000
Within groups 0.000 24 0.000
Total 0.510 29
6 August 2009 Between groups 0.295 5 0.059 0.000
Within groups 0.000 24 0.000
Total 0.295 29
ing to the received results, NDVI values were decreased dur-ing the study time. Land use type changes were causdur-ing sur-face temperature increasing, and temperature increasing sub-sequently was causing changes in NDVI and vegetation cov-ers in the study area. The decrease in vegetation cover and an increase in residential areas are the main reasons of decreas-ing NDVI values of Yazd. Land use gradual changes durdecreas-ing the time are causing the temperature change. In Yazd, surface temperature has increased as a result of increases in asphalt roads, commercial, industrial and residential areas and a de-crease in parks, green spaces and fallow land classes in 2009 compared to 1998. However, waste land and bare soil de-creased, whereas asphalt roads, commercial, industrial and residential areas increased, and these changes caused a rise in temperature. Other studies also confirm that the LST and NDVI changes are due to changes of the vegetation cover and residential areas. Studies by Gong et al. (2015) and Valor and Caselles (1996) showed that NDVI and LST val-ues show trends in vegetation cover and phenology changes. A study by Sandra et al. (2015) showed that land degrada-tion and regeneradegrada-tion areas can be investigated using NDVI satellite data. NDVI correlates highly with tree canopy cover and other types of land uses (Wei et al., 2015). Mallick et al. (2008) investigated LST index using the vegetation abun-dance, and in their study, a strong correlation was observed between surface temperatures with NDVI over different land use types.
5 Conclusions
percentage of Yazd areas are residential areas, fallow lands, waste land and bare soil, and this is directly related to the climate (arid and semi-arid climate) and human activities.
6 Data availability
In the present study, were used unprocessed data of the Landsat TM sensor provided by United States Geological Survey (USGS, 2016) (http://earthexplorer.usgs.gov/), and ground-based data of land surface temperature received from the Yazd Meteorological Bureau were used to validate the LST products.
Edited by: P. Pereira
Reviewed by: B. Miller and two anonymous referees
References
André, C., Ottlé, C., Royer, A., and Maignana, F.: Land surface tem-perature retrieval over circumpolar Arctic using SSM/I–SSMIS and MODIS data, Remote Sens. Environ., 162, 1–10, 2015. Baihua, F. and Isabela, B.: Riparian vegetation NDVI dynamics and
its relationship with climate, surface water and groundwater, J. Arid Environ., 113, 59–68, 2015.
Baojuan, Z., Soe, W. M., Prasad S. T., and Rimjhim M. A.: A sup-port vector machine to identify irrigated crop types using time-series Landsat NDVI data, Int. J. Appl. Earth Obs., 34, 103–112, 2015.
Beniston, J. W., Lal, R., and Mercer, K. L.: Assessing and Manag-ing Soil Quality for Urban Agriculture in a Degraded Vacant Lot Soil, Land Degrad. Dev., 27, 996–1006, 2016.
Berendse, F., Van Ruijven, J., Jongejans, E., and Keesstra, S.: Loss of plant species diversity reduces soil erosion resistance, Ecosys-tems, 18, 881–888, 2015.
Bingwei, T., Ling, W., Koki K., and Katsuaki.: Combination of Well-Logging Temperature and Thermal Remote Sensing for Characterization of Geothermal Resources in Hokkaido, North-ern Japan, Remote Sens. 7, 2647–2667, 2015.
Brevik, E. C., Cerdà, A., Mataix-Solera, J., Pereg, L., Quinton, J. N., Six, J., and Van Oost, K.: The interdisciplinary nature of SOIL, SOIL, 1, 117–129, doi:10.5194/soil-1-117-2015, 2015. Decock, C., Lee, J., Necpalova, M., Pereira, E. I. P., Tendall,
D. M., and Six, J.: Mitigating N2O emissions from soil: from
patching leaks to transformative action, SOIL, 1, 687–694, doi:10.5194/soil-1-687-2015, 2015.
Dehghan, A. A.: Status and potentials of renewable energies in Yazd Province-Iran, Renew. Sust. Energ. Rev., 15, 1491–1496, 2011. Dehua, M., Zongming, W., Ling, L., and Chunying,R.: Integrating
AVHRR and MODIS data to monitor NDVI changes and their relationships with climatic parameters in Northeast China, Int. J. Appl. Earth Obs., 18, 528–536, 2012.
Ferreira, C. S. S., Ferreira, A. J. D., Pato, R. L., Magalhães, M. C., Coelho, C. O., and Santos, C.: Rainfall-runoff-erosion relation-ships study for different land uses, in a sub-urban area, Z. Geo-morphol., 56, 5–20, 2012.
Ferreira, C. S. S., Walsh, R. P. D., Steenhuis, T. S., Shakesby, R. A., Nunes, J. P. N., Coelho, C. O. A., and Ferreira, A. J. D.:
Spa-tiotemporal variability of hydrologic soil properties and the im-plications for overland flow and land management in a peri-urban Mediterranean catchment, J. Hydrol., 525, 249–263, 2015. France, G. B. and Cracknell, A. P.: Retrieval of land and sea
sur-face temperature using NOAA-11 AVHRR data in north-eastern Brazil, Int. J. Remote Sens., 15, 1695–1712, 1994.
Gong, Z., Kawamura, K., Ishikawa, N., Goto, M., Wulan, T., Alateng, D., Yin, T., and Ito, Y.: MODIS normalized differ-ence vegetation index (NDVI) and vegetation phenology dynam-ics in the Inner Mongolia grassland, Solid Earth, 6, 1185–1194, doi:10.5194/se-6-1185-2015, 2015.
Guanhua, G., Zhifeng, W., Rongbo, X., Yingbiao, C., Xiaonan, L., and Xiaoshi, Z.: Impacts of urban biophysical composition on land surface temperature in urban heat island clusters, Landscape Urban Plan., 135, 1–10, 2015.
José, A., Sobrinoa, J., Jiménez-Muñoza, C., and Paolini, L.: Land surface temperature retrieval from LANDSAT TM 5, Remote Sens. Environ., 90, 434–440, 2004.
Juan, C., Jiménez-Muñoz, J., Sobrino, A., Skokovi´c, D., Mattar, C., and Cristóbal, J.: Land Surface Temperature Retrieval Methods from Landsat-8 Thermal Infrared Sensor Data, IEEE Geosci. Re-mote S., 11, 1840–1843, 2014.
Keesstra, S. D., Bouma, J., Wallinga, J., Tittonell, P., Smith, P., Cerdà, A., Montanarella, L., Quinton, J. N., Pachepsky, Y., van der Putten, W. H., Bardgett, R. D., Moolenaar, S., Mol, G., Jansen, B., and Fresco, L. O.: The significance of soils and soil science towards realization of the United Nations Sustainable Development Goals, SOIL, 2, 111–128, doi:10.5194/soil-2-111-2016, 2016.
Mallick, J., Kant, Y., and Bharath, B. D.: Estimation of land surface
temperature over Delhi using Landsat-7 ETM+, J. Ind. Geophys.
Union, 12, 131–140, 2008.
Mol, G. and Keesstra, S.: Soil science in a changing world, Current Opinion in Environmental Sustainability, 4, 473–477, 2012. Niu, C. Y., Musa, A., and Liu, Y.: Analysis of soil moisture
condi-tion under different land uses in the arid region of Horqin sandy land, northern China, Solid Earth, 6, 1157–1167, doi:10.5194/se-6-1157-2015, 2015.
Owen, T. W., Carlson, T. N., and Gillies, R. R.: Remotely sensed surface parameters governing urban climate change, Int. J. Re-mote Sens., 19, 1663–1681, 1998.
Salisbury, J. W. and D’Aria, D. M.: Emissivity of Terrestrial Mate-rials in the 8 to 14 micro meter Atmospheric Window, Remote Sens. Environ., 42, 83–106, 1992.
Salisbury J. W. and D’Aria, D. M.: Emissivity of Terrestrial Materi-als in the 2 to 5 micro meter Atmospheric Window, Remote Sens. Environ., 47, 345–361, 1994.
Sandra, E., Fabia, H., Hanspeter, L., and Elias, H.: Trend analysis of MODIS NDVI time series for detecting land degradation and regeneration in Mongolia, J. Arid Environ., 113, 16–28, 2015. Santamouris, M., Papanikolaou, N., Livada, I., Koronakis, I.,
Geor-gakis, C., Argiriou, A., and Assimakopoulos, D. N.: On the im-pact of urban climate on the energy consumption of buildings, Sol. Energy, 70, 201–216, 2001.
Schultz, P. A. and Halpert, M. S.: Global correlation of temperature, NDVI and precipitation, Adv. Space Res., 13, 277–280, 1993. Smith, P., Cotrufo, M. F., Rumpel, C., Paustian, K., Kuikman, P. J.,
P. C., Gerber, J. S., Clark, J. M., Adhya, T., Scholes, R. J., and Scholes, M. C.: Biogeochemical cycles and biodiversity as key drivers of ecosystem services provided by soils, SOIL, 1, 665– 685, doi:10.5194/soil-1-665-2015, 2015.
Story, M. and Congalton, R.: Accuracy assessment: a user’s per-spective, Photogramm. Eng. Rem. S., 52, 397–399, 1986. Streutker, D. R.: Satellite-measured growth of the urban heat island
of Houston, Texas, Remote Sens. Environ., 85, 282–289, 2003. USGS: Landsat TM sensor data, available at: http://earthexplorer.
usgs.gov/, last access: 17 October 2016.
Valor, E. and Caselles, V.: Mapping land surface emissivity from NDVI. Application to European, African and South American areas, Remote Sens. Environ., 57, 167–184, 1996.
Van Eck, C., Nunes, J., Vieira, D., Keesstra, S., and Keizer, J.: Physically-based modelling of the post-fire runoff response of a forest catchment in central Portugal: using field vs. remote sens-ing based estimates of vegetation recovery, Land Degrad. Dev., 27, 1535–1544, 2016.
Wei, L., Jean-Daniel, M. S., and Thomas, W. G.: A comparison of the economic benefits of urban green spaces estimated with NDVI and with high-resolution land cover data, Landscape Ur-ban Plan., 133, 105–117, 2015.
Weixin, X., Song, G., Xin Quan, Z., Jianshe, X., Yanhong, T., Jingyun, F., Juan, Z., and Sha, J.: High positive correlation be-tween soil temperature and NDVI from 1982 to 2006 in alpine meadow of the Three-River Source Region on the Qinghai-Tibetan Plateau, Int. J. Appl. Earth Obs., 13, 528–535, 2011. Weng, Q.: Fractal analysis of satellite detected urban heat island
effect, Photogramm. Eng. Rem. S., 69, 555–566, 2003. Weng, Q., Lu, D., Schubring, J.: Estimation of land surface
temperature-vegetation abundance relationship for urban heat is-land studies, Remote Sens. Environ., 89, 467–483, 2004. Xiaolei, Y., Xulin, G., and Zhaocong, W.: Land Surface
Tempera-ture Retrieval from Landsat 8 TIRS – Comparison between Ra-diative Transfer Equation-Based Method, Split Window Algo-rithm and Single Channel Method, Remote Sens., 6, 9829–9852, 2014.