Quantification of Ethanol Concentration in
Gasoline Using Cuprous Oxide Coated
Long Period Fiber Gratings
Filipe Monteiro-Silva , José Luís Santos, José Manuel Marques Martins de Almeida, and Luis Coelho
Abstract— It is reported a new optical sensing system, based on long period fiber gratings (LPFGs) coated with cuprous oxide (Cu2O), for the quantification of ethanol concentration
in ethanol-gasoline mixtures. The detection principle is based on the spectral features dependence of the Cu2O coated LPFGs on
the refractive index of the surrounding medium. The chemical constitution of the ethanol-gasoline samples was obtained by gas chromatography mass spectrometry (GC) and GC thermal conductivity detection. Two different modes of operation are presented, wavelength shift and optical power shift mode of operation, with good linear relations between ethanol concen-tration and the corresponding spectral features of the LPFGs, R2 = 0.999 and 0.996, respectively. In the range of ethanol concentration up to 30% v/v, the sensitivities were 0.76 ± 0.01 nm/% v/v and 0.125 ± 0.003 dB/% v/v with resolutions of 0.21% v/v and 0.73% v/v and limits of detection of 1.63% v/v and 2.10% v/v, for the for the same operation modes, respectively. Index Terms— Monitoring ethanol in gasoline, gasoline optical sensor, coated long period fiber grating, bioethanol.
I. INTRODUCTION
G
ASOLINE is a blend of volatile and flammable hydro-carbons, obtained by the fractional distillation of petroleum or crude oil, enhanced with a variety of addi-tives, Nowadays ethanol is an important additive to gasoline. Ethanol-gasoline mixture has some benefits over the pure gasoline. It is a low-cost additive, relevant in the reduction in air pollutant emissions, and increases the research octane Manuscript received October 19, 2017; revised November 28, 2017; accepted December 4, 2017. Date of publication December 11, 2017; date of current version January 18, 2018. This work was supported in part by the North Portugal Regional Operational Program through the PORTUGAL 2020 Partnership Agreement under Grant NORTE 2020 and in part by the Regional Development Fund within the Coral-Sustainable Ocean Exploitation: Tools and Sensors Project under Grant NORTE-01-0145-FEDER-000036. The associate editor coordinating the review of this paper and approving it for publication was Dr. Minghong Yang. (Corresponding author:José Manuel Marques Martins de Almeida.)
F. Monteiro-Silva and L. Coelho are with INESC TEC-Technology and Science and FCUP-Faculty of Sciences, University of Porto, 4169-007 Porto, Portugal (e-mail: [email protected]; [email protected]).
J. L. Santos is with INESC TEC-INESC Technology and Science, FCUP-Faculty of Sciences, University of Porto, 4169-007 Porto, Portugal, and also with the Department of Physics and Astronomy, FCUP-Faculty of Sciences, University of Porto, 4169-007 Porto, Portugal (e-mail: [email protected]).
J. M. M. M. de Almeida is with INESC TEC-INESC Technology and Science, FCUP-Faculty of Sciences, University of Porto, 4169-007 Porto, Portugal, also with the Department of Physics and Astronomy, FCUP-Faculty of Sciences, University of Porto, 4169-007 Porto, Portugal, and also with the Department of Physics, School of Sciences and Technology, University of Trás-os-Montes and Alto Douro, 5001-801 Vila Real, Portugal (e-mail: [email protected]).
Digital Object Identifier 10.1109/JSEN.2017.2782566
number (RON) of gasoline blend and provides better perfor-mance of combustion engines [1]. Gasoline can be adulterated by the illegal addition of ethanol, in proportions higher than those stated [2].
In certain countries, gasoline cannot be supplied to con-sumers as is and the addition of ethanol with concentrations up to 25% v/v is required.
Several analytical techniques for the quantification of ethanol and other additives in gasoline are available in the lit-erature, namely, Fourier Transform Infrared Spectroscopy [3] and Near Infrared Spectroscopy [4], Gas Chromatogra-phy Mass Spectrometry (GC-MS) [5], Nuclear Magnetic Resonance (1H NMR) [6] and Flame Emission Spec-troscopy (FES) in tandem with chemometrics [7]. High-resolution measurements centered on these techniques require expensive equipment and high purity chemicals. In addition, they are not suitable for real-time field measurement. Conse-quently, the development and implementation of alternative methodologies to quantify the concentration of ethanol in ethanol-gasoline mixtures is of paramount importance.
Optical fiber sensors based on long period fiber gratings (LPFGs) have been extensively studied in past years due to their advantages relatively to conventional devices, namely: the potential to be a sensor and a waveguide at the same time; the intrinsic immunity to electromagnetic radiation, small dimensions, low weight, flexibility, high melting temperature, low reactivity of silica (enabling measurement in harsh envi-ronments); or the multiplexing capabilities allowing spatially distributed points of measurement, long-distance transmission, possibility of real-time monitoring, high sensitivity and very high bandwidth [8]. They have been applied for sensing of strain, bending and temperature, for the detection of volatile organic compounds, monitoring foodstuff, as hybrid LPFG - microfluidic chip for glucose detection, and aptamer-based for thrombin detection, just to name a few recent results. Se for examples [9]–[11] and refeeences therein. However, LPFGs inscribed in hollow-core photonic bandgap fiber are insensitive to environmental refractive index variation [12], which enable the realization of optical sensors immune to the variation of the surrounding refractive index (SRI) [13].
LPFGs are produced by introducing a refractive index (RI) modulation in the fiber core with periods from 100 to 1000μm and a length of a few centimeters [14]. In specific situations a phase matching condition between the fundamental core mode and a forward propagating cladding modes of an optical fiber 1558-1748 © 2017 IEEE. Personal use is permitted, but republication/redistribution requires IEEE permission.
exists. As a result several attenuation bands are generated in the transmission spectrum of the optical fiber [15] each one exhibiting high spectral dependence with the SRI. As the SRI changes from low RI to near the cladding refractive index (CRI), the principal effect is a shift of the attenuation bands to shorter wavelengths and a decrease of the absolute attenuation [8]. The sensitivity to the RI of the medium adjoin-ing the gratadjoin-ing region allows the use of LPFGs as sensadjoin-ing components in chemical and biochemical measurements [15]. It has been demonstrated [16], that the highest wavelength shift and optical power shift sensitivity of the LPGFs occurs for SRI values slightly lower that the CRI [17], [18]. However, the sensitivity of the LPFGs decay abruptly as the RI decreases below the CRI and they are insensitive to SRI higher than the CRI. This weakness can be solved by coating the basic LPFG with a material that has a RI higher than the CRI [19]. The spectral response changes according to the RI and the thickness of the coating [20]. The properties of LPFGs coated with Langmuir-Blodgett nanolayers [18], [21] and with a titanium dioxide (TiO2) thin film [22] were reported.
More recently, LPFGs coated with cuprous (Cu2O-cuprite) and cupric (CuO-tenorite) oxides were produced and charac-terized in a wide RI range [23]. An examination of the results shows that these LPFGs have increased sensitivity to the SRI in the RI range characteristic of gasoline.
In this work, LPFGs coated with a Cu2O thin film were employed to measure ethanol concentration in ethanol-gasoline mixtures with concentrations between 1.5 and 30% v/v with higher sensitivity than previously reported, using uncoated LPFGs [24]. In addition, the sensing scheme herein proposed aims the detection of lower ethanol concentrations taking advantage of the optical characteristics of the LPFGs coated with cuprous oxide.
This optical characterization allows estimating the concen-tration of ethanol in ethanol-gasoline samples avoiding the expensive gas chromatography techniques used to obtain the chemical constitution of the samples. Moreover, this optical technique gives the possibility of real-time measurement in flow configurations, which is not possible with the sampling based techniques. The commercial 95 RON gasoline and its mixtures with different concentrations of ethanol are here analyzed by gas chromatography providing the identification of the chemical profile of the gasoline and quantification of the ethanol concentration in several samples aiming to support the results obtained with the optical technique.
II. MATERIALS ANDMETHODS A. Sensor Fabrication
The LPFGs sensors were produced by using the induced electric-arc technique following the method described in [22]. The RI modulation is accomplished through the formation of micro tapers by applying point-to-point short time electric discharges in 10 cm long section of uncoated single mode optical fiber (SMF28, Corning, Inc.). The number of micro tapers increases the attenuation of the transmitted rejecting bands to values above 26 dB at∼1.45 μm corresponding to a sensor length of 40± 5 mm and matching the antisymmetric
6thorder cladding mode LP1,6. This is a reliable technique and avoids sensitive and expensive equipment, however, there is a limitation related with the minimum size of the electric arc created around the fiber and it is known that the sensitivity is higher for higher order modes obtained, for example, by lowering the period of the gratings.
Following the methodology described in [23], a Cu thin film of was deposited around the LPFG by means of an electron beam evaporator Auto 306 (Edwards Ltd, U.K.) fitted with a rotary system located inside the vacuum chamber. The thick-ness of the Cu thin film was measured by a FTM5 thickthick-ness monitor (Edwards Ltd., U.K.) with a resolution of 0.1 nm. The real thickness of Cu around the cylindrical fiber was calculated after a calibration which consisted on measuring the thickness of a set of static and rotating planar substrates using the thickness monitor and a DektakXT surface profiler (Bruker Co., U.S.A.). A thin layer of Cr (3 nm) was pre-viously deposited around the fiber to improve the adhesion of the 30 nm thick Cu thin film. The metallic coated LPFG was then placed in the central region of a tubular furnace (Termolab, Portugal) allowing the oxidation of the Cu thin film with a controlled temperature. It was accomplished in an air atmosphere at 225°C for 2 hours in order to obtain cuprous oxide (Cu2O) around the LPFG [23]. After the cooling process down to the room temperature, the thin film maintains the same stable oxidation phase. It must be indicated that according to published results [23], there is no degradation of the optical characteristics of the LPFG when annealing at temperature up to∼600°C.
B. Sample Preparation
Gasoline samples were collected in proper containers, transported in non-volatilization conditions, and analyzed immediately upon arrival. Samples of ethanol-gasoline were prepared with different concentrations of ethanol (individual total volume of 25 mL), from 0% (pure gasoline) to 30% v/v in 3% v/v steps plus 1.5% v/v and mixed using a vortex mixer (model ZX3, Neu-TEC Group Inc, USA) to ensure total homogenization. Afterwards, all samples were stored in hermetic glass vials at −77 ± 3°C. Each sample was characterized through optical and GC-TCD techniques in the shortest time possible.
C. Experimental Setup
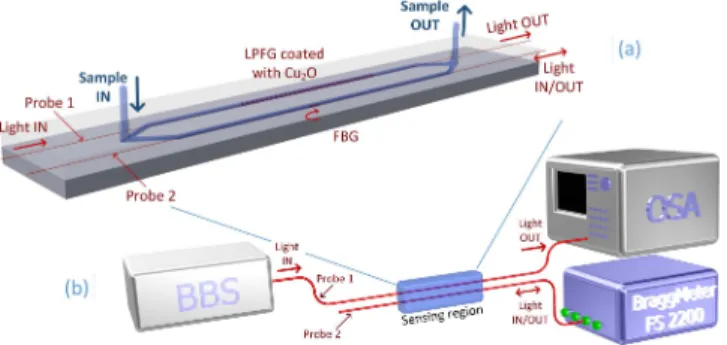
The optical measurement setup is shown in Fig. 1 (a). A homemade flow cell made of Poly (methyl methacry-late) (PMMA) with two identical channels and six openings is observed, four of them are used to feed with fibers containing sensors and the other two to fill and drain the liquid samples. Besides the LPFG sensor (Probe 1) placed in one of the channels, an FBG sensor (Probe 2), placed in the second channel, was used for temperature monitoring aiming the self-compensation.
A super luminescent diode (SLD, Benchtop SLD - Thorlabs, Germany) was coupled to the fiber and the LPFG transmission spectrum was measured with an optical spectrum analyzer (OSA, ANDO, model AQ 6315B) using the setup illustrated
Fig. 1. Scheme of the measurement setup including: (a) flow cell with two channels for liquids with two openings to fill and drain liquid samples and four openings to pass the fibers and (b) broadband source - BBS, optical spectrum analyzer - OSA, LPFG (Probe 1) and FBG (Probe 2) sensors and interrogation unit/OSA – Model FS2200 SA.
in Fig. 1 (b). The spectra, from 1360 to 1460 nm, were acquired manually and each spectrum is the result of two averaged measurements with a resolution of 0.1 nm, taking ∼30 s to be recorded. Five consecutive measurements were performed while the sample was flowing through the cell.
The measurements were carried out by introducing each one of the ethanol-gasoline samples into the flow cell, in increasing order of ethanol concentration, and performing five consecu-tive measurements of the LPFG transmission spectrum. After each measurement, the flow cell was flushed with ethanol (Merk Millipore, Germany) and dried with filtered air to avoid contamination to the next sample. Then the spectrum of the sensor was monitored to ensure that the resonance dip has returned to its original spectral position.
The spectra of the FBG were measured using a com-puter controlled unit specifically designed to interrogate FBGs (BraggMeter FS2200 SA, HBM FiberSensing, Porto, Portugal), with a resolution of 1 pm from 1500 to 1600 nm. The FBG was written in hydrogen loaded standard single-mode telecommunication fiber (SMF28, Corning Inc.) using the phase mask technique with specific characteristics to have a wavelength peak position at 1539.91 nm at room temperature. Prior to the characterization of the ethanol-gasoline samples using the Cu2O:LPFG sensor, their RI was measured at room temperature (20±1°C) using an Abbe refractometer (A. Kruss, Optronic, Germany) with a resolution of 0.00025 at 589.3 nm. D. Gas Chromatography-Mass Spectrometry and Gas Chromatography-Thermal Conductivity
Detection Analysis
Analysis of fuel or other volatile samples might present itself as an intricate issue, even more when residue or debris analysis are present [25], [26]. In the present study, to collect the maximum data possible, two chromatographical techniques were used. A GC-MS equipment was a choice for unequivocal identification of the chemical profile as its usefulness has been previously demonstrated [27]–[31] whereas a universal detector, a GC-TCD, was used for quantification of ethanol in ethanol-gasoline samples.
Chromatographic analysis of pure 95 RON gasoline was carried out by GC-MS using a Thermo Scientific™
TRACE™1300 Gas Chromatograph coupled to a ISQ™ Series Single Quadrupole ms (Thermo Fisher Scientific Inc., USA). Analyte separation was performed with a Thermo Scientific TG-5 MS column (60 m × 0.25 mm × 0.25 μm). The oven temperature program was as follows: initial temperature of 40°C held for 5 minutes, increasing to 100°C at a rate of 5.00°C/min and held for 1 minute, followed by an increase to 280°C at a rate of 10.00°C/min and held for 5 minutes. Samples were prepared prior to analysis using n-Hexane (Merck) in 1.0% (v/v) concentration, except when noted, and the volume injected was 1.0 μL using an auto sampler. The injector was set to split mode (1:200), operating at 250°C and 165 kPa. The mass spectrometer transfer line and ion source temperatures were set to 280°C and 250°C, respectively, with the last operating under electron impact mode (70 eV, mass scan range 30-400 amu).
Analysis of samples with different ethanol concentrations was performed on a GC-TCD Shimadzu™GC-2010 Plus (Shimadzu Corporation, Japan), without dilution. Separation of analytes was performed with a Zebron ZB-5 column (30 m× 0.25 mm×0.25 μm) using a similar oven temperature program and injection/injector parameters except for carrier gas flow which was set to 82.5 kPa. The detector temperature and current was programmed to 300 °C and 75 mA, respectively, with a make-up flow of 5.0 mL/min. All analytical separations were performed using helium 99.999% as carrier gas.
Identification of analytes was performed by comparison of the Kovats and Linear Retention Indices, using NIST/EPA/NIH Mass Spectral Library (2011) and by comparison of authentic standards. Quantification of ethanol on samples, as well as select hydrocarbon compounds, was performed by external standard calibration curve procedure. Calibration curves for each compound to be quantified were obtained by injecting different concentrations. Identification of the chemical profile of the commercially available gasoline was performed using database and/or authentic standards comparison.
III. EXPERIMENTALRESULTS ANDDISCUSSION A. Chromatographic Analysis
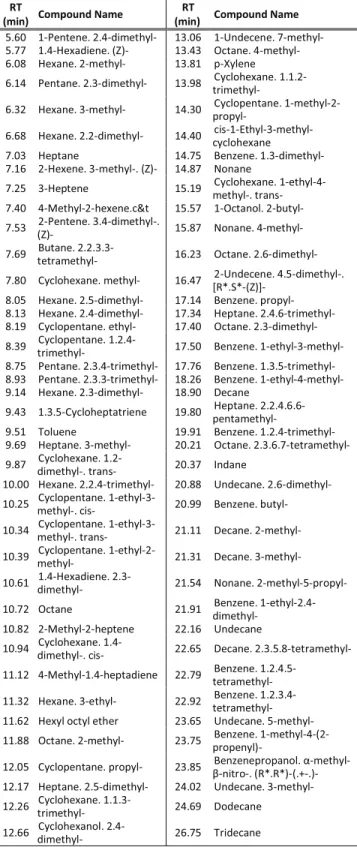
1) Gas Chromatography-Mass Spectrometry Analysis of Pure Gasoline: For identification purposes, pure gasoline was analyzed by GC-MS. Full total ion chromatogram (TIC) data was obtained and allowed 178 compounds to be iden-tified. After applying outlier limits (<0.10%; value usability ≥0.10%), 80 different compounds were considered and are referenced on Table I.
A raw data TIC of gasoline is displayed in Fig. 2 where are noticeable three different compound distribution ranges. In red, range I is mainly characterized by a high variability of low boiling point (Bp) compounds (e.g. pentane- and hexane-derived family compounds) in a wide range of concentrations. In yellow, range II has a few predominant medium Bp sig-nals (e.g. C8-C10 derivatives and aromatic hydrocarbon-based compounds) whereas range III, in green, has a high variety in higher Bp compounds but in lower concentrations (C10-C13 derivatives as well as multi-substituted benzene compounds). These three ranges emulate a carbon-based distribution
TABLE I
IDENTIFIEDCOMPOUNDS INPUREGASOLINE(OUTLIERS LIMIT<0.10%). (RT - RETENTIONTIME)
system that somehow reflects the crude oil refinement process. Of these 80 different compounds above 0.10% outlier limits, 50% are in range I, 28% are within range II and range III comprises the remaining 23%.
As a result of using sample dilution in hexane on GC-MS data acquisition, the initial chromatographic signals were
Fig. 2. Full total ion chromatogram data obtained by Gas Chromatography-Mass Spectrometry from commercial gasoline (in 1.0% (v/v) concentration with n-Hexane). Sampling areas are divided as I: t = [6 ∼ 13 min], Bp≤ 80°C; II: t = [13 ∼ 20min], 80°C < Bp ≤ 120°C; III: t = [20 ∼ 28min], 120°C< Bp ≤ 200°C. (RT - retention time).
Fig. 3. Chromatographic calibration curves with increasing concentration. Inset: chromatograms for retention time between 2 and 4 minutes, showing the ethanol signal, in both gasoline and in ethanol-gasoline samples.
disregarded, in order to prevent a high solvent fraction to reach the filament and detector. This explains the lack of certain compound signals, expected to be present in gasoline (hexane or ethanol, for example).
2) Gas Chromatography-Thermal Conductivity Detection Analysis of Ethanol-Gasoline Mixtures: In order to properly analyze the ethanol-gasoline samples, a calibration curve was performed for five select reference compounds, ethanol and C7 to C10 alkanes, illustrated on Fig. 3 up to 5.0% v/v where the insert presents detailed data for retention time between 2 and 4 minutes, corresponding to the ethanol signal, in both gasoline and in ethanol-gasoline samples.
The different reference mixtures were prepared in sub-room temperatures (T < 5°C) in order to minimize operational errors, prior to analysis. Quantification of ethanol and C7-C10 alkanes in samples, afforded the results presented on Table II.
TABLE II
QUANTIFICATIONVALUES OFETHANOL ANDC7-C10ALKANES OBTAINEDFROM THESTANDARDCALIBRATIONCURVES,
PRESENT INGASOLINESAMPLES. (RT - RETENTIONTIME)
Fig. 4. Difference between nominal ethanol concentration and measured by gas chromatography-thermal conductivity detection.
Difference between nominal and measured ethanol concen-trations is illustrated in Fig. 4 for the ethanol-gasoline samples used in the optical measurements.
B. Refractive Index Characterization
The wavelength shift normalized to the initial RI state (n=1) as a function of the SRI, from 1.300 to 1.510, was reported in [23] for the LP1,6 mode for a bare LPFG and for a LPFG coated with 30 nm of Cu2O. For RI values from 1.400 to 1.420, characteristic of the ethanol-gasoline mixtures, the bare LPFG presents average sensitivity of only ∼212 nm/RIU, while the Cu2O coated LPFG has an average sensitivity of ∼1200 nm/RIU. On the other hand, for SRI higher than the CRI the bare LPFG presents virtually no wavelength shift sen-sitivity whereas the coated LPFG presents a high sensen-sitivity. For instance, in the 1.440-1.460 RI range, characteristic of biodiesel and diesel fuels, the measured average sensitivity is about∼3185 nm/RIU.
The RI of the pure gasoline was measured and the value 1.42175 ± 0.00025 was obtained. When the ethanol concen-tration increases (whose RI is 1.36100), the RI of the mixture diminishes, as illustrated in Fig. 5, and from a linear fit to the data, a rate of 0.00062 ± 0.00001 RIU/ %v/v was determined with a correlation coefficient (R2) of 0.995. It is possible to
Fig. 5. Refractive index of the ethanol-gasoline samples for ethanol concentration from 0 to 30% v/v.
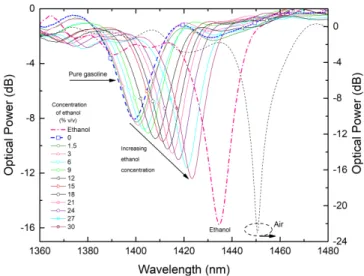
Fig. 6. Spectra of the LP1,6cladding mode of the LPFG sensor (Probe 1),
for air as external medium, pure ethanol, pure gasoline and ethanol-gasoline mixtures with ethanol concentration from 0 to 30% v/v.
infer that the concentration of ethanol in the ethanol-gasoline mixture can be monitored by measuring the RI of the solution and crossing this data with the specific spectral characteristics of the LPFG resonance band.
C. Spectral Analysis
The spectral behavior of the LP1,6band characteristic of the coated LPFG placed into the flow cell is shown in Fig. 6, for increasing ethanol concentration from 0 to 30% v/v. It is also shown the LPFG spectra taken with air and with pure ethanol as external medium. A fast Fourier transform (FFT) smoothing filter with 3 points was applied to the spectral data in order to reduce the noise effect that comes mostly from the low power optical level. As the corresponding RI decreases, the LP1,6 band exhibits a redshift and the attenuation increases.
In order to determine the wavelength and optical power at the minimum of the LPFG attenuation band, care must be taken because they are not fully symmetric. However, the
Fig. 7. Normalized wavelength shift and normalized optical power shift of the LP1,6attenuation band of the LPFG sensor (Probe 1) as a function of the ethanol concentration and of the refractive index of ethanol-gasoline mixtures for ethanol concentration up to 30% v/v and corresponding linear fitting.
lower part of the bands is with reasonable precision a symmet-ric curve. To perform the analysis the minimum optical power of the band was estimated and then considering only the points 40% above this minimum, a Gaussian function was fitted and all the parameters were extracted, such as the wavelength position and the minimum optical power. The spectral region away from the attenuation band is used as a reference to the optical power level.
The normalized wavelength shift and normalized optical power shift of the attenuation band is shown in Fig. 7 as a function of either the ethanol concentration or the resulting RI of the mixture. For ethanol concentration up to 30% v/v the sensitivity of 0.76±0.01 nm/ %v/v and 0.125±0.003 dB/ %v/v were determined.
The temperature around the flow cell was measured by a digital thermocouple (Model DVM1322, Velleman, Belgium) and found to increase 3.5°C during the measurements. In addi-tion, the temperature of the mixtures was measured at the same time inside the flow cell using one FBG (Probe 2) and a smaller increase of 1.5 C was found during the mea-surements which is corresponds to a more reliable measure-ment. Besides the good sensitivity to the SRI the LPFGs are also sensitive to temperature [32] which doesn’t happen with the well-known FBGs which are RI insensitive. The temperature sensitivity of the LPFG attenuation band was measured between 20 and 200°C considering both modes of operation, wavelength shift and attenuation shift. From a linear fit, sensitivities of 0.11 nm/°C and of 0.008 dB/°C were calculated. Therefore, in the present set of measurements, for a temperature increase of 1.5°C, the highest expected error in the determination of the wavelength and the optical power of the LP1,6 dip is about 0.16 nm and 0.012 dB, respectively. It must be noticed that, given the knowledge of the sensor’s sensitivity, any temperature fluctuation during measurement can be compensated.
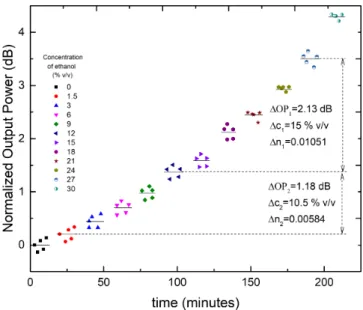
Fig. 8. Normalized wavelength shift of the LP1,6attenuation band of the dip of the LPFG sensor (Probe 1) when the surrounding medium undertakes step variations of ethanol concentration.
Fig. 9. Normalized optical power shift of the LP1,6attenuation band of the
dip of the LPFG sensor (Probe 1) when the surrounding medium undertakes step variations of ethanol concentration.
To check the stability and repeatability of the process, the same sample solutions were used to obtain several acqui-sitions, confirming the effectiveness of this sensing structure. The spectral resolution, R, can be estimated considering the values obtained from two measurement linked with two different values of the external RI, obtained from the following expression [33]:
R= (σ/SR I) = (δn/δλ) σ (1)
where the δn is the RI difference, SR I is the sensitivity to
RI variations,δλ is the difference in the wavelength resonant dip and σ is the noise induced highest standard deviation associated with the sensor output variation associated to a step variation of the external RI. Figure 8 shows data concerning
two of these steps (δn1= 0.00523, δn1= 0.01200), from which a spectral resolution better than 0.21%v/v (or 1.3×10⁻⁴) was calculated.
The same procedure can be a applied to Fig. 9. The resolution of the optical power shift mode is:
R= (σ/SR I) = (δn/δP) σ (2)
where δP is the difference in the output power. From the two steps, shown in Fig. 9, a resolution of 0.73%v/v (or 5.1×10⁻⁴ RIU) was estimated.
IV. CONCLUSIONS
Optical fiber sensors based on FBGs and LPGFs already demonstrated their applicability to harsh environments. In sys-tem where volatile organic compounds are likely to give rise to explosive atmospheres, optical fiber sensors can play an important role.
Liquid hydrocarbon products, in general, and bio-gasoline, in particular must be monitored using adequate sensors. In was reported an optical sensing scheme based on a combination of an FBG with an LPFG coated with cuprous oxide (Cu2O) for monitoring the ethanol concentration in ethanol-gasoline mix-tures. A linear relation between the ethanol concentration and the wavelength shift and optical power shift was established, for concentration up to 30%v/v. In this range of concentration, the sensitivities are 0.76 nm/ %v/v and 0.125 dB/ %v/v, for the wavelength and for the optical power mode of operation, respectively. The limits of detection of 1.63 and 2.1%v/v can be reduced by proper design of the experiment.
Complex and expensive technique analysis such as gas chromatography were also used to validate the optical results. It was important to perform the chemical analysis and the quantification of the concentration of ethanol in the same samples to confirm the veracity of the optical results.
It was verified that the optical characterization allows to estimate the concentration of ethanol in ethanol-gasoline sam-ples avoiding the expensive techniques used to obtain the chemical constitution of the samples. Moreover, this optical setup gives the possibility of real-time measurement in flow configurations, which is not possible with the sampling based techniques.
The commercial 95 RON gasoline and its mixtures with different concentrations of ethanol are here analyzed by gas chromatography providing the identification of the chemical profile of the gasoline and quantification of the ethanol con-centration in samples, aiming to support the results obtained with the optical setup.
ACKNOWLEDGMENT
The authors would like to acknowledge the support given by the Chemistry Department of the Faculty of Sciences of University of Porto and Instituto Politécnico de Viana do Castelo.
REFERENCES
[1] L. M. Rodríguez-Antón, M. Hernández-Campos, and F. Sanz-Pérez, “Experimental determination of some physical properties of gasoline, ethanol and ETBE blends,” Fuel, vol. 112, pp. 178–184, Oct. 2013.
[2] G. Mendes and P. J. S. Barbeira, “Detection and quantification of adul-terants in gasoline using distillation curves and multivariate methods,”
Fuel, vol. 112, pp. 163–171, Oct. 2013.
[3] S. Corsetti, F. M. Zehentbauer, D. McGloin, and J. Kiefer, “Charac-terization of gasoline/ethanol blends by infrared and excess infrared spectroscopy,” Fuel, vol. 141, pp. 136–142, Feb. 2015.
[4] O. M. D. Lutz, G. K. Bonn, B. M. Rode, and C. W. Huck, “Reproducible quantification of ethanol in gasoline via a customized mobile near-infrared spectrometer,” Anal. Chim. Acta, vol. 826, pp. 61–68, May 2014. [5] W. F. de C. Rocha, M. M. Schantz, D. A. Sheen, P. M. Chu, and K. A. Lippa, “Unsupervised classification of petroleum Certified Reference Materials and other fuels by chemometric analysis of gas chromatography-mass spectrometry data,” Fuel, vol. 197, pp. 248–258, Jun. 2017.
[6] M. R. Monteiro et al., “Study of brazilian gasoline quality using hydrogen nuclear magnetic resonance (1H NMR) Spectroscopy and Chemometrics,” Energy Fuels, vol. 23, no. 1, pp. 272–279, Jan. 2009. [7] J. M. de Paulo, G. Mendes, J. E. M. Barros, and P. J. S. Barbeira,
“A study of adulteration in gasoline samples using flame emission spectroscopy and chemometrics tools,” Analyst, vol. 137, no. 24, pp. 5919–5924, 2012, doi:10.1039/C2AN35441A.
[8] G. Rego, “A review of refractometric sensors based on long period fibre gratings,” Sci. World J., vol. 2013, Dec. 2013, Art. no. 913418. [Online]. Available: http://dx.doi.org/10.1155/2013/913418
[9] M.-J. Yin, B. Huang, S. Gao, A. P. Zhang, and X. Ye, “Optical fiber LPG biosensor integrated microfluidic chip for ultrasensitive glucose detection,” Biomed. Opt. Exp., vol. 7, no. 5, pp. 2067–2077, May 2016. [10] L. Coelho, D. Viegas, J. Santos, and J. M. M. M. de Almeida, “Zinc oxide coated optical fiber long period gratings for sensing of volatile organic compounds,” Proc. Opt. Sens. Detection IV, vol. 9899, pp. 989918-1–989918-11, Apr. 2016, doi:10.1117/12.2219630. [11] L. Coelho et al., “Aptamer-based fiber sensor for thrombin detection,”
J. Biomed. Opt., vol. 21, no. 8, p. 087005, 2016.
[12] Y. Wang et al., “Long period gratings in air-core photonic bandgap fibers,” Opt. Exp., vol. 16, no. 4, pp. 2784–2790, 2008.
[13] J. Tang et al., “Gas pressure sensor based on CO2-laser-induced
long-period fiber grating in air-core photonic bandgap fiber,” IEEE
Photon. J., vol. 7, no. 5, Oct. 2015, Art. no. 6803107.
[14] A. M. Vengsarkar, P. J. Lemaire, J. B. Judkins, V. Bhatia, T. Erdogan, and J. E. Sipe, “Long-period fiber gratings as band-rejection filters,” (in English), J. Lightw. Technol., vol. 14, no. 1, pp. 58–65, Jan. 1996. [15] S. W. James and R. P. Tatam, “Optical fibre long-period grating
sen-sors: Characteristics and application,” (in English), Meas. Sci. Technol., vol. 14, no. 5, pp. R49–R61, May 2003.
[16] S. Khaliq, S. W. James, and R. P. Tatam, “Enhanced sensitivity fibre optic long period grating temperature sensor,” (in English) Meas. Sci.
Technol., vol. 13, no. 5, pp. 792–795, 2002.
[17] H. J. Patrick, A. D. Kersey, and F. Bucholtz, “Analysis of the response of long period fiber gratings to external index of refraction,” (in English),
J. Lightw. Technol., vol. 16, no. 9, pp. 1606–1612, Sep. 1998.
[18] E. Simões, I. Abe, J. Oliveira, O. Frazão, P. Caldas, and J. Pinto, “Characterization of optical fiber long period grating refractometer with nanocoating,” (in English), Sens. Actuators B, Chem., vol. 153, no. 2, pp. 335–339, Apr. 2011.
[19] I. D. Villar, I. R. Matías, F. J. Arregui, and P. Lalanne, “Optimization of sensitivity in long period fiber gratings with overlay deposition,” (in English), Opt. Exp., vol. 13, no. 1, pp. 56–69, Jan. 2005. [20] P. Pilla, C. Trono, F. Baldini, F. Chiavaioli, M. Giordano, and A. Cusano,
“Giant sensitivity of long period gratings in transition mode near the dispersion turning point: An integrated design approach,” Opt. Lett., vol. 37, no. 19, pp. 4152–4154, Oct. 2012.
[21] N. D. Rees, S. W. James, R. P. Tatam, and G. J. Ashwell, “Optical fiber long-period gratings with Langmuir–Blodgett thin-film overlays,” (in English), Opt. Lett., vol. 27, no. 9, pp. 686–688, May 2002. [22] L. Coelho, D. Viegas, J. L. Santos, and J. M. M. M. de Almeida,
“Enhanced refractive index sensing characteristics of optical fibre long period grating coated with titanium dioxide thin films,” Sens.
Actua-tors B, Chem., vol. 202, pp. 929–934, Oct. 2014.
[23] L. Coelho, J. A. Moreira, P. B. Tavares, J. L. Santos, D. Viegas, and J. M. M. M. de Almeida, “Monitoring of oxidation phases of copper thin films using long period fiber gratings,” Sens. Actuators A, Phys., vol. 253, pp. 69–74, Jan. 2017.
[24] G. R. C. Possetti, M. Muller, and J. L. Fabris, “Refractometric optical fiber sensor for measurement of ethanol concentration in ethanol-gasoline blend,” in Proc. SBMO/IEEE MTT-S Int. Microw. Optoelectron.
[25] J. Zhang and Q. Yang, “GC/MS analysis on combustion smoke of different flammable liquids,” Proc. Eng., vol. 71, pp. 139–144, Jan. 2014. [26] A. M. Dhabbah, S. S. Al-Jaber, A. H. Al-Ghamdi, and A. Aqel, “Determination of gasoline residues on carpets by SPME–GC-MS tech-nique,” Arabian J. Sci. Eng., vol. 39, no. 9, pp. 6749–6756, Sep. 2014. [27] G. Bocchinfuso, L. Aiello, V. Ferone, A. Cinotti, and M. Bernabei, “Toxicological evaluation of gasolines by GC-MS analysis,”
Chromatographia, vol. 53, no. 1, pp. S345–S349, Jan. 2001.
[28] L. S. Moreira, L. A. d’Avila, and D. A. Azevedo, “Automotive gaso-line quality analysis by gas chromatography: Study of adulteration,”
Chromatographia, vol. 58, nos. 7–8, pp. 501–505, Oct. 2003.
[29] J.-Z. Zhang and J. Jin, “The influence of common plastics on the identification of gasoline studied by GC-MS,” Proc. Eng., vol. 71, pp. 372–376, Jan. 2014.
[30] G. Tang et al., “Organic composition of gasoline and its potential effects on air pollution in North China,” Sci. China Chem., vol. 58, no. 9, pp. 1416–1425, Sep. 2015.
[31] H. L. Birks, A. R. Cochran, T. J. Williams, and G. P. Jackson, “The surprising effect of temperature on the weathering of gasoline,” Forensic
Chem., vol. 4, pp. 32–40, Jun. 2017.
[32] A. Singh, D. Engles, A. Sharma, and M. Singh, “Temperature sensitivity of long period fiber grating in SMF-28 fiber,” Optik-Int. J. Light Electron
Opt., vol. 125, no. 1, pp. 457–460, Jan. 2014.
[33] N. Díaz-Herrera, A. González-Cano, D. Viegas, J. L. Santos, and M.-C. Navarrete, “Refractive index sensing of aqueous media based on plasmonic resonance in tapered optical fibres operating in the 1.5μm region,” Sens. Actuators B, Chem., vol. 146, no. 1, pp. 195–198, 2010.
Filipe Monteiro-Silva received the B.Sc. and M.Sc. degrees in chemistry
from the Faculty of Sciences, University of Porto, Portugal, in 2008 and 2010, respectively, where he is currently pursuing the Ph.D. degree. He was an Active Member of CIQ-UP until 2013 and REQUIMTE-LAQV from 2013 to 2014. Since 2014, he has been a Research Assistant with the Centre of Applied Photonics, INESC TEC. His current research interests revolve around organic synthesis, chemical (bio) sensors, chromatography, and photonics.
José Luís Santos received the Degree in applied physics (optics and
electronics) and the Ph.D. and Habilitation degrees from the University of Porto, in 1983, 1993, and 2008, respectively. He is currently a Full Professor with the Physics and Astronomy Department, University of Porto, and a Researcher with the INESC Porto Optoelectronics and Electronic Systems Unit. His main research interests are related with optical fiber sensing and optical fiber technology. He is a member of the OSA, SPIE, and the Planetary Society.
José Manuel Marques Martins de Almeida received the Degree in applied
physics (optics and electronics) and the Ph.D. degree from the University of Porto, Portugal, in 1987 and 1993, respectively, and the Habilitation degree from the Universidade de Trás os Montes e Alto Douro, Portugal, in 2006. Since 2000, he has been an Associate Professor with the Department of Physics, Universidade de Trás os Montes e Alto Douro.
He is currently a Senior Researcher with the Optoelectronics and Electronic Systems Unit, INESC Porto. His current research interests include optical sensors, integrated optics, spectroscopy and biophysics.
Luis Coelho received the Degree in physics engineering and the M.Sc. degree
in instrumentation and microelectronics from the University of Coimbra, Portugal, in 2005, and 2006, respectively. He is currently pursuing the Ph.D. degree in thin films technology applied to optical fiber sensors with the Centre for Applied Photonics, INESC TEC, Porto, Portugal. He was with the Physics Department, University of Coimbra, where he developed research in atomic and nuclear instrumentation being involved in the international experience Xenon Direct Dark Matter Search. His research involves the study of coating types for gases detection, in particular hydrogen, for refractometers with surface plasmon resonance and for high refractive index samples monitoring with coated long period fiber gratings.