Abstract— In this work is evaluated the performance of etched fiber Bragg gratings, assembled in different configurations to operate as a refractometric sensor, in the analysis of water-ethanol mixtures. Two fiber Bragg gratings operating close to 1300 nm and 1500 nm were wet-etched and employed in the sensor design. Four configurations for the refractometric sensor were studied, in dual-wavelength and single-dual-wavelength operation modes, and at two sample temperatures. Calibration curves were determined for the range between 0.0 and 100.0 % v/v of water in ethanol, and the sensor performance for each configuration was analyzed by comparing its sensitivity, conformity, repeatability and combined uncertainty. The best results showed that the sensor can be used to measure the ethanol-water concentration with combined uncertainty of 2.8 % v/v for the range up to 80.0 % v/v of ethanol concentration and 7.0 % v/v of uncertainty for the range above 80.0 % v/v of ethanol concentration for the single-wavelength operation mode at two temperatures.
Index Terms— Ethanol-water mixture, etched fiber Bragg grating, optical sensor.
I. INTRODUCTION
The ethanol is a substance miscible in both non-polar substances as hydrocarbons and polar
substances as water. This characteristic makes the ethanol a versatile solvent used in several industrial
sectors such as chemical, pharmaceutical, beverage and fuel. Particularly in the fuel sector, due to the
inevitable depletion of the world’s petroleum supply, there is an increasing worldwide interest in
alternative, non-petroleum-based sources of energy.
The ethanol production process is characterized by sequential procedures, and in several cases for
which water is a constituent of the final product, the water-ethanol proportion must be periodically
monitored and compared to standardized conditions to preserve the product quality. In Brazil, the
ethanol used as fuel is obtained by the fermentation of sucrose. In the production process, sulfuric
acid is employed to hydrolyze the carbohydrate and after the hydrolysis, the acid is separated from the
sugar which is fermented to obtain the ethanol [1]. A careful monitoring of water content in ethanol is
fundamental for the product commercialization as the product cost and destination are specified as a
Etched Fiber Bragg Gratings Sensors for
Water-Ethanol Mixtures: a Comparative Study
Francelli K. Coradin, Gustavo R. C. Possetti, Ricardo C. Kamikawachi, Marcia Muller, José L. Fabris*
function of its purity. The adulteration of ethanol fuel with water is a common malpractice that results
in a reduction of engine’s efficiency and in a higher consumption of fuel. Laboratorial analysis can be
employed to access the ethanol fuel quality, although this procedure demands a long time in order to
achieve an accurate result. The development of monitoring systems able to supply fast and reliable
results assumes great importance in quality control, also reducing the possibility of human errors in
the process.
The sensing of ethanol-water mixtures presents deviations from a linear behavior, and the existence
of anomalous physical-chemical properties makes difficult its refractometric analysis. When ethanol
is mixed to water, the entropy of the system increases differently from that expected for an ideal
solution of randomly mixed molecules. This effect was attributed to hydrophobic solute association in
aqueous solution of ethanol and to hydrogen bonding clusters formation [2]. As a consequence, the
refractive index of the ethanol-water mixture shows a non-linear dependence with the ethanol
concentration, consisting of a single-valued function. As the ethanol concentration increases beyond a
critical value, the refractive index relation becomes a two-valued function, presenting an ambiguous
region for the determination of the ethanol proportion in the mixture.
Despite that, along the last years, some works have shown studies related to the analyses of ethanol
mixtures. The hydrophobic interactions in ethanol-water mixtures were investigated with ultrasonic
detection [3]. Fiber optic evanescent-wave field also was used as a concentration sensor to analyze
aqueous primary alcohol mixtures, such as ethanol [4]. Long period gratings (LPG) have also
demonstrated high sensitivity to the refractive index of surrounding medium [5]-[6]-[7] and were
applied as refractometric transducers to determine the ethanol concentration in water solution [8]. The
sensitivity of an etched fiber Bragg grating (FBG) to the surrounding refractive index was also
employed as an ethanol solution concentration sensor [9], but in a limited range of concentrations.
In this work is discussed the applicability of a refractometric sensor based on etched FBGs in the
determination of water concentration in ethanol-water mixture for the range between 0.0 and
100.0 % v/v of water in ethanol. Four different sensor configurations are studied and their
metrological characteristics are presented and compared. For mixture proportions around the critical
value that makes the refractive index relation a two-valued function, an approach to solve the
ambiguity is proposed.
II. EXPERIMENT AND DISCUSSION
A. FBG Fabrication
Two FBGs were written in standard optical fiber with (125.0 ± 0.7) m of cladding diameter by the
technique based on the direct illumination of a phase mask [10]. Two different phase masks (Ibsen)
were illuminated with the UV light of a KrF excimer laser at 248 nm (Xantos XS, Coherent) working
with 1.03 mJ/cm2 per pulse and frequency of 50 Hz for 10 minutes. The fiber Bragg grating named
23 dB and was written using the phase mask with pitch of 902.5 nm. A second FBG, named FBG1500
with spectral parameters of λc1500 = 1539.87 nm and R1500 = 22 dB, was written by using a phase mask
with pitch of 1062.5 nm.
B. FBG Etching
FBGs have been extensively used as temperature and strain transducers, with typical sensitivities of
13.7 pm/ºC and 12.0 pm/µε, respectively [11]. However, FBGs are intrinsically insensitive to
surrounding medium refractive index once the light coupling takes place only between well-bound
core modes, which are shielded from the influence of the surrounding medium refractive index by the
fiber cladding. To make the FBG sensitive to changes in the surrounding refractive index, the
cladding radius around the grating region must be reduced, allowing the effective refractive index of
the fiber core to be significantly affected by the refractive index of external medium [12].
The change in the Bragg wavelength δλB associated with the chemical etching is given by [13]:
) (
2 p0 n
B = Λη ∆
λ
δ (1)
where Λ is the grating period, ηpo is the fraction of the total power of the unperturbed mode that flows
in the etched region and n is the difference between the cladding and the surrounding refractive indexes.
The FBG1300 and FBG1500 were individually chemically etched into an aqueous solution of
hydrofluoric acid (HF 40 %), and during the etching the gratings spectra were monitored in real time.
This procedure allows interrupting the etching when the induced changes in the gratings result in
adequate refractive index sensitivity, however without compromising the fiber integrity. For both
FBGs, the wavelength shifts relative to the initial Bragg wavelength measured during the chemical
etching are shown in Fig. 1.
0 10 20 30 40 50
-4 -3 -2 -1 0 1
FBG1300 FBG1500
δ
λ
(
n
m
)
ETCHING TIME (minutes)
Fig. 1. Wavelength shifts measured during the chemical etching.
The experimental data of Fig. 1 show that δλ increases during the first 40 minutes. This effect could
be attributed to whether an increasing in the strain state along the weak region due to a not perfect
characteristics.
After approximately 43 min immersed in the acid solution, the Bragg wavelength shows an abrupt
blue shift as consequence of the decrease in the effective refractive index caused by the cladding
radius reduction [13]. This feature is an indication that the fiber diameter approaches the fiber core
diameter and, if the chemical etching is not interrupted, the FBG and the fiber can be destroyed. To
stop the etching, the fiber was removed from the acid and neutralized by immersing the etched fiber
segment into the NaOH solution (2 mol/L).
After an etching time of 43 minutes the FBG1500 refractive index sensitivity (RIS) was assessed by
immersing it into two different samples: water and ethanol at room temperature. A wavelength shift of
0.08 nm between the responses in water and ethanol was measured. The FBG1300 was chemically
etched in two steps. Initially, the FBG1300 remained into the HF solution until the wavelength shift
reached the same value previously obtained during the etching of FBG1500 (δλ = − 1.38 nm).
However, when in contact with the same two samples (water and ethanol at room temperature) used
for FBG1500 RIS characterization, the relative wavelength shift resulted to be just 0.03 nm. In order
to obtain a higher wavelength shift (and consequently a higher RIS), the FBG1300 was re-immersed
in the acid solution for more 2 minutes, performing the total etching time of 47 minutes. After that,
FBG1300 showed a relative wavelength shift of 0.25 nm when in contact with the water and ethanol
samples. The better refractive index sensitivity of the device would be achieved by reducing the
diameter of the optical fiber to a minimum value [15], but this would make the fiber mechanically
fragile, compromising the handling of the device.
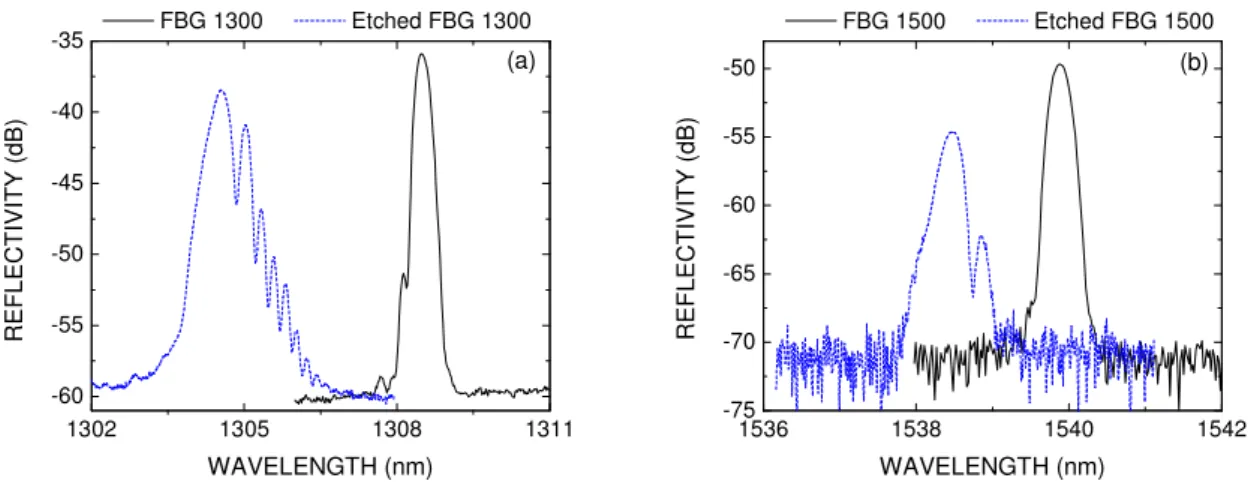
The gratings central wavelengths in air and reflectivities after the chemical etching were:
λc1300 = 1304.59 nm and λc1500 = 1538.46 nm; R1300 = 20.85 dB and R1500 = 17.20 dB. Fig. 2 shows the
FBG1300 (Fig. 2.a) and of the FBG1500 (Fig. 2.b) reflection spectra obtained before (solid line) and
after (dashed line) the etching.
1302 1305 1308 1311
-60 -55 -50 -45 -40 -35
R
E
F
L
E
C
T
IV
IT
Y
(
d
B
)
WAVELENGTH (nm)
FBG 1300 Etched FBG 1300
(a)
1536 1538 1540 1542
-75 -70 -65 -60 -55
-50 (b)
R
E
F
L
E
C
T
IV
IT
Y
(
d
B
)
WAVELENGTH (nm)
FBG 1500 Etched FBG 1500
Fig. 2. FBGs reflection spectra before (solid line) and after (dashed line) the chemical etching for: (a) FBG1300, and (b) FBG1500.
With an optical microscope (XS2-N107CCD, lens 10x) the diameter of the fiber before and after
diameter before the etching is approximately 125 m and after 43 minutes immersed in the acid
solution the diameter is approximately 63 m. Finally, after 47 minutes of etching the fiber diameter
was reduced to approximately 57 m relating to a chemical etching rate of approximately
1.44 m/min.
Fig. 3. Scanning optical microscope images of the (a) fiber without chemical etching; (b) fiber in acid for 43 minutes and (c) fiber in acid for 47 minutes.
C. Preliminary FBGs Characterizations
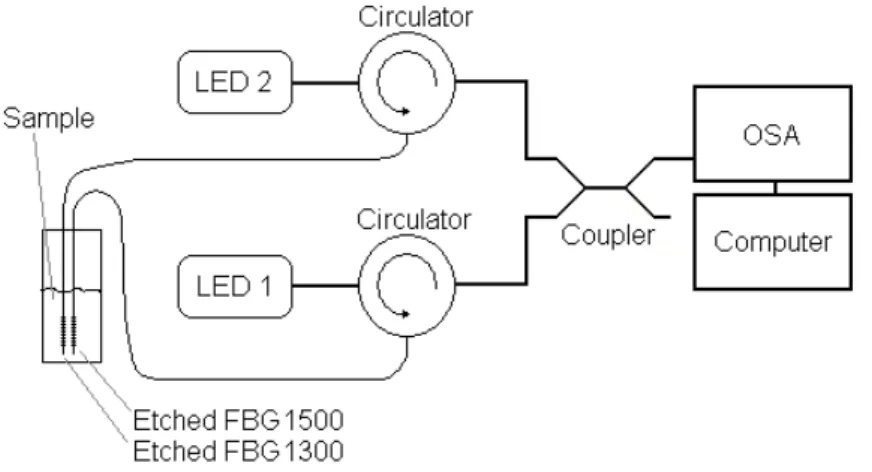
The set-up used to the etched FBGs characterization consists of an Optical Spectrum
Analyzer-OSA (Anritsu, MS9710B, ± 5 pm of wavelength stability) and two LEDs as light sources (LED1 -
Superlum, Pilot 2, central wavelength at 1544.2 nm with spectral bandwidth of 58.8 nm and LED2 -
Superlum, BroadLighter S-1300-G-I-20 SM, central wavelength at 1290.0 nm with spectral
bandwidth of 48.0 nm) as shown in the Fig. 4. The light emitted by the LEDs is coupled to the etched
FBGs, which are immersed into each sample and the reflection spectra were measured at
(25.0 ± 0.5) °C with the OSA. Each measurement was performed five times and the final result was
calculated by averaging the data.
Fig. 4. Schematic of set-up used to characterize the etched FBGs.
The refractive index of each sample, obtained by the mixture of water and glycerin in different
proportions, was measured three times at (25.0 ± 0.5) °C with an Abbe refractometer (Atago, DR−A1)
with resolution of 0.0001 refractive index units (RIU), operating at 589.3 nm. The dispersion
associated with the measurements was estimated for a confidence level of 68.3 % by the combined
uncertainty [16]. The combined uncertainty was calculated considering the experimental standard
deviation of the mean, as well as the equipments (refractometer and OSA) residual systematic
uncertainties, assumed to be described by rectangular probability distributions. Fig. 5 shows the FBGs
wavelength shifts measured relatively to the response in pure water. Error bars associated with the
of refractive indexes typically associated with ethanol-water mixtures. For this range, the etched
FBGs sensitivities are (6.5 ± 0.2) nm/RIU and (2.9 ± 0.2) nm/RIU for the FBG1300 and FBG1500,
respectively.
1.34 1.36 1.38 1.40 1.42 1.44 1.46
0 1 2 3 4
1.34 1.35 1.36 1.37 0.0
0.1 0.2
Etched FBG1300 Etched FBG1500
δ
λ
(n
m
)
REFRACTIVE INDEX
Fig. 5. Wavelength shifts as function of the sample refractive index for both etched FBGs. The inset shows the refractive index range typically associated with ethanol-water mixtures.
D. Measurement of Ethanol Concentration in Water-Ethanol Mixtures
The experiments were performed by immersing both etched FBGs in samples with ethanol
concentrations between 0.0 % v/v (pure water) and 100.0 % v/v (pure ethanol) and at two different
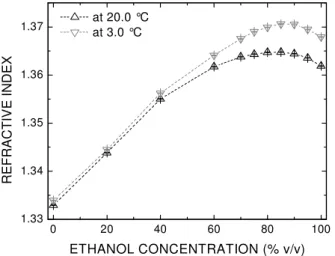
temperatures: (20.0 ± 0.5) °C and (3.0 ± 0.5) °C. The samples’ refractive indexes were measured with
an Abbe refractometer operating at 589.3 nm for both temperatures and are shown in Fig. 6, where the
lines between points are used as a visual guide.
0 20 40 60 80 100
1.33 1.34 1.35 1.36 1.37
R
E
F
R
A
C
T
IV
E
I
N
D
E
X
ETHANOL CONCENTRATION (% v/v) at 20.0 °C
at 3.0 °C
Fig. 6. Refractive index measured with an Abbe refractometer as a function of ethanol concentration in water-ethanol mixtures at 20.0 °C and at 3.0 °C.
The refractive index shows a non-linear dependence with the ethanol concentration in the samples,
as described in the literature [7]. The sample’s refractive index increases when the ethanol
concentration above this critical value, the refractive index decreases, and consequently, there is an
ambiguity in the correlation between refractive index and ethanol concentration in the mixture. This
critical value occurs for a well defined refractive index value, being therefore related to both the
ethanol-water proportion in the sample and to the sample temperature. When the temperature
decreases, the refractive index increases due to the negative thermo-optic coefficient of the sample
(the thermo-optic coefficient of water is -8x10⁻⁵ ºC-1, while for the ethanol is -4x10⁻⁴ °C-1 [17]). As a
consequence, the curves of Fig. 6 reach maximum values for different sample concentrations.
Fig. 7 shows the wavelength shifts (relative to the Bragg wavelength measured when the grating is
immersed in pure water) measured with both etched FBGs at 20.0 ºC and 3.0 ºC as the ethanol
concentration changes. Each experimental data was obtained from the analysis of a set of four
independent measurements and the dashed lines connecting the data points result from polynomial
curve fitting. The errors associated with the experimental data points were computed by the combined
uncertainty estimated for a confidence level of 68.3 % [16].
0 20 40 60 80 100
0.0 0.1 0.2 0.3 δ λ ( n m )
ETHANOL CONCENTRATION (% v/v)
Etched FBG1300_20.0 °C Etched FBG1500_20.0 °C Etched FBG1300_3.0 °C Etched FBG1500_3.0 °C
Fig. 7. Etched FBGs wavelength shifts as a function of ethanol concentration in ethanol-water mixtures for both gratings at 20.0 ºC and 3.0 ºC (experimental points and polynomial fits).
The data were fitted with a third order polynomial function with coefficients of determination
higher than 0.99901. These calibration functions are expressed as:
3 % 7 2 % 5 % 3 5 º 0 . 20 1500 3 % 7 2 % 6 % 3 4 º 0 . 20 1300 3 % 7 2 % 5 % 3 4 º 0 . 3 1500 3 % 7 2 % 5 % 3 4 º 0 . 3 1300 10 77 . 1 10 16 . 1 10 39 . 1 10 13 . 8 10 94 . 1 10 32 . 2 10 10 . 4 10 68 . 6 10 62 . 2 10 28 . 2 10 56 . 1 10 50 . 4 10 43 . 3 10 43 . 1 10 56 . 4 10 22 . 5 E E E E E E E E E E E E C C C C − − − − − − − − − − − − − − − − × − × + × + × = × − × − × + × − = × − × + × + × = × − × + × + × = λ δ λ δ λ δ λ δ (2)
In the set of (2), δλ is the wavelength shift measured when the grating is in contact with the sample,
the subscript (1300 or 1500) indicates which grating is used in the measurement, the superscript
(3.0 ºC or 20.0 ºC) stands for the sample temperature, and E% is the ethanol concentration in the
ethanol-water mixture.
In Fig. 7, two factors contribute to the increase in the gratings sensitivities at lower temperatures
ethanol concentration): the negative sample optic coefficient and the positive fiber
thermo-optic coefficient. Considering a germanium-doped silica core fiber, the thermo-thermo-optic coefficient is
approximately 8.6x10⁻⁶ °C-1 [9]. As the temperature decreases, the combined effect of both factors
increases the ∆n value in (1), with a consequent growth in the Bragg wavelength shift.
In order to determine the metrological characteristics of each grating for both temperatures, the
overall concentration range was subdivided in lower (range A) and higher (range B) than 80.0 % v/v of ethanol concentration. Around this concentration value the response curves in Fig. 7 reach the
maxima points. Then linear curves were fitted to the experimental data for each range, the slope of
each adjusted function corresponding to the average FBG sensitivity for the considered range.
For each FBG, at both temperatures 3.0 ºC and 20.0 ºC, the conformity, repeatability and resolution (for OSA and thermometer) were calculated. The major absolute deviation presented by the experimental points relatively to the fitted polynomial is the conformity. The minimum detectable unit of measurement is the resolution and the maximum experimental standard deviation of mean is the
repeatability. The effect of temperature fluctuation (± 0.5 °C) was considered by means of the thermal sensitivity of both FBGs immersed in the different water-ethanol samples. The maximum measured
values were 7.2 pm/°C for FBG1300 and 7.7 pm/°C for FBG1500. Errors associated with each
metrological characteristic were computed by combined uncertainty, which allows estimating the
limits of dispersion associated with a measurement for a confidence level of 68.3%. To calculate the
combined uncertainty were assumed the following probability distributions: triangular for the
conformity; normal for the repeatability; and rectangular for the resolution and temperature.
All metrological characteristics were calculated in units of ethanol concentration in ethanol-water
mixture (% v/v). Each metrological characteristic was initially obtained in picometer (pm), and
subsequently was converted to ethanol concentration (% v/v) by the multiplication of its value by the
inverse of the absolute average sensitivity for each range (the presented values are standard
uncertainties). Results are presented in Table I (at 3.0 ºC) and Table II (at 20.0 ºC).
TABLE I. METROLOGICAL CHARACTERISTICS OF THE ETCHED FBGS AT 3.0 °C FOR EACH RANGE (A OR B)
Characteristics A_FBG1300
3.0°C
A_FBG1500 3.0°C
B_FBG1300 3.0°C
B_FBG1500 3.0°C
Average Sensitivity**
3.6 1.8 -1.3 -0.8
Conformity* 0.1 0.9 0.7 1.2
Repeatability* 1.4 2.1 2.6 4.5
Resolution (OSA)* 0.8 1.6 2.2 3.6
Resolution (Temperature)*
0.6 1.3 1.6 2.8
Combined Uncertainty* 1.7 3.1 3.8 6.5
*
TABLE II. METROLOGICAL CHARACTERISTICS OF THE ETCHED FBGS AT 20.0 °C FOR EACH RANGE (A OR B)
Characteristics A_FBG1300
20.0°C
A_FBG1500 20.0°C
B_FBG1300 20.0°C
B_FBG1500 20.0°C
Average Sensitivity** 2.7 1.2 -0.9 -0.8
Conformity* 0.7 0.3 0.9 0.8
Repeatability* 1.6 3.3 4.5 4.2
Resolution (OSA)*
1.1 2.4 3.1 3.5
Resolution (Temperature)* 0.8 1.8 2.2 2.7
Combined Uncertainty* 2.2 4.5 5.9 6.1
*
All units are expressed in (% v/v) with exception ** (pm/% v/v)
Despite of the performance presented by each grating to determinate the ethanol concentration in
ranges A and B, only one etched FBG is unable to sort the ambiguity out in the correlation between refractive index and ethanol concentration in the mixture.
In the approach proposed to resolve this ambiguity problem the FBGs response curves were
combined in pairs, providing four different data sets: for the same temperature and at two wavelengths
(FBG1300 and FBG1500 at 3.0 ºC, FBG1300 and FBG1500 at 20.0 ºC), or at the same wavelength in
different temperatures (FBG1300 at 3.0 ºC and 20.0 ºC, FBG1500 at 3.0 ºC and 20.0 ºC). Each data
set establishes a different sensor configuration. The combined uncertainties associated with these
configurations are shown in Table III to ranges A and B.
TABLE III. COMBINED UNCERTAINTY FOR THE COMBINED FBG CONFIGURATIONS
System Combined Uncertainty of the System (% v/v) Sensor Temperature (ºC) Range A Range B
FBG1300 and FBG1500 3.0 3.5 7.6
FBG1300 and FBG1500 20.0 5.0 8.5
FBG1300 3.0 and 20.0 2.8 7.0
FBG1500 3.0 and 20.0 5.4 9.0
The combined uncertainty of the sensor configuration composed by both gratings, FBG1300 and
FBG1500, which operates at 3.0 ºC is 3.5 % v/v for range A and 7.6 % v/v for range B. These uncertainties are smaller when compared to the sensor configuration that operates at 20.0 ºC, whose
uncertainties are 5.0 % v/v for range A and 8.5 % v/v for the range B. However, the combined uncertainties obtained for the sensor configuration based on etched FBG1300 response at both
temperatures, 3.0 ºC and 20.0 ºC, were 2.8 % v/v for range A and 7.0 % v/v for range B. The uncertainties in this case are smaller not only when compared with the sensor configuration based on
etched FBG1500 response at two temperatures (5.4 % v/v for range A and 9.0 % v/v for the range B), but also when compared with the configurations that use two sensors in the same temperature.
The best performance of the sensor configuration based on the etched FBG1300 relies on its higher
refractive index sensitivity when compared to the etched FBG1500 sensitivity. At lower temperatures
the refractive index of the substances is larger than in high temperature [13], [17] and consequently it
E. Validation of the Method proposed to the Determination of the Ethanol Concentration
For one specific sensor configuration, the ethanol concentration for an unknown water-ethanol
sample can be determined by measuring the Bragg wavelength shift and finding the adequate roots of
the equation system obtained from the set of calibration curves given by (2). Each calibration curve
presents three different roots, and the correct concentration is determined by the real root value (or its
modulus in case of a complex root) between 0.0 % v/v and 100.0 % v/v that best matches (with the
smaller difference) for the two calibrations curves associated with the sensor configuration, resulting
in an average concentration E%. A root close to the upper or lower limit only is disregarded if its value
is respectively, bigger than 100.0% plus the combined uncertainty or smaller than 0.0% minus the
combined uncertainty. Each sensor configuration was individually experimented to verify the validity
of the proposed method, and to compare the performance of each sensor.
For etched FBG1300 and FBG1500 at 20.0 ºC, were calculated the calibration curves roots by
attributing for both δλ20ºCin (2) the values of the correspondent experimental points shown in Fig. 7.
The polynomial roots found for each calibration curve are shown in Table IV. The value of ethanol
concentration obtained after the combination between the roots (E%) and its respective combined
uncertainty (uE%) can be compared with the actual ethanol concentration (E% actual). TABLE IV. POLYNOMIAL ROOTS CALCULATED WITH (2) FOR BOTH FBGS AT 20.0°C
E% actual*
FBG1300 at 20.0 °C FBG1500 at 20.0 °C
E%* uE%*
Roots* Roots*
1 2 3 1 2 3
0.0 -151.4 0.2 139.3 -61.7 -0.1 127.5 0.1 5.0 20.0 -159.4 18.8 128.7 -73.7 20.2 119.3 19.5 5.0 40.0 -166.5 40.7 113.8 -82.2 39.5 108.5 40.1 5.0 60.0 -170.5 60.9 97.7 -88.0 60.9 92.9 60.9 5.0 70.0 -171.5 70.2 89.3 -89.0 67.7 87.1 88.2 5.0 75.0 -171.6 71.2 88.4 -89.3 71.5 83.6 71.4 5.0 80.0 -171.7 73.4 86.3 -89.3 71.5 83.5 72.5 5.0 85.0 -171.8 75.9 84.0 -89.3 71.5 83.6 83.8 8.5 90.0 -171.5 70.5 89.0 -88.8 66.2 88.3 88.7 8.5 95.0 -170.7 62.5 96.3 -87.1 56.6 96.3 96.3 8.5 100.0 -170.2 59.0 99.3 -85.9 51.5 100.2 99.7 8.5
All the units are expressed in % v/v.
In Table IV, gray cells depict values to be disregarded as they do not fulfill the requirements of the
method. The upper and lower thresholds that establish the confidence range are assumed to be the
combined uncertainty of the sensor configuration, previously calculated in Table II.
Even though, for this sensor system configuration, two calculated values resulted out of range (red
cells) when compared with the target values (70.0 % v/v, and 80.0 % v/v). The largest errors of this
sensor configuration occur when the experimental points are distant from the calibration curves.
Taking this observation into account, it was determined the maximum deviation (for more or for less)
that the experimental points can present from the calibration curve. These values are about 0.6 pm and
A similar validation method was employed for the sensor configuration based on etched FBG1300
and FBG1500 at 3.0 ºC. The results are shown in Table V. Again here, the gray cells must be
disregarded, and confidence range is established from data in Table I.
TABLE V. POLYNOMIAL ROOTS CALCULATED WITH (2) FOR BOTH FBGS AT 3.0°C
E% actual*
FBG1300 at 3.0 °C FBG1500 at 3.0 °C
E%* uE%*
Roots* Roots*
1 2 3 1 2 3
0.0 -96.3 -0.1 138.2 -44.9 -0.3 132.4 -0.2 3.5 20.0 -107.0 20.3 128.5 -58.6 20.5 125.2 20.4 3.5 40.0 -114.7 39.7 116.7 -68.2 40.1 115.2 39.9 3.5 60.0 -119.9 59.6 102.1 -73.9 57.3 103.9 58.5 3.5 70.0 -121.4 69.3 93.8 -76.4 69.5 94.2 69.4 3.5 75.0 -121.9 75.3 88.4 -77.1 75.3 89.0 75.3 3.5 80.0 -121.1 81.1 82.8 -77.5 82.5 82.5 82.7 3.5 85.0 -122.1 79.0 84.8 -77.3 78.0 86.5 78.5 7.6 90.0 -121.9 75.1 88.6 -77.3 78.6 86.0 87.3 7.6 95.0 -121.4 69.2 93.9 -76.2 67.7 95.7 68.5 7.6 100.0 -120.2 61.2 100.8 -74.9 61.1 101.0 61.2 7.6
All the units are expressed in % v/v.
The green cells correspond to modulus of complex roots. Again here, for this sensor configuration,
two calculated values resulted out of range (red cells) when compared with the target values (95.0 %
v/v and 100.0 % v/v).
The above described drawbacks of the method are removed by using a sensor configuration based
on only one FBG at two different temperatures. The Table VI exhibits the calculated concentrations
E%and the respective combined uncertainties, for the two sensor configurations that employ only one
etched FBG at two temperatures, 3.0 ºC and 20.0 ºC.
TABLE VI. POLYNOMIAL ROOTS CALCULATED WITH (2) FOR EACH FBG AT BOTH TEMPERATURES
E% actual*
FBG1500 at 3.0°C and 20.0°C
FBG1300 at 3.0°C and 20.0°C
E%* uE%* E%* uE%*
0.0 -0.2 5.4 0.0 2.8
20.0 20.3 5.4 19.5 2.8
40.0 39.8 5.4 40.3 2.8
60.0 59.1 5.4 60.6 2.8
70.0 68.6 5.4 70.6 2.8
75.0 73.4 5.4 72.2 2.8
80.0 83.0 5.4 83.6 2.8
85.0 85.0 9.0 82.8 7.0
90.0 87.1 9.0 88.2 7.0
95.0 96.0 9.0 95.0 7.0
100.0 100.6 9.0 100.1 7.0
*
All the units are expressed in (% v/v).
For both gratings, all ethanol concentration obtained match the actual ethanol concentration, within
the confidence range established by the combined uncertainty. Nevertheless, the etched FBG1300
FBG1500. This behavior is a result of the higher sensitivity of FBG1300 to the external refractive
index, as previously showed in Table I and Table II.
III. CONCLUSIONS
An in-fiber effective refractive index sensor able to solve the ambiguity in the correlation between
refractive index and ethanol proportion in ethanol-water mixtures is demonstrated. The sensor is
based on the external medium refractive index sensitivity of etched FBGs, and its performance must
be evaluated for each application. For the sensor design, the most important features to be considered
are its high sensitivity dependence on the surroundings refractive index, and the possibility of
adjusting this sensitivity by controlling the extent of cladding etching. In the specific case of
water-ethanol mixture analysis, the two employed etched FBGs operating at different wavelengths
(FBG1300 and FBG1500), showed sensitivities of (6.5 ± 0.2) nm/RIU and (2.9 ± 0.2) nm/RIU at
(25.0 ± 0.5) °C, respectively. To solve the well-known problem of refractive index ambiguity around
the critical value of 80.0 % v/v of ethanol concentration, four different sensor configurations were
proposed and tested. For the two-wavelength coded configurations, operation at lower temperatures
(3.0 °C) resulted in better metrological characteristics for the sensor than operation at higher
temperatures (20.0 °C), in spite of the validation process returned wrong concentrations for
approximately 18 % of the studied samples. These limitations are removed when a single-wavelength
coded configuration is employed at two different temperatures. In this configuration, FBG1300
resulted in better metrological characteristics for the sensor than FBG1500, due to the higher
sensitivity of the former. The obtained combined uncertainties in the determination of ethanol
concentration for the sensor configuration based on the etched FBG1300 at two temperatures were
2.8 % v/v below the critical value of 80.0 % v/v of ethanol concentration and 7.0 % v/v above the
critical value.
The final performance of the sensor can be still improved by adding some facilities to the set-up.
Uncertainties can be further reduced by employing reading equipment with better resolution and
wavelength stability, as well as by adding an automated system to increase the number of acquired
data points both in the calibration and measurement stages. Moreover, etching the gratings up to a
more reduced cladding diameter produces an increase in the sensor sensitivity, with a consequent
decrease in the combined uncertainty of the whole system. As the proposed method relies on
measurements carried out with samples at two different temperatures, a facility for temperature
variation must be available for real in situ measurements. A Peltier cell can comprise a suitable
module for this purpose, and the electronics employed for control can further decrease the
uncertainties associated with temperature fluctuations, contributing to the increase in the sensor
performance.
ACKNOWLEDGMENT
CAPES, FINEP, Fundação Araucária and ANP (PRH-ANP/MCT-PRH10-UTFPR).
REFERENCES
[1] J.R. Mielenz, “Ethanol production from biomass: technology and commercialization status." Current Opinion in
Microbiology, vol. 4, pp. 324-329, 2001.
[2] N. Nishi, S. Takahashi, M. Matsumoto, A. Tanaka, K. Muraya, “Hydrogen bonding cluster formation and hydrophobic solute association in aqueous solution of ethanol.” Journal of Physical Chemistry, vol. 99, pp. 462-468, 1995.
[3] A. Tuulmets, J. Järv, S. Salmar, G. Cravotto, “Ultrasonic detection of hydrophobic interactions: a quantitative approach.” Journal of Physical Organic Chemistry, vol. 21, pp. 1002-1006, 2008.
[4] M. Fabian, E. Lewis, T. Newe, S. Lochmann, “Fibre-optical evanescent-wave field fluid concentration sensor.” 6th
International Multi-Conference on Systems, Signal and Devices. 2009.
[5] V. Bhatia, “Applications of long-period gratings to single and multi-parameter sensing.” Optics Express, vol. 4, pp. 457-466, 1999.
[6] H.J. Patrick, A.D. Kersey, F. Bucholtz, K.J. Ewing, J.B. Judkins, A.M. Vengsarkar, “Chemical sensor based on long-period grating response to index of refraction.” Lasers and Electro-Optics, vol. 1, pp. 420-421, 1997.
[7] R. Falate, R.C. Kamikawachi, M. Muller, H.J. Kalinowski, J.L. Fabris, “Fiber optic sensors for hydrocarbon detection.”
Sensors and Actuators B, vol. 105, pp. 430-436, 2005.
[8] G.R.C. Possetti, L.C. Côcco, C.I. Yamamoto, L.V.R. Arruda, R. Falate, M. Muller, J.L. Fabris, “Application of a long-period fibre grating-based transducer in the fuel industry”. Measurement Science and Technology, vol. 20, 034012, 2009.
[9] U.S. Raikar, V.K. Kulkarni, A.S. Lalasangi, K. Madhav, S. Asokan, “Etched fiber Bragg grating as ethanol solution concentration sensor.” Optoelectronics and Advanced Material, vol. 1, pp. 149-151, 2007.
[10] J. Martin and F. Oullette, “Novel writing technique of long and highly reflective in-fibre gratings.” Electronic Letters, vol. 30, pp. 811-812, 1994.
[11] A. Othonos, “Fiber Bragg gratings.” Review of Scientific Instruments, vol. 68, pp. 4309-4342, 1997.
[12] A. Asseh, S. Sandgren, H. Ahlfeldt, B. Sahlgren, R. Stubbe, G. Edwall, “Fiber optical Bragg grating refractometer.”
Fiber and Integrated Optics, vol. 17, pp. 51-62, 1998.
[13] D.A. Pereira, O. Frazão, J.L. Santos, “Fiber Bragg grating sensing system for simultaneous measurement of salinity and temperature.” Optics Engineering, vol. 43, pp. 299-304, 2004.
[14] A. Iadicicco, S. Campopiano, M. Giordano, A. Cutolo, A. Cusano, “Structures fiber Bragg gratings for sensing applications.” 1st International Conference on Sensing Technology, pp. 248-254, 2005.
[15] A.N. Chryssis, S.M. Lee, S.B. Lee, S.S. Saini, M. Dagenais, “High sensitivity etched core fiber Bragg grating sensors.”
IEEE Photonics Technology Letters, vol. 6, pp. 1253-1255, 2005.
[16] JCGM/WG 1, “Evaluation of measurement data – Guide to the expression of uncertainty in measurement.” JCGM
100:2008, 2008.