FINANCE
CORPORATE SOCIAL RESPONSIBILITY AND FINANCIAL PERFORMANCE
IN GIIPS COUNTRIES: A MULTIFACTOR APPROACH
Irene Guia Arraiano
iarraiano@iscal.ipl.pt
Instituto Politécnico de Lisboa
ABSTRACT
The present study investigates the relationship between corporate social responsibility and financial
performance from a sample of all listed companies in European peripheric countries (Greece, Italy
Ireland, Portugal and Spain) often referred as “GIIPS countries”. The portfolio formation considers
the companies included in the Global Reporting Initiative (GRI) into a timeframe of more than one
decade which comprises the sovereign debt crisis. The empirical results show that investing in
companies that engage in these practices obtain a better performance when compared with
conventional portfolio. The study also applies a multifactor model and found that the returns of the
GRI portfolio can be explained by others risk factors when compared with German stock market,
which have not been spared by the Eurozone debt crisis, but less affected.
KEY WORDS: Social responsible companies, GIIPS markets, performance, risk
1. INTRODUCTION
Corporate Social Responsibility (CSR) investments have been growing worldwide in recent years, with Europe being the leader in this type of investment. CSR definitions have proliferated in the literature particularly since the 1980s, nevertheless European Union (EU) Green paper on CSR defined it as ‘a concept whereby companies integrate social and environmental concerns in their business operations and in their interaction with their stakeholders on a voluntary basis’ as they are increasingly aware that responsible behaviour leads to sustainable business success. To summarise, a CSR practising corporation should strive to obey the law, make a profit, be ethical and provide societal value and accountability.
In this context, the World Commission on Environment and Development established by the United Nations (UN) in 1987 made a great contribution in launching the report "Our Common Future", which defined the concept of sustainable development. In the development of this concept the interest of investors in the subject of CSR is growing. From this milestone it was necessary to develop a new business information model, as well as to adapt classical financial theory and introduce the factor of social responsibility, giving rise to the so-called sustainable finance. In this new concept, the social, environmental, and economic aspects are considered when making an investment.
Thus, a branch of modern financial theory is defined in which the goal is to reach the triple bottom-line: financial, social, and environmental performance (Fernández, 2010; Elkington 2010), in which the definition was famous - "Sustainable development is one that satisfies the needs of the present without compromising the ability of future generations to meet their own needs, thereby giving prominence to the social and economic level. In this way, we moved from a shareholders-oriented investment to a new orientation - the stakeholders. Due to the great importance of this matter and the relevance of this topic, there is nowadays a vast amount of information about countries applying in their companies the practices required by social responsibility, and to disclosure reports of non-financial information about their social and environmental activities, published by KPMG (2011 and 2015) and Eurosif (2014). However, this new policy entails competitive disadvantages, in which when making the investment decision, the shareholders create expectations regarding the profitability of the investment. Yet, companies that adopt socially responsible practices must simultaneously generate profit. This idea assumes that socially responsible companies suffer from competitive disadvantages in relation to companies that are not CSR, because, by bearing the costs inherent to socially responsible practices, its profitability is reduced and affects the distribution of earnings to shareholders (Waddock & Graves, 1997).
2
In this context, the present study analyses the relationship between corporate socially responsibility and financial performance from a sample of all listed companies in European peripheric countries (Greece, Italy, Ireland, Portugal and Spain) often referred as “GIIPS countries”. The portfolio formation considers the companies rating by the Global Reporting Initiative (GRI) covering 2005-2016 period which comprises the crisis period.
According to previous literature, the research investigates risk-adjusted returns of both portfolios, market and GRI and employed a methodology which applies the market model and a multifactor approach, considering the GIIPS’ market and for each market separately, comparing results. Considering the turning point in the evolution of the global financial crisis being the collapse of the Lehman Brothers on September 2008, the same metodology is also applied to the period before and after this year.
The empirical results conclude that investing in companies that engage in these practices obtain a better performance when compared with conventional portfolio. The study also applies a multifactor model and found that the returns of the GRI portfolio can be explained by others risk factors when compared with German stock market, as a benchmark.
The present research contributes to the literature on CSR. To the best of my knowledge, this study is the only one that analyses the relationship between corporate socially responsible and financial performance from a sample of all listed companies (1136) on European peripheric markets and in all industries, considering the crisis period.
The remainder of the paper is organised as follows. Section 2 reviews the theorical literature. Section 3 describes data and relevant statistics for the GIIPS’ markets. Section 4 explains the both econometric approaches and section 5 discusses the empirical results. Finally, section 6 provides the conclusions.
2. LITERATURE REVIEW
The pioneer study of portfolios formed by socially responsible companies is from Wright and Ferris (1997) for South Africa from 1986 to 1994, in which the authors selected companies taking as a measure of CSR and concluding that there is no significant relationship between the both portfolios in terms of risk-adjustment returns. Since then many other studies have been carried out primarily for the North American market and later for Europe and are summarised in Table 1. According to the authors, country, study period, the measure of social responsibility used as well as the conclusions drawn of the study in relation to the market-adjusted return on equity by comparing the performance of the socially responsible portfolios with the conventional ones. Despite the enormous interest in CSR, the extant literature concentrates mostly on the relation between CSR and financial performance (Griffin & Mahon, 1997). There are indications that companies which engage in socially responsible and sustainable practices outperformance in certain contexts (Derwall & Koedijk, 2009; Kempf & Osthoff, 2007).
However, Galema et al. (2008), applied the Carhart (1997) model and found no significant differences in risk-adjusted return. Statman and Glushkov (2009) analysed the returns of shares of Socially Responsible (SR) companies that did not trade in tobacco, alcohol, gambling, firearms, and nuclear operations in the period 1992-2007, and concluded that there is an advantage of SR investments over conventional ones. Hong and Kacperczyk (2009) obtained better results in the same market in the period between 1962 and 2006, but we must mention that in this case the authors included in the portfolio the companies that deal in alcohol, tobacco, and gambling, which have a higher return when compared with the remaining listed companies.
Still for the North American market, Derwall et al. (2011) considered companies in the period 1992-2008 to conduct an empirical analysis and concluded that SR investment should be considered in the short term, but not in the long term. They noted the great controversy between investors who practice SR investments I and those who do not, who are called "SIN". Data from two groups of companies, SRI and SIN, were used using the information published annually in the KLD database. To evaluate the performance applied the multifactorial models of Fama and French (1993) and Carhart (1997) using the two data samples.
In this line of research, but more recently, Trinks and Scholtens (2017) investigates the impact of negative screening on the investment universe as well as on financial performance for more than twenty years. The empirical results suggest that the choice for negative screening strategies does matter for the size of the investment universe as well as the risk-adjustment return performance.
The number of studies on SR investments in the European market is further reduced because of the lack of available information, contrary to the United States (US) market that use the KLD. Humprey et al. (2012) investigated the performance of SR portfolios in the United Kingdom from 2002 to 2010 formed by companies that are listed in the Dow Jones Sustainable Index (DJSI), which is published annually by Sustainable Asset Management (SAM), however the authors did not obtain significant results in terms of risk-adjusted return. In the United Kingdom, Brzeszczynski and McIntosh (2014) analysed the performance of portfolios formed by SR companies, which are listed in the Global 100 (Most Sustainable Corporations in the World), from 2000 to 2010. The study revealed that the return of the SR portfolios is on average higher when compared to the FTSE100Index or FTSEGood indices. The risk factors of the multifactorial model were estimated, and the authors conclude that the risk-adjusted return can only be explained by the market factor. Finally, the authors applied regression models to analyse the performance of SR investments portfolios with and without dividends. The results indicate that SRI portfolios perform better than market indices.
More recently, Mollet and Ziegler (2014) investigate the North American market and the European market from 1998 to 2009 by applying Carhart's multifactor model (1997). The measure of social responsibility used was the Morgan Stanley Capital International World Index (MSCI) and the social responsibility information provided by ZKB which is the largest Swiss bank. The study period was subdivided into four subperiods due to the crisis in the markets caused by the 2001 attacks in the US. The results obtained were negative for the small minus big (SMB) factor in both regions and the winners minus losers (WML) factor is negative for the three portfolios in Europe. The risk-adjusted return was not statistically significant in both markets with respect to SR investment, although this type of investment is not penalised in both the European and the US markets. The authors conclude that the size factor influences the results obtained.
For the Spanish market, Miralles-Marcelo et al. (2012) for the period from 2001 to 2010 built SR portfolios using the information published by the GRI as a reference. The authors applied a multifactorial model to analyse the market risk-adjusted return as well as the three and four risk factors as had previously been done for the North American market. The results obtained led to the conclusion that in sub-periods of economic recession, SR investments are safer because market risk is significantly lower during the recession periods compared to periods of economic expansion.
The same authors refer that the methodology usually employed for this type of studies (Kempf and Osthff, 2007; Galema et al., 2008; Hong and Kacperczyk, 2009; Statman and Glushkov, 2009), is based on considering models of attribution of performance, as proposed by Carhart (1997) and which controls four risk factors: market, size, book-to-market, and momentum. This model allows us to analyse the benefits that the investor obtains overall by including SR companies in his selection of investment portfolios. The parameters to be estimated in these models are, on the one hand, risk-adjusted return on the portfolio and, on the other hand, the portfolio exposure to the various risk factors considered. Although the models described above have been widely used or applied by the financial literature for the study of SR investments, they present a significant limitation. These models assume that the beta - risk coefficient is constant over the entire period of the analysed sample.
For the Greek market, Karagiorgos (2010) investigates 281 companies in 2007 and 2008 with GRI criteria and concluded that a Greek company which adopts CSR strategy and practices may obtain higher stock values since stakeholders (shareholders) evaluate positively these activities. This generalization happened since the companies have a wide variety on market capitalization and that they represent different kinds of industry. The methodologies used as well as the control variables that are considered in each of the works and the periods of study do not always coincide, which explains not only the heterogeneity of the results obtained, but also the difficulty found in the comparison and homogeneous conclusions.
In this field, Miralles-Marcelo et al. (2015) analyse the stock market performance, in terms of return and risk, of SR listed firms in ten European countries in a long a troubled period of time, between 2001-2013. The authors have considered the annual information provided by the GRI.
4
Table 1. Previous evidence focused on socially responsible portfolios
Authors Market Estimation period Measures of CSR Relationship
Waddock & Graves (1997) United States 1985-1995 KLD Positive
Wright & Ferris (1997) South Africa 1986-1994 RSC No significant
Derwall et al .(2005) United States 1995-2003 KLD Positive
Kempf & Osthoff (2007) United States 1992 -2004 KLD Positive
Fiori et al. (2007) Italy 2004-2006 Disclosure reports No significant
Galema et al .(2008) United States 1992-2006 KLD No significant
Hong & Kacperczyk (2009) United States 1962-2006 MSCI KLD 400 Positive
Statman & Glushkov (2009) United States 1992-2007 KLD Positive
Karagiorgos (2010) Greece 2007-2008 Index based on GRI Positive
Derwall et al .(2011) United States 1992-2008 KLD Positive
Afonso et al. (2012) Portugal 2005-2009 Websites No significant
Humphrey et al.(2012), United Kingdom 2002-2010 DJSI No significant
Miralles et al. (2012) Spain 2001-2010 GRI Positive
Ducassy (2013) France 2007-2009 CFIE Positive
Wu & Shen (2013) Worldwide 2003-2009 EIRIS Positive
Brzeszczyn´ski & McIntosh (2014) United Kingdom 2000-2010 Global 100 Positive
Mollet & Ziegler (2014) United States and Europe 1998-2009 MSCI World Positive
Trinks & Scholtens (2017) Worldwide 1991-2012 ASSET4 Positive
In the Portuguese case, only after 2005 more companies started to be listed on Euronext Lisbon stock exchange that could be analysed because from this year on companies were obliged to report their accounts according to International Standards of Accounting and International Financial Reporting Standards (IAS-IFRS standard), therefore companies could pay attention to their CSR practices. Afonso et al. (2012) considered nineteen firms listed on the PSI 20 Index during 2005 to 2009, and concluded that firms that had a better social performance are not the ones who had a better economic performance. To measure the economic and financial performance the authors used return on equity (ROE), return on assets (ROA) and return on sales (ROS) and calculated the correlation between them. They concluded that the CSR is correlated positively with ROA and negatively with ROE.
The existing researches evidenced that large companies in generally disclose more information than small companies (Perrini, 2007; Gamerschlag et al., 2011); by analysing a sample of listed German companies. In this context is important to analyse the others risk factors.
In this context, the goal of this study is to clarify the empirical results and analyse if the GRI portfolio beats the market even in crisis period.
3. DATABASE
To carry out the proposed study, it must consider two types of information: socially responsible and financial information. The both are described as follows.
3.1. MEASURE OF CSR
The Global Reporting Initiative (GRI) is an independent institution (started in 1997 by the Coalition for Environmentally Responsible Economies (CERES) and became independent in 2002) whose mission is to develop and disseminate globally applicable Sustainability Reporting Guidelines. The GRI incorporates the active participation of representatives from business, accountancy, investment, environmental, human rights, research and labour organisations from around the world, and is an official collaborating centre of the United Nations Environment Programme (UNEP). The GRI performance indicators are grouped into three sections covering the economic, environmental, and social dimensions of sustainability.
The fourth generation of Guidelines, G4 was launched in May 2013. This includes harmonization with other important global frameworks, including the Organisation for Economic Co-operation and Development (OECD) Guidelines for Multinational Enterprises, the UN Global Compact Principles, and the UN Guiding Principles on Business and Human Rights.
KPMG´s research shows that the GRI remains the most popular voluntary reporting guideline worldwide, with 60 percent of all CR reporters in the 45 countries surveyed referencing the GRI. The empirical study applies the GRI as reporting guidelines to achieve greater reliability and accuracy. Moreover, GRI guidelines have been used by a lot of researches, which indicates GRI’s great acceptance (Schadewitz and Niskala, 2010, Miralles-Marcelo et al. 2012, Albareda 2013, Miralles-Quirós et al. 2017).
As displayed Graph 1 above, we can see the increasing number of companies that are socially responsible according to the GRI criteria over 2005-2016 period. Greece, Italy, and Spain are the markets which shows the most number of companies that engage in this rating, and are leading the ratings in the GIIPS’ group. These increasing can be justified because during the period under study, the Italian government encourages business to improve environmental standards and act responsibility in this area. The government does not impose measures on sustainability but provides incentives for businesses that wish to do so. Many policies and programs implemented by national, regional, and local governments with a common objective of CSR programs, to combine stronger competitiveness with enhanced social cohesion (Perrini, 2007). At the same time, a renewed EU strategy 2011–14 for corporate social responsibility is implemented (European Commission, 2011).
The disclosure is less in Ireland than in other countries, Sweeney (2008) reports this fact and states that reporting by Irish organizations of their CSR activities is slowly increasing. The mandatory disclosure requirements in relation to reporting CSR data in Ireland are minimal.
6
Graph 1 Disclosure evolution by market according GRI
Source: Global Reporting Initiative. Own elaboration.
At the same time, there is clear a significant increase in reporting from the Portuguese market. It is interesting to note that from 2007 onwards this growth is more accentuated coinciding with the beginning of the financial crisis. This evolution is not innocent, due to the legislation published by the European Union and the individual member states which contributed for this progress. It is possible that this decline in 2015 and 2016 follows the introduction of the GRI G4 framework which would be considered more complex than the previous GRI framework (KPMG 2015).
3.2 FINANCIAL INFORMATION
This empirical study, that covers the period between January 2005 and December 2016, combines 1,136 companies listed in the GIIPS’s stock market as a whole: Greece, Italy, Ireland, Portugal, and Spain, and it includes all industries. The database used in this study, consists of the price share of all the listed companies in each stock exchanged in each considered country, taken from Thomson Reuters DataStream. The present study considers three-month Treasury Bill rate in Europe (Euribor- 3 months). After selecting the companies according to GRI criteria the market and GRI portfolios were created.
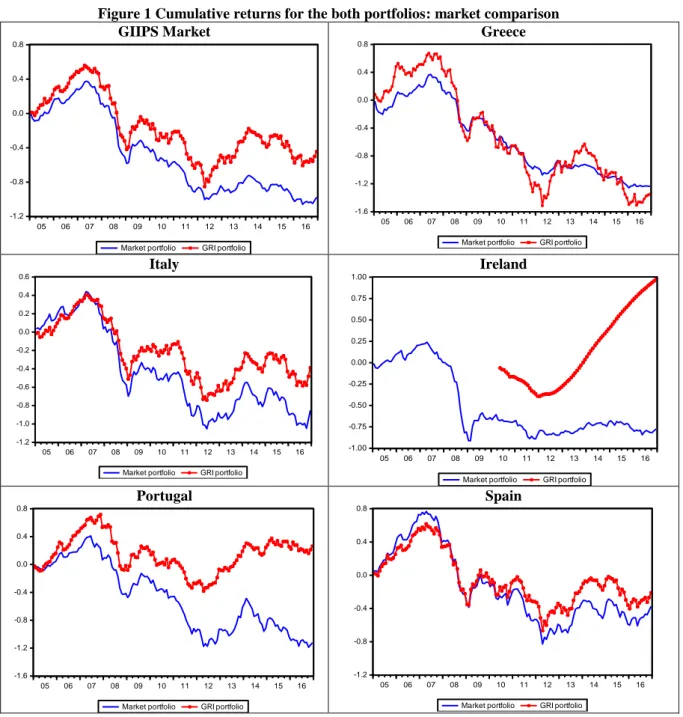
As we can see below, Figure 1 shows the cumulative returns for the GIIPS market as a whole and GRI portfolios, for all stock markets considered in this study, over the period of 2005-2016. We can observe that the GRI portfolio presents a higher cumulative return than market portfolio. The collapse of Lehman Brothers creates a global financial crisis and all markets were affected, but for the weaker economies of the peripheric countries was worst. This graph shows us clearly the pre-crisis and the crisis periods. So, the study considered pre-crisis period between 2005 to 2008 and the crisis period between 2009 and 2016, and the year 2008 is the cut point of the crisis. This approach is also applied to each of the GIIPS markets. The choice of the period under study is not random, it begins when the number of GRI companies is possible to be analyzed. The period ends in 2016 because the GIIPS countries still face economic hardship even though they have already completed financial aid programs.
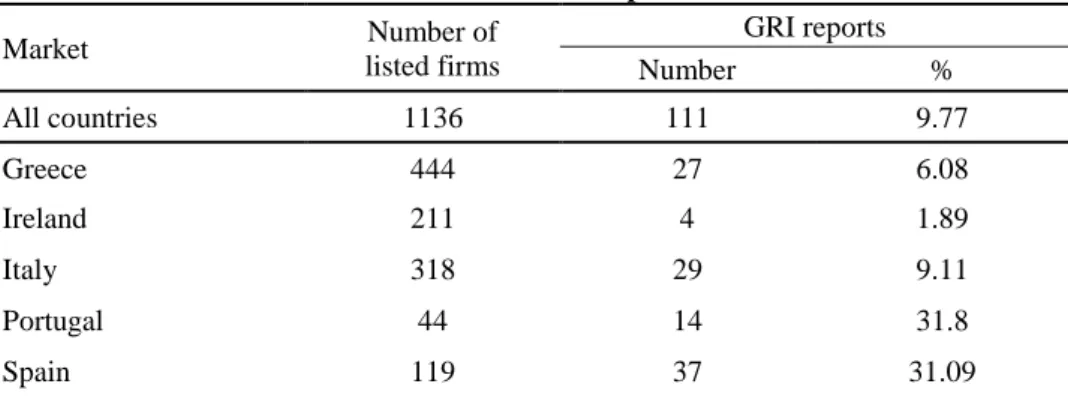
According to Table 2 below, it shows the number of socially responsible companies in accordance with the GRI criteria applied during the period mentioned for each of the markets included in the study, as well as their percentage calculated against the number of companies listed in their respective markets. As we can see, Greece, Italy and Spain are the markets with the largest number of companies rated in GRI selections made, however, when considering the number of companies listed in the stock market of their respective countries, Portugal and Spain are leading with 31.8% and 31.09% in the GRI index.
0 5 10 15 20 25 30 35 40 2005 2006 2007 2008 2009 2010 2011 2012 2013 2014 2015 2016 Greece Ireland Italy Portugal Spain
Figure 1 Cumulative returns for the both portfolios: market comparison GIIPS Market -1.2 -0.8 -0.4 0.0 0.4 0.8 05 06 07 08 09 10 11 12 13 14 15 16
Market portfolio GRI portfolio
Greece -1.6 -1.2 -0.8 -0.4 0.0 0.4 0.8 05 06 07 08 09 10 11 12 13 14 15 16
Market portfolio GRI portfolio Italy -1.2 -1.0 -0.8 -0.6 -0.4 -0.2 0.0 0.2 0.4 0.6 05 06 07 08 09 10 11 12 13 14 15 16
Market portfolio GRI portfolio
Ireland -1.00 -0.75 -0.50 -0.25 0.00 0.25 0.50 0.75 1.00 05 06 07 08 09 10 11 12 13 14 15 16
Market portfolio GRI portfolio Portugal -1.6 -1.2 -0.8 -0.4 0.0 0.4 0.8 05 06 07 08 09 10 11 12 13 14 15 16
Market portfolio GRI portfolio
Spain -1.2 -0.8 -0.4 0.0 0.4 0.8 05 06 07 08 09 10 11 12 13 14 15 16
Market portfolio GRI portfolio Own elaboration
Moreover, Ireland presents only four listed companies in GRI criteria over the considered period which represents 1.89% relatively to the listed companies in Irish Stock market. In the end, the study considered 1136 listed companies and 111 are reporting and classified according to GRI guidelines during the period 2005-2016.
Table 2 shows that most of listed companies still not disclose according to GRI guidelines, only 9.77 % of the sample does so. This finding in GIIPS’ market goes against what Gjolberg (2009) states that these countries present a negative score in the index of national CSR practices.
As mentioned by Jackson and Apostolakou (2010) and Scholtens and Dam (2007) the particularities of each country should be considered, so the study also analyses each GIIPS’s market separately.
In Table 3 below, it presents descriptive statistics for the monthly returns series for portfolios for the GIIPS’ market as a whole and for each country, as follows: mean, standard deviation and Jarque-Bera.
8
The financial crisis began in the midle half of 2007 but the turning point in their evolution has been the collapse of Lehman Brothers on the 15th September 2008. The global financial crisis transmission of financial stress in
Europe and the weakest economies in the peripheral countries surfed another crisis when their governments have to seek financial help from the International Monetary Fund (IMF). Table 4 shows the financial assistance program of each of the countries involved, that began in 2010.
Table 2: Structure of the sample 2005-2016
Market Number of listed firms GRI reports Number % All countries 1136 111 9.77 Greece 444 27 6.08 Ireland 211 4 1.89 Italy 318 29 9.11 Portugal 44 14 31.8 Spain 119 37 31.09
This table shows the structure of the sample in each of the five European stock markets considered, during the period of 2005 to 2016. The maxim number of selected companies according to the GRI criteria during the considered period, as well as it’s percentage relatively of the listed companies in their respective markets, is also shown.
Table 3: Descriptive statistics
Mean Std dev
deviation
Jarque-Bera observations Panel A: Market – benchmark
All markets -0.006 0.042 68.861*** Greece -0.008 0.043 78.157*** Ireland -0.001 0.023 1.894 Italy -0.006 0.056 7.537** Portugal -0.008 0.058 0.400 Spain -0.002 0.061 3.776
Panel B: GRI Portfolio
All markets -0.003 0.057 7.617** Greece -0.009 0.084 2.882*** Ireland 0.012 0.021 19.625*** Italy -0.003 0.054 4.075* Portugal 0.008 0.057 30.187*** Spain -0.007 0.061 2.589
This table presents descriptive statistics for the monthly returns series for portfolios. Portfolios are formed by benchmark (Panel A) and using GRI criteria (Panel B) for each five GIIPS stock markets considered in this study over the sample period (2005-2016). ***, ** and * represent significance
Table 4: Financial assistance program Country
Greece
Greece has been receiving financial support from euro area countries and the International Monetary Fund (IMF) to cope with its financial difficulties and economic challenges since May 2010. In August 2015 a third assistance program was launched under the European Stability Mechanism (ESM) framework
Ireland
Since the program started in February 2011, the EFSF has supported the macroeconomic adjustment in Ireland has successfully concluded the final review of its assistance program. This means that Ireland will exit the rescue program according to plan.
Italy Italy has been receiving financial support from euro area countries and it was completed on June 2013.
Portugal
In April 2011, Portugal requested financial assistance from the EU, euro area countries. The IMF covered the period 2011 to mid-2014 and included a joint financing package of which was provided by the EU/EFSM, EFSF and provided by IMF
Spain The program had been agreed by the Eurogroup in July 2012 for a period of 18 months and provided an external financing by euro area countries.
Source: International Monetary Fund. Own elaboration.
4. Methodology
For the portfolio analysis the study considers two different approaches in order to provide overall results. Firstly, the empirical research assumes the existence of a linear relationship between the return generated by the GRI and the market portfolio for the five GIIPS stock markets considered. While the second approach consists on applying a multifactor model.
4.1. Market model
The returns
R
i t, are calculated as:,
ln(
,/
, 1)
i t i t i tR
=
P
P
-Where
P
i t, andP
i t,-1 are the share prices of firm i at the end of month t and t-1, respectively. The market model, in this case is given by:(
)
(1)
GRIt ft mt ft t
R
R
R
R
where
R
tGRI is the return of the GRI portfolio in month t andR
mt is the return of the stock market portfolio in month t. The parameters
and
in the market model represents the intercept term and systematic risk, respectively. The study employsR
f as the risk-free rate three-month Treasury Bill rate in Europe (Euribor- 3 months).4.2 Carhart (1997) four-factor model
The models of Fama and French (1992, 1993 and 2012) and Carhart (1997) have been widely applied in studies of socially responsible funds and portfolios to explain their profitability in the light of risk factors. In this context we highlight the work of Renneboog et al. (2008), Gil-Bazo et al. (2010), Derwall et al. (2011), Miralles et al. (2012), Humprey et al. (2012), Brzeszczynski and McIntosh (2014) for the UK market and Mollet and Ziegler (2014) who investigated the performance of socially responsible portfolios in the North American market and European markets in the period 1998-2009 and applied the four-factor model of Carhart (1997). Furthermore, the size of the firm is analysed as a factor that should influences a specific choice in the CSR field.
For this analysis the data used is described and the methodology applied for the construction of the Fama and French (2012) factors. To compare the GIIPS markets with a stock market not so affected by the financial crisis, the study calculates the risk factors based on the German market returns over the 2005-2016 period.
10
For the construction of the proxy for the market portfolio, the research uses the return on all stocks listed on the Frankfurt Stock Exchange over the 2005-2016 period.
This study applied the Carhart (1997) four-factor model to analyse the performance of the GRI portfolios in the GIIPS’ market over 2005-2016 period. The monthly returns are assessed using the Fama and French (1993) three-factor model expanded with Carhart (1997) momentum factor:
(
)
(2)
GRI
t ft mt mt ft smb t hml t mom t t
R
R
R
R
SMB
HML
MOM
mt
R
is the return of the stock market portfolio in month t.t
SMB
is the difference in monthly return between small and large-cap portfolio in month t tHML
is the difference in monthly return between a value portfolio (high book-to-market ratio) and a growth portfolio (low book-to-market ratio) in month tt
MOM
is the difference in monthly return between a portfolio of past winners and past losers (up-minus-down) The momentum factor is designed to capture the risk due to the momentum found in stock returns by Jegadeesh and Titman (1993). The equations (1) and (2) are estimated by the Ordinary Least Squares method (OLS).5. EMPIRICAL RESULTS
In this section the results are presented, which were obtained by considering all the 1,136 companies listed in the markets of the GIIPS’s group, by applying the market model described above over 2005 to 2016 period. The results consider two subperiods and show the relation between the risk adjustment before and after 2008. The proposed model was also applied to each GIIPS stock market.
5.1. GIIPS MARKET
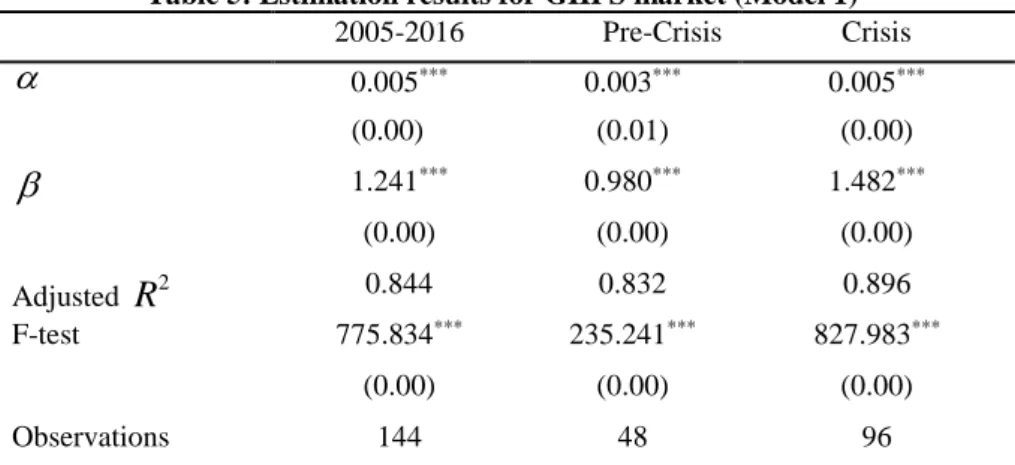
Table 5 below presents the results of the OLS regression for the model (1), which comprises the entire sample over 2005 and 2016 and in the sub-periods. The results show that the constant
presents a positive and statistically significant value, which indicates that the risk-adjusted return over the 2005 and 2016 and considering the sub-periods, which means that the GRI portfolio outperformed the market portfolio. However, the systematic risk obtains a significantly higher than one for all periods considered in this study, except in pré-crisis. Thus, we can say that investing in GRI-rated companies according to GRI guidelines has outperformed the market portfolio, although it is a riskier investment after a financial crisis.Table 5: Estimation results for GIIPS market (Model 1)
2005-2016 Pre-Crisis Crisis
0.005*** 0.003*** 0.005*** (0.00) (0.01) (0.00)
1.241*** 0.980*** 1.482*** (0.00) (0.00) (0.00) AdjustedR
2 0.844 0.832 0.896 F-test 775.834*** 235.241*** 827.983*** (0.00) (0.00) (0.00) Observations 144 48 96This table shows the results of the market model applied in all markets as a single market in Europe during the period from 2005 to 2016, and over the sub-periods before and crisis period. The values of the adjusted R2 and F statistics and their respective p-value are presented in the table***, ** and * represent significance levels of 1%, 5%, and 10% respectively.
The GRI portfolio is well explained by the proposed model since it presents an R2 coefficient between 84 and
89 percent in three periods under study. These findings are consistent with other studies (Miralles-Marcelo et
These small changes in the constant value can be justified by considering that during the crisis, the attention of the investors regarding the companies that disclose non-financial information diminishes. On the other hand, companies face greater difficulties in the period of crisis and the disclosure of sustainability reports require resources, which represent a greater cost to the company.
5.2. EMPIRICAL RESULTS BY MARKET
In this section, the study analyses each one of the GIIPS’s group, but the Irish stock market is not considered because it has only four companies in the GRI rating, which is not sufficient to analyse. Table 6 shows the estimation results of market model for each GIIPS´ group over 2005-2016 period. As we can see in the second column, the risk-adjustment return, measured by alpha, is only significantly from zero in Portuguese market (Panel A) and Portuguese and Greek markets (Panel C), unlike the others markets. The third column presents the beta coefficient, and again, we can see differences among the GIPS markets. We observe a beta coefficient significantly higher than one for the Greek market in the three periods considered in this study. This means that investing in GRI Greek companies is riskier than investing in the market portfolio, unlike the Italian and Spanish markets, where investing in GRI portfolio is a less risky investment.
The GIIPS stock markets did not all react to the economic crisis in the same way. As a result, there was a change in the behaviour of investors in each market. As Scholtens and Dam (2007) illustrate that business ethics significantly differs between countries. Izzo and Donato (2012) argue that less developed stock markets, and specifically the Italian one, are not mature enough and well advanced to properly appraise the positive value embedded in such releases. This result is consistent with our expectations about the behaviours of Italian investors, who perceive negatively the socially responsible strategies of the companies attributing them a negative value.
Table 6: Estimation results (Model 1): Market comparison
Adjusted 2R
F-test Panel A: 2005-2016 Greece 0.004 1.609*** 0.680 305.495*** Italy 0.002 0.886*** 0.851 819.372*** Portugal 0.007*** 0.820*** 0.708 347.947*** Spain 0.000 0.944*** 0.865 911.189*** Panel B: Pre-crisis Greece 0.000 1.239*** 0.704 113.270*** Italy 0.000 0.751*** 0.824 222.407*** Portugal 0.007 1.039*** 0.746 139.566*** Spain 0.000 0.848*** 0.854 270.090*** Panel C: Crisis Greece 0.009** 2.071*** 0.732 261.800*** Italy 0.002 0.957*** 0.872 653.057*** Portugal 0.008*** 0.733*** 0.711 235.437*** Spain 0.001 0.995*** 0.874 664.216***This table shows the results of the market model applied for each GIIPS market over the sample period and in sub-periods of pre-and crisis period. The values of the adjusted R2 and F statistics and
their respective p-value are presented in the table. ***, ** and * represent significance levels of 1%,
5%, and 10% respectively.
12
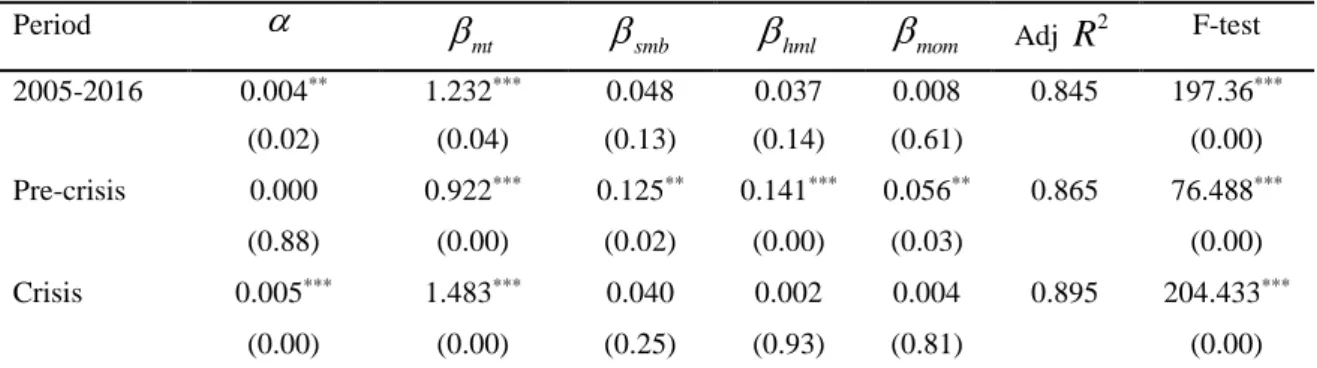
The Table 7 presents the regression results for the Carhart (1997) model. As we can see, it shows that the alphas are significantly positive, and the betas coefficients presents a significantly positive value but higher than the unit for the GRI portfolio in the GIIPS markets in a pool regression over the period 2005 to 2016 and in post-crisis period. These results mean that invest in a GRI portfolio is more profitable but riskier than investing in a market portfolio. In this period the GRI portfolio is explained only by the market risk factor, since the remaining risk factors are not statistically significant. However, in the pre-crisis period the risk factor estimators are all positive and statistically significant, but the alpha coefficient presents a negative value not statically significantly.
Table 7: Estimation results Carhart (1997) model for GIIPS market
Period
mt
smb
hml
mom AdjR
2 F-test2005-2016 0.004** 1.232*** 0.048 0.037 0.008 0.845 197.36*** (0.02) (0.04) (0.13) (0.14) (0.61) (0.00) Pre-crisis 0.000 0.922*** 0.125** 0.141*** 0.056** 0.865 76.488*** (0.88) (0.00) (0.02) (0.00) (0.03) (0.00) Crisis 0.005*** 1.483*** 0.040 0.002 0.004 0.895 204.433*** (0.00) (0.00) (0.25) (0.93) (0.81) (0.00)
This table reports the results on the Carhart (1997) regressions during the sample’s period and in the sub-periods of pre-crisis and post-crisis, in all GIIPS market. The values of the adjusted R2 and F statistics and
their respective p-value are presented in the table***, ** and * represent significance levels of 1%, 5%, and
10% respectively.
Looking for the risk factors, the study finds that the GRI portfolio has a positive and significant exposure to the SMB, HML and MOM factors. GRI presents results in higher book-to-market ratios. So, a GRI portfolio constructed with companies have a small size, but which are high book-to-market and winners in the past do not capture the GRI effects.
The GRI portfolio is as well explained in the market model (1) as in Carhart (1997) model (2) because they present a R2 coefficient between 84 and 89 percent in three periods under study.
6. CONCLUSIONS
The aim of this research is to examine the relationship between corporate social responsibility performance and financial performance in GIIPS markets, into a timeframe of more than one decade which comprises the financial crisis. The sample includes all listed companies as well as all industries; thus, the study represents a sample of the real situation of each stock market. The research applies a market and a multifactor model’s regression to establish the relationship between companies rated by the GRI and the market portfolio. In the other hand, the study predicts the market behaviour in the face of a financial crisis on the stock market. This research concludes that the history of CSR in each country of the GIIPS group is very different, namely regarding its policies of social responsibility, culture, and values. The results show that investing in companies rated by GRI in the Portuguese stock market is profitable and less risk than investing in market portfolio. The author’s findings imply that the socially responsible investment does make perfect financial sense in a small economy such as Portugal.
These results aim at persuading managers to implement CSR actions in a greater extent to enhance firm market efficiency and at a larger outcome scale to improve the CSR state in Greece, Ireland. Despite the costs that may occur, adopting CSR strategy, companies may obtain higher stock returns and satisfy the needs of their stakeholders.
This study contributed to Corporate Social Responsibility theoretical debate, in the field of the relationship between CSP and CFP. Nevertheless, this study shows that the majority of firms still not disclose CSR information according GRI rating, namely Irish companies must make the necessary changes to their CSR policies.
It would be interesting to analyses if the findings for GIIPS’s markets would be like other European markets.
Acknowledgement
The author thanks to Instituto Politécnico de Lisboa that has been financially supported this project under the Research, Development, Innovation and Artistic Creation Project (IDI&CA)-2017 referenced by IPL/2017/GIIPS5/ISCAL).
Author contacts
Irene Guia Arraiano, Associated Professor; Department of Business; ISCAL - Instituto Superior de Contabilidade e Administração de Lisboa, IPL - Instituto Politécnico de Lisboa, Campus de Benfica, 1549-014 Lisboa, Portugal; iarraiano@iscal.ipl.pt
.
References
Afonso, S., Fernandes, P. & Monte, A., (2012). CSR of top Portuguese Companies: Relation between Social Performance and Economic Performance, World Academy of Science, Engineering and Technology, 66, 798-802.
Albareda, L. (2013). CSR governance innovation: standard competition-collaboration dynamic, Corporate Governance, 13 (5), 551-568.
Brzeszczynski, J. & McIntosh, G. (2014). Performance of Portfolios Composed of British SRI Stocks, Journal Business Ethics, 120, 335-362.
Carhart, M. M. (1997). On persistence in mutual fund performance, Journal of Finance, 52 (1), 57-82.
Derwall, J., N. Guenster, R. Bauer & K. Koedijk (2005),” The Eco-Efficiency Premium Puzzle”, Financial Analysts Journal, 61 (2), 51-63.
Derwall, J., K. Koedijk & J. T. Horst (2011). A tale of values-driven and profit-seeking social investors, Journal of Banking & Finance,
35 ( 8), 2137-2147.
Ducassy (2010). Does Corporate Social Responsibility Pay Off in Times of Crisis? An Alternate Perspective on the Relationship between Financial and Corporate Social Performance, Corporate Social Responsibility and Environmental Management, 20, 157-167.
Elkington, J. (2010). Cannibals with Forks: The Triple Bottom Line of 21st Century Business, Majeure Alternative Management, HEC,
Paris.
European Commission (2001), COM 2001 336 def. – Green paper. Promoting a European framework for corporate social responsibility, available in: www.i-csr.org/repository/ECcom2001_0366en01.pdf
European Commission (2002). COM 2002 347 def. – Communication form the commission concerning corporate social responsibility: a business contribution to sustainable development, available in: www.i-csr.org/repository/EC_com2002_0347en01.pdf
European Commission (2002). Corporate social responsibility – A business contribution to sustainable development. Luxemburg: Office
for Official Publications of the European Communities.
European Commission (2011). A renewed EU strategy 2011–14 for corporate social responsibility. Communication from the Commission to the European Parliament, the Council, the European Economic and Social Committee and the Committee of the Regions, Com. 681 final, 6.
Eurosif (2014). European SRI Study 2012, Eurosif, Paris.
Fama, E. & K. French, (1993). Common risk factors in the returns of stocks and bonds, Journal of Financial Economics, 33 (1), 3-56. Fernández, M. A., (2010). Finanzas Sostenibles, Ed. Netbiblo, La Coruña.
Fiori, G.,Donato, F. & Izzo, M. (2007). Corporate Social Responsibility and Firms Performance - An Analysis on Italian Listed Companies, Electronic copy available at: http://ssrn.com/abstract=1032851
Galema, R., Plantinga, A. & Scholtens, B. (2008). The stocks at stake: Return and risk in socially responsible investment, Journal of
Banking and Finance, 32, 1646-1654.
Gamerschlag, R., Möller, K. & Verbeeten, F. (2011). Determinants of voluntary CSR Disclosure: Empirical Evidence from Germany.
Review of Managerial Science, 5, 233-262.
Gjølberg, M. (2009). Measuring the immeasurable?: Constructing an index of CSR practices and CSR performance in 20 countries,
Scandinavian Journal of Management, 25, (1), 10-22.
Hong, H. & Kacperczyk, M. (2009). The price of sin: The effects of social norms on markets, Journal of Financial Economics, 93, 15-36. Humphrey, J. E., Lee, D.. & Shen, Y. (2012). Does it cost to be sustainable?, Journal of Corporative Finance, 18, (4), 626-639. Jackson, G. & Apostolakou, A. (2010). Corporate social responsibility in Western Europe: a institutional mirror or substitute, Journal of
Business Ethics, 94, (3), 371-394.
Jegadeesh, N. & Titman, S. (1993). Returns to buying winners and selling losers: implications for stock market efficiency, The jounal of
Finance, 48, (1), 65-91.
Karagiorgos, T. (2010). Corporate Social Responsibility and Financial Performance: An Empirical Analysis on Greek Companies,
European Research Studies, 13 (4), 85-108.
Kempf, A. & Osthoff, P. (2007). The effect of socially responsible investing on portfolio performance, European Financial Management,
13, (5), 908-922.
KPMG (2015), International Survey of Corporate Responsibility Reporting 2015, KPMG Internacional, Netherlands.
Miralles-Marcelo, J., Miralles-Quirós, M. & Miralles-Quirós, J. (2012). Performance Bursátil de las Empresas Socialmente Responsables,
Cuadernos de Economía y Dirección de la Empresa, 15, 221-230.
Miralles-Quirós, M. M., Miralles-Quirós, J. L. & Arraiano, I. (2017). Are Firms that Contribute to Sustainable Development by Investors?,
14
Mollet, J.C. & Ziegler, A. (2014). Socially responsible investing and stock performance: New empirical evidence for the US and European stock markets, Review of Financial Economics, 23 (4), 208-216.
Perrini, F., Pogutz, S., & Tencati, A. (2006). Corporate Social Responsibility in Italy: State of the Art, The Journal of Business Strategies,
23, (1), 65-91.
Schadewitz, H. & Niskala, M. (2010). Communication via responsibility reporting and its effect on firm value in Finland, Corporate Social
Responsibility and Environmental Management, 17, (2), 96-106.
Scholtens, B. & Dam, L. (2007). Cultural values and international differences in business ethics, Journal of Business Ethics, 75, 273-284. Statman, M. & Glushkov, D. (2009). The wages of social responsibility, Financial Analysts Journal , 65 (4), 33-46.
Sweeney, L. (2008). European Sustainability Reporting Association report for Ireland, Retrieved from
www.sustainablereporting.eu/ireland
Trinks, P. & Scholtens, B. (2017). The Opportunity Cost of Negative Screening in Socially Responsible Investing. Journal of Business
Ethics, Available on doi: 10.1007/s10551-015-2684-3.
Renneboog, L., Horst, J. & Zhang, C. (2008). The price of ethics and stakeholder governance: the performance of socially responsible mutual funds, Journal of Corporate Finance, 14, (3), 302-322.
Waddock, S. A. & Graves, S. (1997). The corporate social performance-financial performance link, Strategic Management Journal, 18, (4), 303-319.
Wright, P. & Ferris, S. (1997). Agency conflict and corporate strategy: the effect of divestment on corporate value, Strategic Management
Journal, 18, (1), 77-83.
Wu, M. & Shen, C. (2013). Corporate Social responsibility in the banking industry: Motives and financial performance. Journal of Banking