i
IMPROVING THE PERFORMANCE OF SOCIAL
MEDIA CAMPAIGNS WITH THE INTERNET OF
THINGS
Miguel Jose Rivera Ospino
Dissertation submitted in partial fulfillment of the requirements for the degree of MSc in Business Administration at CATÓLICA LISBON School of Business & Economics
ADVISOR: Ana Isabel Almeida Costa May 2016
ii ABSTRACT
This dissertation describes the use of the Internet of Things (IoT) in a social networked media campaign for a digital marketing agency. An electronic object platform a van, the interior of which changed color as a function of Twitter user interactions, was developed to simultaneously motivate and assess engagement with the campaign. The campaign’s dissemination was furthermore supported by Facebook posts and prior IoT based research measuring the popularity of different keywords in Twitter conversations, which were subsequently used as Hashtags in the campaign. Using a quasi-experimental methodology, it was created two campaigns. The results obtained a preview campaign (Without IoT) was compare with the results of the IoT campaign. Under the data analysis the IoT generate positive results as a tool for the Propagation of information.
iii SUMÁRIO
Esta tese explica descreve o uso de internet das coisas (Internet das coisas) em uma campanha Twitter usando com a empresa Van Marketing Digital (VAN) como um patrocinador. Foi desenvolvida uma plataforma de objeto eletrônico por medição da interação na rede social. Esta ferramenta obtido o número de menções, o número de utilizador e as descrições deles no Twitter. O objeto IoT selecionado foi uma Van, que muda a cor das luzes da janela pelo Twitter interação. O carro foi o único incentivo para o público Twitter a fim de analisar se a retribuição virtual foi o suficiente para eles. A campanha começou com uma campanha no Facebook na página de fãs Van, chamando a atenção dos usuários do Facebook como incentivo para participar na campanha Twitter, como resultado IoT potencializada campanha aumentando o alcance es interação de Van marketing nos meios de comunicação social. Os resultados obtidos de uma campanha de pré-visualização (Sem IoT) foi comparar com os resultados da campanha de Internet das coisas. Sob a análise de dados da Internet das coisas gerarem resultados positivos como uma ferramenta para a propagação de informações.
iv ACKNOWLEDGEMENTS
Firstly, I would like to express my sincere gratitude to my advisor Ana Isabel Almeida Costa for the continuous support of my Dissertation for the MSC degree, for his patience, motivation, feedbacks and immense knowledge. His guidance helped me in all the moments. I would express my gratitude to my mother Carmen Ospino for all the support and education that makes me better person and student.
For Affife Retamozo whom help me to organize my ideas to find a knowledge flow for the commitment of the dissertation.
Finally my eternal gratitude to Pedro Rosa manager of Van Marketing for all the sponsoring and the time investment on this dissertation.
v TABLE OF CONTENTS CHAPTER 1: INTRODUCTION ...1 1.1 Background ...1 1.2 Problem statement ...4 1.3 Aim ...5 1.4 Scope ...5 1.5 Research method ...6 1.6 Relevance ...6 1.7 Dissertation outline ...7
CHAPTER 2: LITERATURE REVIEW AND CONCEPTUAL FRAMEWORK ...8
2.1. IoT and Social Networks ...8
IoT and Social Networks ...8
2.2. Marketing with IoT ...9
Marketing with IoT...9
2.3. Traditional online advertising and IoT advertising ... 10
2.4. Other Digital Marketing Technologies... 11
2.4.1. Big Data ... 11 Big Data ... 11 2.4.2. Live Streaming ... 12 2.4.3. Mobile Advertising ... 12 2.5. Marketing on Twitter ... 13 Marketing on twitter ... 13 2.6. Marketing on Facebook ... 14
2.7. Twitter vs. Facebook marketing ... 16
2.8. Elements of a Facebook post ... 17
vi
2.8.2. Tag... 18
2.8.3. Share ... 18
2.9. Elements of a Twitter post ... 18
The reply and favorite... 18
2.9.1. The reply and favorite ... 18
2.9.2. Tag... 19
2.9.3. Retweet ... 19
2.9.4. Hashtag ... 20
Hashtag ... 20
2.10. Digital Social Media Metrics ... 20
2.10.1. Reach ... 20
2.10.3. Engagement ... 21
2.11. Conclusions ... 22
CHAPTER 3: METHODOLOGY... 23
3.1 Introduction ... 23
3.2 Research Approach and Design ... 23
3.3 Population and sampling ... 24
3.4 Data collection ... 25
3.5 Data with t-student test Analysis ... 29
CHAPTER 4: RESULTS AND DISCUSSION ... 30
4.1. Preview data collection ... 30
4.2. Preview Campaign ... 32
4.3. Twitter IoT Campaign ... 32
4.4. Results from Facebook... 34
vii TABLE OF FIGURES
Figure 1. Representation of a Twitter information cascade. (Bakshy et al., 2011) ...4
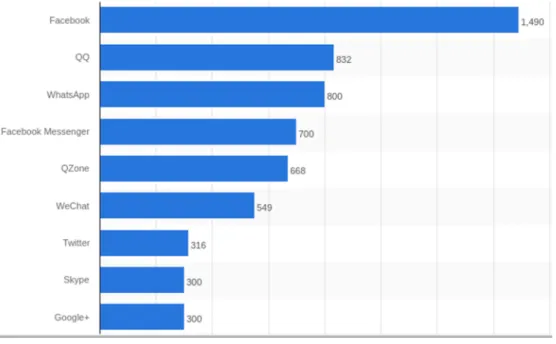
Figure 2. The ranking of social networks by active users.(Statista, 2015) ... 13
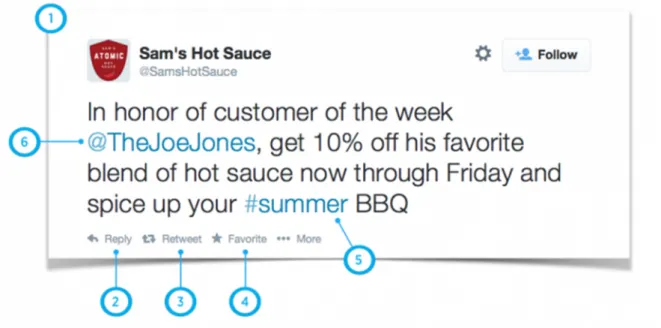
Figure 3 Atributes of a tweet. 1 Tweet, 2 reply, 3 Retweet, 4 favorite, 5 Hashtag and 6 Tag. (Twitter Business, 2015) ... 19
Figure 4. Engagement Formula (Lovett, 2011). ... 21
Figure 5. Research Methodology ... 24
Figure 6. Facebook post from the Preview campaign. ... 26
Figure 7. Twitter post from the Preview campaign. ... 27
Figure 8. Post before the campaign launching. ... 28
Figure 9. Facebook post of the campaign's beginning. ... 28
Figure 10. Distribution of keywords. ... 31
viii TABLE OF TABLES
Table 1. Hashtags used on the Twitter campaign and Colors. ... 25
Table 2. Keywords of Digital Marketing ... 30
Table 3 Quantity of tweets by Country. ... 33
Table 4. Results on Facebook of the IoT campaign after the close of the campaign. ... 34
ix TABLE OF ANEXES
1
CHAPTER 1: INTRODUCTION
1.1 Background
Since the early stages of Internet, digital marketing has been considered an interesting and profitable field for people involved in advertising. This area of publicity brings some important capabilities to companies, such as better customer feedback and lower costs of marketing communications (Parsons, Zeisser, & Waitman, 1998). Additionally, it is possible to say that the social impact of Internet has produced a challenging marketing which is more correlated to the evolution of the communication and the technology nowadays. Therefore and without doubt, digital marketing may be viewed as a key tool for sensing consumer behavior in the online world. Proof of this is the current use of the Internet of Things to mine online brand conversations and brand sentiment data (Edelman & Salsberg 2010).
Evolution in software platforms and mobile hardware devices has contributed to spread the use of internet service out to almost anyone around the world. Consequently, commercial contents and monitor of them have originated a variant of digital market which is known as Participative Marketing. It refers to those earned marketing communications which occurs in Social Networked Media (SNM) and for a better understanding of the concept you can find some authors who describe this terminology as:
Participative marketing is possible today thanks to the advances in information and communication technologies, and provide an efficient dual flow of communication between companies and buyers (List, 2003).
Participative Marketing is contrary to traditional marketing, where companies just broadcasted, but did not receive a big amount of information from the market. This, combined with market diversification in the population called for diversification of the
2 technology, to provide more participative marketing activities (Jara, Parra, & Skarmeta, 2014).
The widespread use of internet service has generated great changes that impact the existing technologies. A remarkable event to mention is the current trend to diversify the digital technology through seamless links humans or at least objects able to be adaptable to human behavior. This diversification is called humanization of the technology.
In the digital world of Internet 2.0 either there is a large quantity of products where the users can create content on the website or where websites create content for the users. However, when these two processes are combined, a new concept of technology emerges “Internet of the things” (IoT).
The purpose of Internet of the things is offer Internet in any place of a material environment, so the web service is not dependent of a mobile device or a computer. In this manner, IoT objects are being thought and developed to satisfy the social needs of the users and at the same time to sense the environment and send information back to the Internet which is part of participative marketing mentioned above. There are important cases of this type of products that are being marketed nowadays.
The SmartGlasses are an example of IoT objects according to the next definition: compact devices and connected to Internet who receives and sends information (Ashton, 2009).
Nike+ SmartWatch is another example of IoT. The watches can sense the behavior of the people through different type of sensors. The SmartWatch is focus on the training records and sharing them in a social network created with this proposal. Nike+ is a participative marketing solution where the watches can share key marketing information to an information system with benefits for customers, but this type of marketing is only possible due to the advances in remote connection in the present times (Atzori, Iera, Morabito, & Nitti, 2012).
3 Internet revolution has done possible to establish conditions to manufacture smart devices with the performance required that allow to user to publish information in social networks, but also this information can be used in the other way, bringing the information online to some another object. In consequence, that object it is converted in a sensor of interaction on Internet.
Twitter is a microblogging social network with 140 characters limit per post with enough power in the information propagation. As a consequence there are tools created to predict the impact of one Tweet (name of a post in twitter) on the propagation of the information (Ye & Wu, n.d.). Therefore, the media news providers invest a lot of time and money just on this social network.
This phenomenon of propagation is mainly possible by the retweet tool and the incitement added by the influencers by means some Twitter profile that presents the retweet tool. The Retweet can be compare with the reshare from Facebook. Nonetheless, accounts with cascade effect are a really interesting medium of propagation which is produced for the big amount of followers on the accounts (Bakshy, Hofman, Mason, & Watts, 2011) and that is because of a person with a large number can create a web or net of propagation of the information where initiators can spread a message to many more people, just if their have a high number of followers.
4 Figure 1. Representation of a Twitter information cascade. (Bakshy et al., 2011)
1.2 Problem statement
Twitter is one of the biggest Social Networked Media in the world, with 316 million of users in 2015 and growing every year (Statista, 2015) and for that reason it is one of the most powerful digital media distributors in the world too.
The 140 character-limit per tweet enables a very fast flow of summarized information and precisely, for that reason Twitter is one of the preferred social media by the Millennials. It is important to clarify that Millennials is a new generation of people more connected, narcissist and at the forefront technology (Bergman, Fearrington, Davenport, & Bergman, 2011). Their constant use of SNM brings an easy way to segment this population, but their narcissism also implies the need for more personalized approaches, in order to capture their attention because Millennials want to feel unique and relevant. This particular characteristic brings more problems to brands, because they need to understand the behavior and sell to this new generation, particularly through SNM (Mangold & Smith, 2012).
5 Traditional brands need thus to adapt their marketing strategies by attempting to figure out the millennial behavior because the shopper behavior of young people need more studies by the power of the reviews in the social networks (Peregin, 2015). The reviews make reference to a feedback of other person who used the brand, and that point is really important for the Millennials on the purchasing decision. Definitely, a great advantage of online companies over traditional companies is that for those last which work in a physical world, it is harder to relate likes with sales or Retweets with acquiring new clients.
1.3 Aim
To achieve this aim, the following research questions should be answered: o Can an IoT object be used to measure user engagement in SNM?
o Can an IoT object enhance engagement of SNM users with marketing campaigns?
1.4 Scope
For practical purposes, a marketing communication campaign was performed over a single advertiser client: Van Marketing Digital. This is a Portuguese digital marketing agency which is focused in the management of SNM presence of Portuguese brands using social network analysis techniques.
Twitter was chosen due to the small proportion of research about twitter that exists in a Portuguese context, and the small amount of information created by the user. Other interesting point is the use of hash tags to segment the topics and to create promotion of a specific campaign or brand. For more information on the chapter 2 will be explained the meaning of the hashtag.
A van was implemented as an electronic object platform, inside of which the color changes as a function of Twitter user interactions. It was developed both to motivate and assess engagement with the campaign whose dissemination was furthermore supported by Facebook
6 posts and prior IoT-based that research the measure of popularity of different keywords in Twitter conversations; those were subsequently used as hashtags in the campaign.
1.5 Research method
The methodology used was quasi-experimental. It contains two important stages: initially the information is captured in real time and later analyzed through an IoT object. For this exploratory research, the primary data was created from all users on Twitter, who talked about specific keywords in digital marketing context. Then, the information was captured using filters inside the Application Programing interface (API) of Twitter. In the next place, that semi-raw primary data from the big data ecosystem was filtered again to identify what were the most important topics referred by the Twitter users in a marketing digital context. With this we could acquire all feedback, even those created by virtual robots to gain more followers; afterward, they were located in ranges of measure which let to know the level of recognition and the power of a brand in the Twitter.
Moreover, in order to get the required performance for the campaign and support the impact of IoT over a SNM context, a campaign without the IoT was implemented followed by other campaign with the IoT component. The differences of performance found could be measured in terms of engagement, to assess the potential value of the IoT as a social marketing tool.
1.6 Relevance
Using IoT technology it is possible to know how big is the penetration of a brand on Twitter and how this can have a critical impact over the sales (Cretu & Brodie, 2007). This tool can be used to measure what is good and bad with the brand in a scale to develop new strategies of marketing that then can be used as a digital campaign. Thus Internet of the things will be a potential digital marketing tool to study the consumer behavior in the virtual community through smart physical things.
7 Another fundamental component or definition to conduct research is the Internet of things or the Internet of Everything each year is increasing. Currently all devices are connected to the internet, cars, houses and entire cities also provide information that can be analyzed and used for multiple purposes, under the perspective of marketing and behaviors.
According to Gartner (research and consulting company in information technologies), the Internet of Things (IoT) is a network of physical objects that contain embedded technology to sense or interact with their internal states or the external environment and then communicate them(Rivera & van der Meulen, 2014).
1.7 Dissertation outline
The Chapter 2 establishes a literature review with a brief analysis of IoT and goes more deep regarding the marketing technics used on Twitter. On the chapter 3 will be explained the research methodology used for the data collection on the social data collection and the campaign data collection. On the chapter 4 the results of the IoT campaign and the data collected before the campaign are analyzed. Finally the conclusions were exposed on the chapter 5.
8
CHAPTER 2: LITERATURE REVIEW AND CONCEPTUAL
FRAMEWORK
2.1. IoT and Social Networks
“We define social network sites as web-based services that allow individuals to (1) construct a public or semi-public profile within a bounded system, (2) articulate a list of other users with whom they share a connection, and (3) view and traverse their list of connections and those made by others within the system. The nature and nomenclature of these connections may vary from site to site” (Boyd & Ellison 2010, P211).
Currently there are different types of users generating content in all fields: personal, business politics, media, and services mainly. This phenomenon is called Big Data. Companies and entrepreneurs are working on tools and methodologies to analysis this information for marketing purposes. This is because Internet has a big amount of information about the feedbacks and opinions of the people around the world.
The use of the Hashtag makes simpler the generation of the Twitter campaign described after and data collection. Twitter fits with the definition of Social Media and Social Network Sites. Twitter matches the characteristics of a social network and it has been found to have similarities with news media (Kwak, Lee, Park, & Moon, 2010).
In current times, it does not sound strange to talk about objects connected to Internet, because the Smart objects are already occurring in multiple types and forms, being promoted by brands and media. A simple example is the Mobile Social Network or MSN that describes the phenomenon of the impact of the mobile phones in the social network environment (Pietiläinen, Oliver, LeBrun, Varghese, & Diot, 2009).
9 The mobile communication diffusion is one of the consequences of the massification of the MSN. This diffusion is the consequence of a lower market price of the technology by the manufacture of scale and innovation in this field of the economy (Gruber & Verboven, 2001). Mobile Social Network changes identity of the people and how they exchange the information creating a new type of communication, but this pay a cost on the natural behavior of relationship (Plant, 2000).
The information inside a mobile phone created from the social network interaction, in any level or type provide a broadly relevant information about the behavior of the consumers, that can be used to understand the consumers (Counts & Fisher, 2010).The Smartobjects nowadays can sense and analyses the social interaction of the people to provide customized advertising and other types of digital content. With this the opportunity a higher diffusion of the advertising cans assess the segmentation of the population (Guo, Zhang, Wang, Yu, & Zhou, 2013).
2.2. Marketing with IoT
In the present, there are uncountable tools with the capabilities to create objects and a large open source's community, like Arduino an Italian open hardware with the largest community on the world. This new broad world of equipment and tool can processes the data in the cloud and represent in the real world with some signal. An example of how the IoT brings more services and capabilities to the final user is the Calvin's temperature management control system, where the objects sense the temperature inside a car and through a laptop publishes this information in the cloud for the control center, with this information Calvin cans certified the quality of the merchandise delivered. (Persson & Angelsmark, 2015)
10 In 2015, the number of objects connected to Internet was 4.9 billion and for 2020, it is predicted 25 billion of objects connected (Rivera & van der Meulen, 2014). This is the reason why companies start to develop campaign based on the features created by the IoT products. Some benefits of the objects connected are the costumers and the companies. Because more connected costumers mean more information captured and this information can be processed to anticipate their needs (Kingman, 2015). IoT cans be taken as a new way of marketing called the marketing of the future, because with this anticipation and prediction of the consumer behavior, will create an auto survey population ((Buckman, 2015) and all the information needed for the market analysis. Therefore the market segmentation will be available online.
2.3. Traditional online advertising and IoT advertising
The IoT brings broad the traditional concept of online advertising where the computer catch the information of the people when they are connected with the digital world for example, a person purchase a guitar in an online store and after it start to see other musical instruments it means that this person can be a musician. The traditional system of catch and process the information collected in an Active digital Marketing (Gifford, 1998).
Some IoTs can be used to analyze the owner in their day by day using sensors technology capabilities. GPS and steps counters combined, for instance, can sense the quantity of steps and the distant running by a person to determine the owner fitness. With this information the object can recommend anything from sporting clothes to a cardiology checkup (Guo et al., 2013).
This point of view contrast with an ethic challenge, where the objects violate the privacy of the people. That is, with what type of rights the owner has over the information, how it can be distributed around the digital world and how much benefit can bring the action of share. This
11 type of challenges was present from the creation and interaction of the smart-phones until nowadays. So, smart objects will be part of the future of this discussion on the IoT perspective (van Kranenburg & Bassi, 2012). This type of objects has other behavior with the owner than the computers because they both catch information when the people interact with them. But the smart objects can sense more variables and they are more time present and involved in the regular life than computers.
2.4. Other Digital Marketing Technologies
Marketing has a long tradition of attempting to leverage human interaction with the technologies. In the era of Internet, the world is more connected than before and the development in the technologies over the network goes faster than anything before. This speed sometimes means less time to learn and shorter tech life-spans.
2.4.1. Big Data
Big Data is the technological monster of the analyses of the human behavior nowadays. This technology is still under research to counteract its current limitations of volume, variety and velocity. The amount of information generated on Internet is huge and it comes as messages, posts, images, videos, audios etc. The challenge is to catch and process as much information as is possible in a short time, to be able to take a decision (McAfee & Brynjolfsson, 2012).
In marketing, the use of Big Data can give to the marketers a broad point of view of the trends or give a clear explanation of the different qualities of market segments with a clear
12 information support depending of the needs. The big Data could be the biggest ally when understanding the consumer behavior will be necessary or locate the market segments with more efficiency in the future (Bughin, Chui, & Manyika, 2010).
2.4.2. Live Streaming
Live Streaming is the digital competitor of television in the Internet. This technology appeared a few years ago with the increase of the speed on the domestic Internet bandwidth. Live streaming only recently became a massive medium because before the size of the information broadcasted did not give the sensation of an audiovisual perception like the television (Liao et al., 2006). Even nowadays there are still challenges for this technology in terms of infrastructure and compression of the video.
The marketing benefits of live streaming are similar to television, plus the information on real time of the broadcast number of viewer giving a precise number of ratings and size of the audiences achieved.
2.4.3. Mobile Advertising
The creation of mobile devices opened a new means of consuming telecommunications, were people can communicate at any moment and from everywhere. When these devices became more personal and the SMS grew as a channel of the distribution of the information. The introduction of mobile internet with MMS and WAP technologies bring more possibilities of mobile marketing. In the new millennium the Smartphones enter to the market, the mobile Internet increased the capacity, now the personalization of the ads is a reality to increase user acceptance and assimilation of the information (Wong, Tan, Tan, & Ooi, 2015).
13 Mobile advertising can reach the final customer in a short time, but consumers do not appreciate this type of direct marketing. This happens because the cell phone is considered a personal device; the possible future consumer considers disrespectful the use of SMS advertising without any authorization. Therefore this type of advertising may not be the best option for a massive propagation of information (Tsang, Shu-Chun, & Ting-Peng, 2004).
2.5. Marketing on Twitter
Twitter is the second most important non-Chinese social network in the world, with a population of 316 million of active users (Figure 3). It grants therefore access to a big amount of public information generated by the users.
Figure 2. The ranking of social networks by active users.(Statista, 2015)
Twitter is currently one of the most important information distribution platforms. This is one of the reasons why the news media channels use Twitter as the principal social network news distributor. This important skill gives a great power of influence to Twitter. How Twitter
14 influenced the Iranian election is a proof of its social power (Ketabchi, Asadpour, & Tabatabaei, 2013). But the Twitter ecosystem has some singularities and challenges to the marketers.
Twitter is based on information propagation with short messages, with a possible high impact on the network. This have a plus and contra on the creation of a campaign, because short messages make information recognition and assimilation easier, but it also requires a big amount of creativity to transmit all the information required, especially if different audiences are involved (Lima, de Castro, & Corchado, 2015). To improve on this limitation, Twitter also allows the diffusion of pictures, external links and videos.
Once a marketing campaign is designed, Twitter has some tools and partners that can help to increase the number of followers and people reached. This tool brings a complete dashboard with all the important metrics on Twitter. All this information describes the characteristic of the followers and the impact of the posts (Twitter, 2015b).
Twitter for business cans be of great help in the case of the campaign propagation. On this platform, companies can create and buy a Twitter propagation channel, like trend topic, promotion of an account or promotion of a Tweet. In all of these types of propagation channels, Twitter cans segment the audience for each campaign and it can sense all the metrics with the business dashboard on real time (Twitter Business, 2015).
The public Twitter accounts allows visibility of the post for everybody, including people without a Twitter account. With this privacy configuration the visibility increase and any Twitter user cans reply the posts. This is the reason why many super stars use this social network as a channel of communication with their fans.
15 Facebook is the social network with the higher number of active user. Facebook is the most popular social network in the world with 1,46 billions of active user. In deep this social network has the biggest digital audience on the social media. In consequence, Facebook is the social media channel with the highest potential for digital marketing campaigns (Ramsaran-Fowdar, (Ramsaran-Fowdar, 2013).
Facebook is the principal reason why the companies are hiring digital social manager. Facebook is part of the new move of digital acceptance. Nowadays the people are spending more time in this social network than the regular marketing channels. In consequence in this social network the companies are allows to connect more people than mail or phone calls. The cost of Facebook as a marketing tool is lower than other channels and it bring a several tools for the analysis of the campaigns. Therefore the companies are using people more connected in their departments (Villamizar, Corredor, 2014).
The creation of Facebook communities is the principal mechanism used for digital marketers to growth the visibility of the brand. On this social network exists three ways to interact with the potential clients. They are the fan pages, group and the profiles. The profile had limitation of 5000 friends, from a marketing point of view it can be a limit of possible audience for a community, therefore the companies or brands use fan pages and groups because they do not have a limit for like or members.
On Facebook the companies had to imply a concept knew as the humanization of the brand. The traditional marketing could not give the feedback from the users .The humanization of the brand is used on Facebook as other social networks, because the digital marketing allows interaction from the possible clients. In deep companies are more concerned on the social networks opinions (Villamizar, Corredor, 2014).
16
2.7. Twitter vs. Facebook marketing
Facebook is the most popular social network in the actual times, but the size of this network does not mean the ultimate solution or the only for a marketing campaign.
Facebook audiences depend of the type of account, that is, whether it is a profile, group or page. Each of these have features that difference one from the other, and the metrics for the audience have different names but in essence they are the same, the number of likes, members or friends are basically the audience, on theory. But the news feed of any user is adapted to the preferences and interaction of the profile. It means that if the person or company does not interact with your brand enough, their posts are less probable appearing on the feeds.
On Twitter, the followers are one of the most important metrics because the greater the number of followers, the bigger the audience. Brands have to be aware of the different types of followers and how they can react about some topics or publications on the social network (Kim, Sung, & Kang, 2014). Because a campaign cans have an impact over the people creating a domino effect and high speed propagation depending on the number of followers of the brand and the number of follower of the followers(Ye & Wu, n.d.). The followers constitute the audience on Twitter and if somebody is the follower of an account, the account holder can be 100% sure that his post appears on his/her news feed.
Twitter users are more aware about who to follow and who not, since the content of the account to follow will appear on the feeds. This means it is harder gain followers on Twitter than Facebook. Twitter users prefer to follow news or famous people that they like, and Facebook is more for social relationship than news or events. The main reason for this behavior is a consequence of the privacy policies in each social network; Facebook is taken as
17 a personal, private social network and Twitter as a public relationship channel (Buccafurri, Lax, Nicolazzo, & Nocera, 2015).
2.8. Elements of a Facebook post
Social networks are based on the interaction of the users. In the case of Facebook the user has many ways to interact each other’s. The post is an interaction where the users publish what they think in the moment about any topic. When a user post on its wall, this post appear on the news feed of its more connected friends. The more connected friends are determining by Facebook through the interaction among users. Other user can interact with a post delivering feedbacks, likes or resharing.
2.8.1. Replies and reactions
The replies are the action when a user answers a post with some feedback. Replies on Facebook can be multimedia (stickers or photos) or plain text. In the case of the Stickers is not allowed the type option. In the case of the photos is possible to write a text with this. Just in the original replies of the post is possible to reply again over these replies, therefore the posts can have replies over replies, and this creates inner conversations (Facebook help center, 2016).
The reactions are a way how the people can share their feelings of a post. Before, the only reaction on Facebook were the likes, likes are used to indicate which fan pages to follow. Nowadays the reaction can measure what are the feelings of the users, because the can say if a post make them feel angry, happy, amazed, love it or like it. This new tool is young in the digital social media but it has a potential to see how positive or negative are the feelings of a campaign on Facebook (Facebook help center, 2016).
18
2.8.2. Tag
The Tag is used by the users when they claim for a user attention. On the post a user can use a tag to gain the attention from a user. Facebook has a limit of 50 tags per post. The tags can be used on a reply or on a photo. The user can edit the tag taking out the full name on Facebook but it is mandatory the first name to be a tag (Facebook help center, 2016).
2.8.3. Share
Share is when a user wants to repost some post from other user. The share makes appear the original post on the wall of the user who shares. In a repost the people can reply and deliver its reaction as a normal post, but the notifications are only for the user who shares. In deep the share can give visibility to a post therefore the repost action can measure the propagation of the information on Facebook (Facebook help center, 2016).
2.9. Elements of a Twitter post
Tweets (or Twitter posts) are structured around five types of information content (Figure 4): Tweet reply, retweet, favorite, hashtag and tag. All of these can be measure and used for different purposes (Twitter, 2015).
2.9.1. The reply and favorite
The reply is the action where the user can answer a tweet. This type of Tweets appears on the news feeds of the followers of the user, but with the tweet replied on the top (Twitter, 2015). The Favorite means the same as the like in Facebook, and but on Twitter the favorite mark can be used as a filter when the user is looking for a Tweet. Both are measures of the interaction of the users with the Tweet content, because the reply means that the user is really interested
19 on your Tweet and it needs to replay a comment for it. In the case of favorite means the user really like the post and positive feelings about the post (Twitter, 2015a).
Figure 3 Atributes of a tweet. 1 Tweet, 2 reply, 3 Retweet, 4 favorite, 5 Hashtag and 6 Tag. (Twitter Business, 2015)
2.9.2. Tag
Tag is used when the user wants to draw some attention from a specific account; in the case of a reply, the tag is mandatory on the conversation. Tag is a mention on Twitter; using this attribute the companies could have some idea about the opinion of the Twitter user about the brand recognition (Twitter, 2015).
2.9.3. Retweet
A Retweet is a fast and easy way to share a Tweet from someone, with this button the information can be propagate faster. With a Retweet the followers of the user can see the original post and who was the author (Twitter, 2015).
20
2.9.4. Hashtag
The Hashtag is a powerful topic indicator. With the hashtag is possible to create trends and raise the appreciated trend topic. The trend topic is the most tweeted topic in a specific geographical area. In other words if a campaign rise the trend topic of a country and this was the geographical target, the campaign was a success on the campaigns; because everybody on the geographical sample will be talking about the trend(Twitter, 2015).
2.10. Digital Social Media Metrics
The metrics social media metrics determine the success of a campaign. Metrics can say how results fit with the expected goals (Kristy,2016).
2.10.1. Reach
The reach is the metric that define the audience of a social media post. Therefore reach can be used to measure the impact and the propagation of a campaign on a social network. In the case of Facebook is the number of people who saw original post in the life time (Smitha, 2013). On Twitter the reach is measured by the number of people mentioning the brand plus the number of followers of the users, this reach is knew as the potential reach because you have a potential population but not the real sample of people that have seen the post (Shively, 2013).
2.10.2. Conversion
The conversion defines how the people or community engage with your brand and your corporative message. It is when user lack of awareness about a brand become in a fully knowledge about the brand (Hanna, Rohm, Crittenden2011).
21 Conversion is one of the most important metrics on digital marketing but the ways to measure the conversion rate of the fan or followers of a brand still under research. Conversion is a qualitative metric, therefore it exists a certain amount of non-quantifiable information. This qualitative information contains sentiments that cans determine the critical effectiveness of a digital channel (Lovett, 2011).
2.10.3. Engagement
The engagement is the correlation of all the variables of interaction combined. This metric use all the variables that the social digital channel can measure, to obtain a magnitude of engagement of a user. This metric differs from the conversion because is a quantitative variable and it could be compute throw the formula in the figure 5. In the case of a social network does not give all the variables, the marketer can use variables provided and tends the other to 1.
= × × × ℎ
Figure 4. Engagement Formula (Lovett, 2011).
Engagement answers the question of how often the user use or interact with the brand or company. Engagement measures how digital marketing influences the users over their skills over the product, it means if a user increase its engagement over a campaign the campaign is the influencer over the users, but the drivers of the influences are not provided by this metric (Helsper, Eynon, 2013).
22
2.11. Conclusions
IoT campaign is currently more focused on the performance of a product for the user. But it is also possible to create IoT objects that can increase audience interactions with a brand, and hence brand engagement.
Twitter is an online social network with a high power of propagation of the information, but with some limitation of the amount of information delivered. It has a high propagation as a consequence of the use of hashtag and the tagging. Both Twitter attributes simplify the topic filtering and the engagement of user on conversation (Twitter, 2015). The small amount information per an IoT object without a high power in processing can be created.
The simplicity of the social network and the average privacy policy used in this virtual world change the behavior of the users (Buccafurri, Lax, Nicolazzo, & Nocera, 2015), creating a specific profile in the Twitter constraint.
Based on this the following research Hypothesis are proposed
H1: A Twitter campaign based on Internet of things can generate better results than the traditional digital campaigns
H2: Internet of Thing can be an incentive of interactions for a Digital community H3: The use of Internet of Thing can generate interactions without an economical
23
CHAPTER 3: METHODOLOGY
3.1 Introduction
This section describes the methodology used for conducting the research and the campaign development as well as the procedures involved in it. The social network chosen is described, as well as tools used for data collection and analysis.
3.2 Research Approach and Design
To be able to confirm or repute a research hypothesis, the use of quasi-experimental research is required. The experimental research is the use of two (2) samples. One is the control another is the experimental sample and compares the impact of the change in the environment of the sample with the control sample. To compare the samples is necessary the observation and the sense of the all possible variables that can give a view about the changes (Ross & Morrison, n.d.). In the case of the campaign it was use a quasi-experimental approach because the over the same sample was applied the two type of campaign to see changes on the behavior.
The methodology start with the recollection of Tweets from all twitter with specific keywords and start to analyze what they say about the actual digital marketing tools and how the network of user interact with these. After the first exploratory analysis of the data, It was introduced the IoT part and see how the variables start to change, especially in the vans followers population.
24 Figure 5. Research Methodology
3.3 Population and sampling
The studied population was the Van digital community on twitter and Facebook, and over this community will be measure the interaction with the 2 campaign.
If it supposed the interaction of the people using the keywords as a behavior, it cans be measured these in two ways as events or states. In an event is taken just in the moment when the action or behavior happens and in the state method sample it measured all the action itself from the beginning until the end. It means a long period of observation (Altmann, 1974). The
25 sampling method was done in a cyclical period of time of 30 seconds where the software asked to the Twitter API for the last 100 tweets that contains the keywords sensed, in this request was asked the events when the people were sharing the keywords in public tweets, but it was not taken in to account the what happen with the Tweet after sensed.
3.4 Data collection
To see the behavior of the experiment, it was necessary the creation of a campaign using a Twitter and a Facebook account of vans, wherethe name of the brand was the product and the followers of the account werethe sample to start to test the theory, and see how the behavior of the followers change with the introduction of the IoT and how the people out of the sample start to interact with the object.
The IoT campaign was developed with the principal idea of interactive social object, which catches the information of the network and change something in the real world. The object used was a replica of a Volkswagen Kombi model 1953 Van (Volkswagen Transporter line T1). The van is the logo of the company, and part of the decoration of it thing. The replica changed the color of the windows lights as the real word interaction. The information caught was HashTags (See Table 1), each of them mean a color, and the rate for the change was thirty seconds from the moment when the Tweet was caught for the Twitter API. As other incentive the system post the winners of the last 30 Minutes on a Twitter account created for this proposal. The tag of the account was @VanIotMkrt. The tag has the name of van and the IoT recognition inside. HashTag Color Yellow Light Blue Red Green Blue # van_live_streaming # van_mobile_advertising # van_sna # van_iot_social_media # van_content_marketing
26 Before the launching of the campaign on Twitter, Van Marketing Digital catch the attention from Facebook on it official fan page sharing and posting on It Twitter Account, and at the end try to give to attract the attention of the followers of the brand. The posts were about the different lines of digital marketing to see the opinions, and define the keywords for the IoT campaign.
Addressing the first hypothesis was measured the reach on Facebook and Twitter for the preview campaigns and the campaign based on IoT. The case of Facebook was used the Facebook analytics tool on the post of the Van Marketing fan page and in the case of Twitter was compute the potential reach for the preview and the IoT campaign. The potential reach were computed seeing the number of unique followers of the both campaigns plus the number of users than participate. With the results of both campaign is possible to contrast which one generate better results for a digital marketing point of view.
27 Figure 7. Twitter post from the Preview campaign.
For the second hypothesis was sensed interaction of the digital community of Van on Twitter and Facebook. Van as a digital marketing company already develop a Facebook up to 6 thousand of users, in the case of Twitter the account had 16 followers. Van marketing emphasizes its effort on the Facebook community; this is the reason why the campaign also has a part on Facebook.
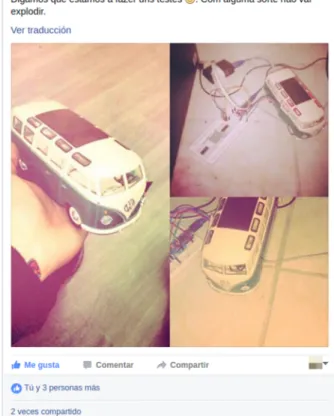
The launching on Facebook with a post showing the Van and the circuit developed for the changes of the colors (Figure 8). In the launching of the campaign were post the van and the LiveStreaming link with photos of the different colors of the van (Figure 9). The launching was made on Facebook, because the community of Van on Facebook is bigger than the Twitter community.
The campaign did not use the Twitter for business platform. The decision was taken for the reduction of the investment and the use of the IoT as the only incentive for the users. This addresses the third hypothesis and made a more reliable measure of the IoT influence on the digital campaign.
28 Figure 8. Post before the campaign launching.
29
3.5 Data with t-student test Analysis
To have a statistical Analysis on the data obtained by Facebook analytics results, it was applied a two tail t-student or paired t-student comparison. The two tail t-student test can determine the difference on the results taking out any random implications. In the case of the two tails analysis is determined two tails range (positive and negative) for the test. The tails range determines the area the possible result of the test. If the result is out of the range the averages can be consider different, for a 0 difference between the averages. In the case of relevance of the data it is necessary the computation of the probability on the t-test, this probability is compare with the risk of mistake (or α). If the probability computed is lower than the risk, it exist a relevant different on the samples (Ahsanullah, Kibria, & Shakil, 2014). This analysis was applied to determine de difference among averages of the two Facebook campaigns, because the IoT object was introduced on the same population to see the impact. In the case of the Twitter results, the results of the two campaigns were different to apply some statistical test. In the case of the preview campaign, VAN marketing digital post Tweets to see how the people interact with the post. In the case of IoT campaign, people post Tweets to change the colour of IoT Van’s windows. It means different type of interaction and behaviour from the users. Under this limitation is possible to see a higher impact of the IoT campaign taking the potential reach as the measure.
30
CHAPTER 4: RESULTS AND DISCUSSION
In this chapter is discussed the data and the analyses of the social media campaign.
4.1. Preview data collection
The principal market of Van Company is the digital marketing and being on the trends of the digital marketing is one of its goals. Taking advantages from the Twitter global influence, it were measured all Twitter using the keywords (Table 2) from the marketing digital.
Table 2. Keywords of Digital Marketing
The keywords on the table 1 were sensed 24 hours in five days and the goal was to see how the Tweet rate per hour changes over the day. Some of the keywords were composed words and on Twitter sometimes for the limit of character, the users say the words without spaces. Because of that it was sensed the words in both cases with and without spaces. With this information it cans be possible to see what type of topics are more relevant in marketing and what time is the best to try to attract the attention globally. Taking the sample of the five (5) days was averaged per hour to analyses how the European time is relevant.
Keywords of Social Marketing Social Media Analytics Content Marketing Mobile Advertising Live Streaming IoT Social Networks Big Data
31 Totals Average Mobile Advertising Content Marketing Big Data IoT Live Streaming
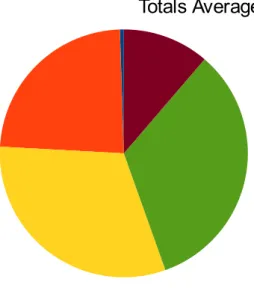
Figure 10. Distribution of keywords.
In the figure 8 is possible to understand in what was the proportion over the total of Tweets for each word. IoT with 33,26%, Big Data with 31,30% and Content Marketing with 23,64% were the most posted words under these 5 days. Also the figure 8 show the live streaming 11,29% still be an important part over the total and mobile advertising with a 0,51% is less important nowadays.
The most trending words on the future of the marketing were also the words where the researchers still look for the answers and the different aspects where these advantages will interact in the society. The biggest parts were for IoT, Big Data and Content Marketing. Seeing the amount of Tweets the IoT was the winner but Content Marketing was more related with the Marketing. For the case of big data and the Internet of things the mentions on the network they are not only about the marketing perspective, for example on the Tweets of IoT, it was found objects some tweets from objects instead of people.
32 4.2. Preview Campaign
On Twitter van posted 8 Tweets on its Twitter account where 4 were about the preview campaign about topics of social media. This posts were not any interaction, mean than the potential reach were the number of followers (sixty) of vans plus the Twitter Van Account. This reach was the same for each post than the total reach of the campaign, because the number of unique followers was the same for both.
4.3. Twitter IoT Campaign
The IoT campaign where launched over the night of 03 of march and the last post was register on the evening of 09 of march mean almost six day of campaign. On Twitter the campaign obtains one hundred and fifty (155) Tweets during the campaign with 43 users. From these one hundred and fifty tweets, only one hundred and twenty four (124) were taken as real Tweet by the campaign (Anexe 1), because the other 31 posts were Retweets by some accounts from post results of the account of the system of the campaign each thirty min. They were discarded because they probably can be bots on twitter on the labor of catch more followers.
The majority of real Tweets were for #van_content_marketing with a 44 posts followed by #van_live_Streaming with 24 Tweets and #van_sna with 22 Tweets. #van_iot_social_media obtains 20 Tweets and 18 tweets contain #van_mobile_advertising (Anexe 1).
The 155 Tweets posted on the campaign obtain a potential reach of the campaign was 70.780 (Anexe 1) taken into the computation all the users including the bots. Bots accounts are created to reach an important number of followers, this number of followers cans be an important potential audience. The influence of the bots over the potential reach is visible on the hashtag #van_iot_social_media. #van_iot_social_media obtain a reach of 5212 (Anexe 1) almost 11 times less than the other hashtags.
33 Figure 11. Tweet of results of the campaign from VanIotMrkt
The reason why this hashtag obtain a smaller reach was the character limit of Twitter and the behavior of the bots. As it was said bots on the campaign repost the Tweets from the bot created for the IoT, theses Tweets were 4 characters under the limit of 140 characters. The bot exceeded the limit of characters because they concatenated the characters “RT” (means Retweet on the Twitter language) with the IoT Twitter account name and the original Tweet. As a solution of this the bots split the original Tweet until the character necessary for the limit of characters. In the case of VanIotMrkt the last characters were the hashtag #van_ios_social_media.
The number of unique and real user involved on the campaign was 37, from this 2 Van Twitter followers Tweet on the campaign and 1 of the users were an account followed by the Van Twitter account. These 3 users may have an incentive out of Twitter to be involved on the IoT contest.
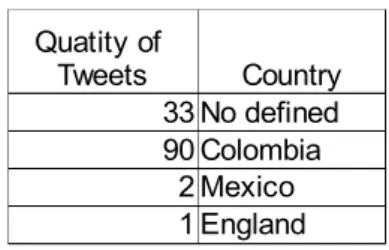
Table 3 Quantity of tweets by Country. Country 33 No defined 90 Colombia 2 Mexico 1 England Quatity of Tweets
34 The number of no defined by country Tweets were thirty-three (33) Tweets. It is the 26,2% over the total. No defined Country means than this Twitter accounts does not have registered on any country, this imply no veracity over the information mean than the geographical segmentation could not be easy verify. Under this statement prove the influence of the campaign on the Portuguese population was more difficult. Because some Portuguese Twitter accounts involver on the campaign changes their location to other countries to see other languages and trends on their News Feed or in some cases their prefer does not provide this information to Twitter.
4.4. Results from Facebook
The use of Van fan pages generates other results to analysis in the case of the influence of IoT for marketing perspectives. This data was provided van Van in the use of Facebook analyzer.
Post Name reach Clicks
C1 1011 4 42 C2 646 3 26 C3 298 3 9 C4 413 3 14 C5 303 1 4 C6 4135 75 229 reactions, comments, shares
Table 4. Results on Facebook of the IoT campaign after the close of the campaign. A summary of the Facebook results taken from the Facebook analyzer of Van Marketing Digital is showed on the Table 4. The results where taken a week after the conclusion of the campaign. The post name from C1 to C5 was the posts before the IoT campaign and the C6 correspond to the IoT campaign post. The IoT campaign had a reach the four times bigger than the highest number for the previews campaign. Therefore the IoT campaign on Facebook influences the Twitter campaign.
35 The IoT campaign obtains a higher result compare with the preview campaign and the campaigns on the same period of time in 2014. The data analyzed at this point was taken one month after the closing of the campaign. The influence of IoT over the Digital community of Van from Facebook is visible on the results obtained by the Facebook Analizer.
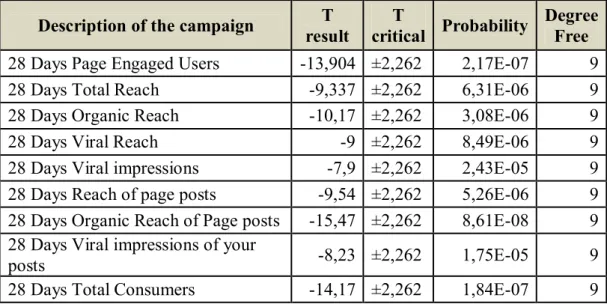
Over this different type of reaches was applied the Student comparison analysis to see the statistical implication of the results of the IoT campaign compare with the preview campaign. Reach results were provided by the Facebook Analizer Tool of Vans. This analysis was applied because the results from the Facebook analyzer are an approach of the real results of the campaign, mean than the real variance and average are unknown. The results were compute using a risk of 5% and free degrees of N-2 (N is the count of the samples) where the total number of samples was 11. The tail result for all the samples were 1.83 and -1.83 because the size of samples analyzed was the same.
Description of the campaign T result
T
critical Probability
Degree Free
28 Days Page Engaged Users -13,904 ±2,262 2,17E-07 9
28 Days Total Reach -9,337 ±2,262 6,31E-06 9
28 Days Organic Reach -10,17 ±2,262 3,08E-06 9
28 Days Viral Reach -9 ±2,262 8,49E-06 9
28 Days Viral impressions -7,9 ±2,262 2,43E-05 9
28 Days Reach of page posts -9,54 ±2,262 5,26E-06 9
28 Days Organic Reach of Page posts -15,47 ±2,262 8,61E-08 9 28 Days Viral impressions of your
posts -8,23 ±2,262 1,75E-05 9
28 Days Total Consumers -14,17 ±2,262 1,84E-07 9
Table 5. Results of t-student analysis on the different variables on Facebook.
The IoT campaign and the preview campaign obtain a totally different result from a statistical point of view. All the 28 day reach analyzed on the table show a T results out of the range. All of the T results were higher than the critical T value for two tail analysis, and the probability were lower than 0.05, hence it exits a difference among the data collected and this difference is relevant from an statistical perspective. On the research perspective increase on the results
36 of the IoT campaign are not related with the preview campaign mean than they were not affected by other variables on the environment. This result could explain the growth in the results from the preview campaign to the IoT campaign was not part of the random or noise data. Therefore the influence of IoT under the van Facebook community is visible on the relevant difference on the data.
IoT campaign’s results were no only good for expansion of the Van Facebook community in one year. The community of Van grew 6 times from March of 2015 to March of 2016. It was applied a Pearson correlation Analysis over the same week in the two years. This analysis obtained a positive correlation of 0.9987 between Total reaches and the population (or the fan pages like number) without the IoT campaign data. Once the IoT results are included on the Analysis the Pearson variable decreases to 0.7508. The decrease of the Pearson correlation variable indicates that the IoT results were not influenced by the population size of the Van Community.
37
CHAPTER 5: CONCLUSIONS AND LIMITATIONS
The synergy among the social networks can be used to improve the interaction from one to other. The Internet of Thing was influencer on the campaign, but other influence remain was the attraction of the Facebook user to Twitter and in the other way around. The preview campaign promoted Facebook users to interact with the object via Twitter. On Twitter the user saw the post from other and went to Facebook like an exchange of information among the social networks.
The API of Twitter cans be used to see what the trends in different areas of the knowledge are. Twitter is a social network where the people interact with others, but it has more power because the amount of people sharing information on public post is bigger and easier to analyses than Facebook. The limit of 140 characters and the uses of the Hashtags can simplify the labor of filter the content to see the global trends on a specific topic.
The IoT cans improve the results of a social media campaign. The IoT campaign started on Facebook as a normal campaign where the user ignore final goal. At the moment when the object connected to Internet was introduced, the fan page powered the reach and the interactions. The only difference among the posts was the IoT incentive; it proves the potential of this new technological concept on a marketing view.
The use of IoT for marketing purposes can increase the viral potential of a campaign. As a result obtained from the t-student analysis over the Facebook Analyzer data in the case of viral reach the preview campaign obtain the same results of the campaign from 2014 in the same period in averages, when IoT was introduced in the campaign the viral reach raise a peak. It means than IoT were the influencer over this results.
38 The IoT can increase the interaction of a social community. Van Facebook community is stronger than its Twitter community reflected on the potential audience for the two social communities in the case of Twitter the number of followers was seventeen for the Van Twitter account and the Van fan page has six thousand likes. On the Twitter results the number of account creating Tweets were three times the number of followers with on average of 2 Tweets per users, mean than the users were incentivized by Internet of Things to interact with Van.
Internet of thing is one of the new concepts in technology with broad new possibilities but the maturity as a global trend is not reached and the ways to catch all value. Although large technology corporations have embraced the term and are clear that this is the way for analyzing real information generated by the user via among devices. The total adoption of technology just could be achieved in the order of the companies or people realize the potential of Internet of Thing on different fields.
39 REFERENCES
Altmann, J. (1974). Observational study of behavior: sampling methods. Behaviour, 49(3), 227–266.
Ahsanullah, M., Kibria, B. G., & Shakil, M. (2014). Normal and Student's T Distributions and Their Applications. Paris: Atlantis Press.
Ashton, K. (2009). That “Internet of Things” Thing. RFiD Journal, 4986. Retrieved from http://www.itrco.jp/libraries/RFIDjournal-That Internet of Things
Thing.pdf\npapers3://publication/uuid/8191C095-0D90-4A17-86B0-550F2F2A6745
Atzori, L., Iera, A., Morabito, G., & Nitti, M. (2012). The Social Internet of Things (SIoT) – When social networks meet the Internet of Things: Concept, architecture and network characterization. Computer Networks, 56(16), 3594–3608.
http://doi.org/10.1016/j.comnet.2012.07.010
Bakshy, E., Hofman, J., Mason, W., & Watts, D. (2011). Everyone’s an influencer: quantifying influence on twitter. Proceedings of the Fourth ACM International Conference on Web Search and Data Mining SE - WSDM ’11, 65–74. http://doi.org/doi:
10.1145/1935826.1935845
Bergman, S. M., Fearrington, M. E., Davenport, S. W., & Bergman, J. Z. (2011). Millennials, narcissism, and social networking: What narcissists do on social networking sites and why. Personality and Individual Differences, 50(5), 706–711.
http://doi.org/10.1016/j.paid.2010.12.022
Boyd, D., & Ellison, N. (2010). Social network sites: definition, history, and scholarship. IEEE Engineering Management Review, 3(38), 16-31.
40 Buccafurri, F., Lax, G., Nicolazzo, S., & Nocera, A. (2015). Comparing Twitter and Facebook
user behavior: Privacy and other aspects. Computers in Human Behavior, 52, 87–95. http://doi.org/10.1016/j.chb.2015.05.045
Buckman, A. (2015). How the Internet of Things is already the future of advertising. Retrieved from http://www.marketingmagazine.co.uk/article/1352048/internet-things-already-future-advertising
Bughin, J., Chui, M., & Manyika, J. (2010). Clouds, big data, and smart assets: Ten tech-enabled business trends to watch. McKinsey Quarterly, 75–86.
http://doi.org/10.1109/MC.2012.358
Counts, S., & Fisher, K. E. (2010). Mobile social networking as information ground: A case study. Library & Information Science Research, 32(2), 98–115.
http://doi.org/10.1016/j.lisr.2009.10.003
Cretu, A. E., & Brodie, R. J. (2007). The influence of brand image and company reputation where manufacturers market to small firms: A customer value perspective. Industrial Marketing Management, 36(2), 230–240. http://doi.org/10.1016/j.indmarman.2005.08.013
Devin Kowalczyk. (2010). Purposes of Research: Exploratory, Descriptive & Explanatory. Retrieved from http://study.com/academy/lesson/purposes-of-research-exploratory-descriptive-explanatory.html#lesson
Edelman, D., & Salsberg, B. (2010). Beyond paid media: Marketing’s new vocabulary. McKinsey Quarterly, 1-8.
Explorable.com. (2009). Research population. Retrieved from https://explorable.com/research-population
Facebook Help Center. (2016). Facebook Help Center. Retrieved from https://www.facebook.com/help
41 Gifford, D. K. (1998). Digital active advertising. USA: Google Patents. Retrieved from
https://www.google.com/patents/US5724424
Gruber, H., & Verboven, F. (2001). The diffusion of mobile telecommunications services in the European Union. European Economic Review, 45(3), 577–588.
http://doi.org/10.1016/S0014-2921(00)00068-4
Guo, B., Zhang, D., Wang, Z., Yu, Z., & Zhou, X. (2013). Opportunistic IoT: Exploring the harmonious interaction between human and the internet of things. Journal of Network and Computer Applications, 36(6), 1531–1539. http://doi.org/10.1016/j.jnca.2012.12.028
Hanna, R., Rohm, A., & Crittenden, V. L. (2011). We’re all connected: The power of the social media ecosystem. Business Horizons, 54(3), 265–273.
doi:10.1016/j.bushor.2011.01.007
Helsper, E., & Eynon, R. (2013). Pathways to Digital Literacy and Engagement. European Journal of Communication, 28(6), 1–25. Retrieved from http://eprints.lse.ac.uk
Jara, A. J., Parra, M. C., & Skarmeta, A. F. (2014). Participative marketing: Extending social media marketing through the identification and interaction capabilities from the Internet of things. Personal and Ubiquitous Computing, 18(4), 997–1011.
http://doi.org/10.1007/s00779-013-0714-7
Ketabchi, K., Asadpour, M., & Tabatabaei, S. A. (2013). Mutual Influence of Twitter and Postelection Events of Iranian Presidential Election. Procedia - Social and Behavioral Sciences, 100, 40–56. http://doi.org/10.1016/j.sbspro.2013.10.698
Kim, E., Sung, Y., & Kang, H. (2014). Brand followers’ retweeting behavior on Twitter: How brand relationships influence brand electronic word-of-mouth. Computers in Human Behavior, 37, 18–25. http://doi.org/10.1016/j.chb.2014.04.020
42 Kingman, R. (2015). IoT And The Rise Of Subscription Marketing. Retrieved from
http://techcrunch.com/2015/08/27/iot-and-the-rise-of-subscription-marketing/ Kristy Bolsinger, M. S. (2016). Social Media Metrics and ROI. Retrieved from https://moz.com/beginners-guide-to-social-media/metrics-and-roi
Kwak, H., Lee, C., Park, H., & Moon, S. (2010). What is Twitter, a Social Network or a News Media? Proceedings of the 19th International Conference on World Wide Web, 591–600. Liao, X., Jin, H., Liu, Y., Ni, L. M., Deng, D., Bay, C. W., & Kong, H. (2006). AnySee: Peer-to-Peer Live Streaming, 00(c).
Lima, A. C. E. S., de Castro, L. N., & Corchado, J. M. (2015). A polarity analysis framework for Twitter messages. Applied Mathematics and Computation, 270, 756–767.
http://doi.org/10.1016/j.amc.2015.08.059
List, D. (2003). Participative marketing for local radio. Participative Marketing. Mangold, W. G., & Smith, K. T. (2012). Selling to Millennials with online reviews. Business Horizons, 55(2), 141–153. http://doi.org/10.1016/j.bushor.2011.11.001
Lovett, J. (2011). Social media metrics secrets (Vol. 159). John Wiley & Sons.
MANTILLA, M. C. G., ARIZA, L. L. C., & DELGADO, B. M. (2014). Metodología para el desarrollo de aplicaciones móviles. Tecnura, 18(40), 20–35. Retrieved from
http://www.scielo.org.co/pdf/tecn/v18n40/v18n40a03.pdf
McAfee, A., & Brynjolfsson, E. (2012). Big data: the management revolution. Harvard Business Review, 90(10). http://doi.org/10.1007/s12599-013-0249-5
Parsons, A., Zeisser, M., & Waitman, R. (1998). Organizing today for the digital marketing of tomorrow. Journal of Interactive Marketing, 12(1), 31–46.