Is it possible to use “twin cores” as a unique sedimentary
record? An experimental design based on sediment color
C. Veiga-Pires1, N. C. Mestre2
1 Universidade do Algarve, CIMA Research Centre, Campus de Gambelas, 8005-139 Faro, Portugal
2 School of Ocean and Earth Science, National Oceanography Centre, Southampton, University of Southampton, European Way, Southampton, S014 3ZH, UK
E-mail: [email protected]
Abstract. Sedimentary cores are widely used for studying Quaternary records. However, the amount of sediment that is available is proportional to the diameter of the core, which is rarely bigger than 15 cm. One way to obtain more sediment is to use two cores retrieved from almost the same location and use them as if they represent a unique sedimentary record. In the present work, an experimental design has been applied to verify if “twin cores” from an estuary can be considered as representing the same sedimentary record with twice the amount of sediment to study. Because sediment can be characterized based on its color, the variables used as replicates in the experimental design are the three Lab CIE colors acquired with a X-Rite Colortron spectrophotometer. Sediment cores were retrieved from the upper saltmarsh of Gilão River’s estuary, southern Portugal. Twin cores, with in between distances of 50 cm, 100 cm and 200 cm, from two different sites were analysed. Results from a nested ANOVA show that even for the closest twin cores (50 cm apart) there is at least one color variable that shows significant variations between the profiles of both cores. These results clearly show that “twin cores” cannot be used as a unique sedimentary record without any previous testing, at least in such transitional regions.
1. Introduction
The study of sedimentary cores allows the reconstruction of the environmental history of marine e.g. [1], transitional e.g. [2] and continental regions e.g. [3]. Most of the coring apparatus available have restricted diameter dimensions (3 to max 20 cm) [4], limiting the quantity of sediment representative of one deposition layer or age interval. In such conditions, it is very difficult to perform all the required or suitable analyses as most of them imply the destruction of the scarce amount of sediment available per time interval. Therefore, there is the temptation to use a “twin core” in order to get more sediment per time interval and complete the series of analyses on the “equivalent” sediment record. This is mostly true in study areas such as transitional zones, namely estuaries, where it is easy to get the “twin cores” done almost exactly in the same place with no additional cost. In this context, the present work aims to verify the possibility of using such “twin cores” for analytical purposes as if they were a unique sedimentary record.
In order to answer this question, an experimental design has been set up based on the color of the sediment because it is one of the sediment characteristics considered to represent an integrated signal
of the sediment composition and commonly used for stratigraphic or correlation purposes [5]. Moreover, the digital color, which can be acquired with a spectrophotometer through non destructive manipulation, gives quantitative information on the color and is used to describe the sediment as well as to document changes in depositional conditions [6]. It is also important to refer that the acquisition of digital color is an affordable and non-destructive analysis that allows further investigation on the sediment afterwards. On such basis, the digital color of the sediment is the parameter considered in the present study as the indicator for similarity between the “twin cores”.
2. Material and methods
In order to determine the possibility of replication of cores for sampling and sub-sampling, an experimental design was elaborated previously to the sampling of the sedimentary cores. By definition, the experimental design is developed to outline the way in which the experiment, namely the sampling, should be carried out in order to obtain data that will answer the scientific question by means of statistical values.
2.1. Experimental design
The present work aims to determine whether “twin cores” (or paired cores) can be treated as duplicate records to increase the sample volume collected in the field. To answer this question it is important to obtain statistically significant results, meaning that the effect of the distance between cores has to be evaluated statistically, that the observed pattern is not due to random or to site specific conditions. In order to address all these questions, the experiment has been designed considering the following null hypothesis: “The color is the same for each depth of each core from one site no matter the distance between the cores” in order to find out how far can two cores be collected and be used as “twin cores”. If the null hypothesis is true, (i.e. p-value not significant) then “twin cores” can be used as a unique record, if null hypothesis is not true (i.e. p-value significant) then alternative hypothesis is verified. The alternative hypothesis is “The color profiles are different between cores “.
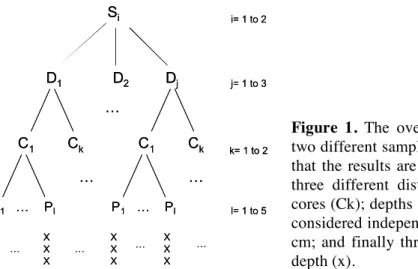
The experimental design based on the above questions contains several levels (factors): 1) the site sampling, 2) the distances between “twin cores” that are reproduced in each site, 3) the two cores sampled for each distance at each site, 4) the depth sampling in each core, and 5) the replicates of the data acquisition at each depth (figure 1, table 1).
Si D1 D2 Dj C1 Ck P1 … Pl X X X X X X i= 1 to 2 j= 1 to 3 k= 1 to 2 l= 1 to 5 C1 Ck P1 … Pl X X X X X X … … … … … … … Si D1 D2 Dj C1 Ck P1 … Pl X X X X X X i= 1 to 2 j= 1 to 3 k= 1 to 2 l= 1 to 5 C1 Ck P1 … Pl X X X X X X … … … … … … …
Figure 1. The overall design consists in having two different sampling sites (Si) in order to verify that the results are not just due to a specific site; three different distances (Dj) between the twin cores (Ck); depths (Pl) in each core, which can be considered independent if separated by at least 20 cm; and finally three replicates of colour at each depth (x).
This experimental design is therefore considered as hierarchical, or nested, and deals with the interaction that could exist between the distances between cores and the sampling site. In other words, this experiment should allow comparing the variations between sites as well as within site, and
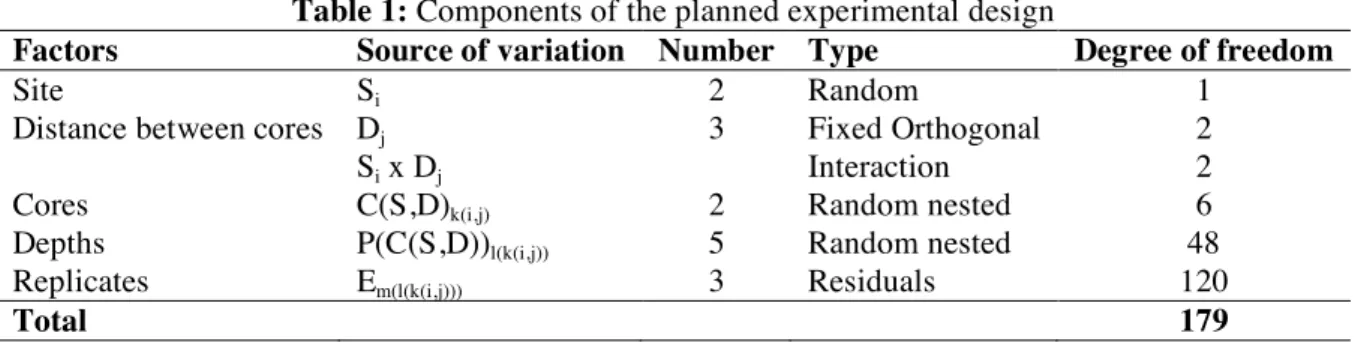
between cores as well as within cores, with a statistical value for significance. The number of variables for each factor, and therefore the degrees of freedom, have been set in order to optimize the statistics [7] as describe in table 1, for a total degree of freedom of 179.
Table 1: Components of the planned experimental design
Factors Source of variation Number Type Degree of freedom
Site Si 2 Random 1
Distance between cores Dj 3 Fixed Orthogonal 2
Si x Dj Interaction 2
Cores C(S,D)k(i,j) 2 Random nested 6
Depths P(C(S,D))l(k(i,j)) 5 Random nested 48
Replicates Em(l(k(i,j))) 3 Residuals 120
Total 179
2.2. Sampling
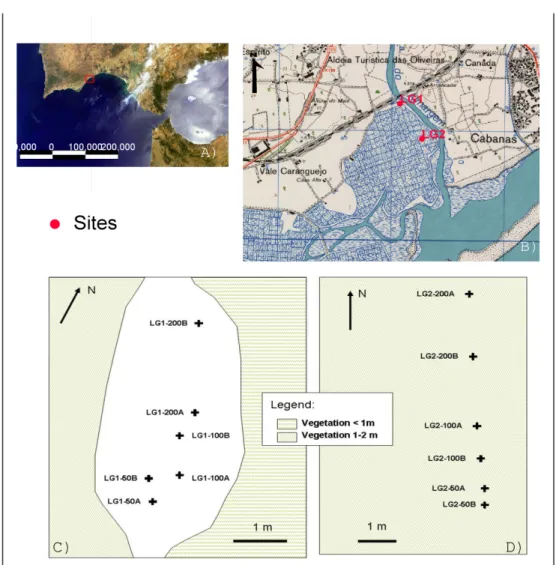
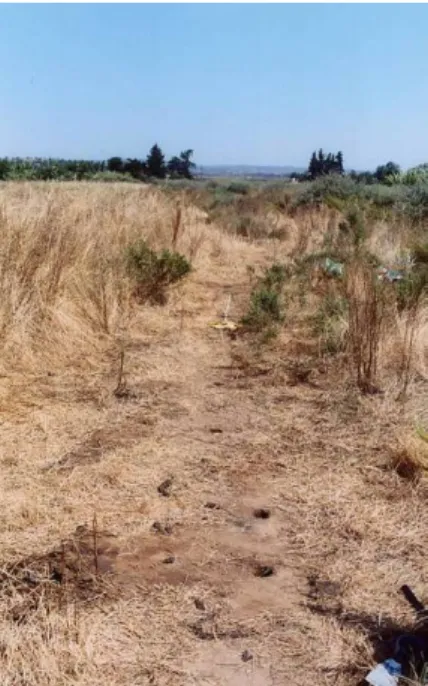
The sampling site chosen for the present study is a saltmarsh area (37º 11’ N, 07º 27’ W) located in the Gilão River estuary, near Tavira’s town, South Portugal (figure 2). Sampling was carried out with a half-cane hand corer (figure 3) allowing the retrieval of sediment records of up to 3.15 meters deep, in sections of 1 m long and 3 cm in diameter, from the upper marsh of the Gilão River estuary (figure 4). Noteworthy is the fact that sampling occurred during summer, sampling sites being very dry as can be observed in figure 4. The recovered sediments were mainly constituted by very fine to medium silt, with almost homogeneous granulometry along the core, but generally two different color sections from top to bottom. Due to highly dense root development, the top sediment was rarely recovered. Moreover, none of the cores reached the water table level implying that no drastic moisture change along the cores was observed. Sediment was then transferred to rectangular tubes used in electrical assembly in order to be transported in the same day to the laboratory. On arrival in the laboratory, the three color replicates were immediately acquired for each core using the spectrophotometer X-Rite Colortron™. The success of this sampling phase was decisive to confirm the statistical model to be used for the analysis of variance (section 2.3).
Figure 2. A) Satellite view of the Iberian Peninsula with the location of the area of the Almargem-Gilão river estuary; B) Close up of the region topographic map with the location of the two sites used in the present study that are ~400 m apart: LG1 and LG2; C) and D) Oriented schemes of the two sites and the cores retrieved in each one of them, for site LG1 and LG2 respectively.
Accordingly, several methodological tests have been realized, prior to the present work, for optimizing the color data acquisition and its reproducibility. The resulting protocol consist in covering the surface of the core with transparent 5 cm large scotch tape to insure that there is no contamination by the spectrophotometer and that the sediment is not oxidized. The spectrophotometer X-Rite Colortron™ was calibrated prior to analyzing each data series, using a 100 % reflectance pure white, followed by a 0 % reflectance black box, and finally by 6 colors’ target [8]. The 3D color space chosen for the present work was the Commission Internationale de l’Éclairage (CIE) Lab , where L values represent the brightness (0 to 300), a values represent the color on the red-green axis (-300 to +300) and b values represent the color on the yellow-blue axis (-300 to + 300) [8].Each of the color components Lab are treated separately in the experimental design statistics.
Figure 3. Half-cane hand corer apparatus which has a diameter of ca 3 cm.
Figure 4. Picture showing the remained holes after collecting the sedimentary cores at one of the two sites (LG1). Note that the second site was chosen to have similar environmental conditions, for instance vegetation.
2.3. Statistics
The statistical model for the analysis of variance (ANOVA) of the present experimental design is a nested linear model that can be expressed as follows:
Xijklm = µ + Si + Dj + C(S,D)k(i,j) + P(C(S,D))l(k(i,j)) + Em(l(k(i,j))) (cf table 1 for details) (1) H0: µ = µ1
=
…= µnHA: µ ≠ µ1 ≠…≠ µn
Where Xijklm is the mean of values (namely CIE L values, or CIE a values, or CIE b values), µ is the variance, Si is the variation effect related to sites (i= 1 to 2), Dj is the variation effect related to distance (j= 1 to 3), C(S,D)k(i,j) is the variation effect related to cores (k= 1 to 2), P(C(S,D))l(k(i,j)) is the variation effect related to depth (l= 1 to 5) and Em(l(k(i,j))) are the residuals due to replication (m = 3).
The null hypothesis (H0) implies that the color of the sediment (and therefore its composition) is the same for each depth of each core no matter the distance between cores and/or the site location. The alternative hypothesis (Ha) implies that there are differences in the color between depths, which is expected, and/or between cores at different distances. If the latter is verified for any of the three distances between cores, then there are no so called “twin cores”.
Statistics have been computed under R program [9] using the linear model of equation 2.1 in “aov” function1 [10]. Since the cores did not have the same recuperation length and color data were acquired every 5 cm along the depth (figure 5), color data had to be filtered in order to obtain a homogeneous matrix, i.e., with no row with empty cell [11]. In consequence, only five common depths of color data were comparable for all the cores. The resultant matrix is built on 5 sediment depths that are 20 cm
1 aov (Color ~ factor(Site) + factor(Distance) + factor(Distance)*factor(Site) +
apart, for which independency have been verified through the lack of autocorrelation even if the sample number is reduced (not shown here), starting at 1.55 m and ending at 2.35 m deep, forming a balanced dataset with no missing cells [12].
3. Results and discussion
The results of the analysis of variance for the three color parameters of the color space CIE Lab are expressed in table 2. Significant statistical differences were found for all sources of variation in the model with p-values <0.001 (***), except for the interaction between site and distance for the reflectance (CIE L) with a p-value =0.001 (**; table 2). Not shown here is the distribution of residuals and standardized residuals that show no heterogeneity [13]. Therefore, the results imply that the null hypothesis can be rejected and that there is a difference in the three color components between the cores taken at distances of 200 cm, 100 cm or even 50 cm apart. The fact that there are significant differences between depths (figure 5) is coherent since those differences are used to document the sediment history [14] . It was also expected to obtain significant differences between sites since they are 400 m apart and an estuarine environment is very complex with a variety of different depositional features such as channels and sand banks that change laterally over decimetric scale [15].
The differences in the depth profiles of each color parameter between cores at both sites (figure 5) clearly illustrate the statistical results (table 2). Note that depth profiles between cores A & B do not show any significant mismatch (cross-correlation significant at lag= 0, not shown here). The reflectance profiles (CIE L) show almost no overlap for both distances between cores, 50 cm (figure 5A) and 200 cm (figure 5B), at both sites (LG1 and LG2). Although, it is also interesting to note that the deepest part of the CIE L profiles of the two cores, 50 cm apart, from site LG2 (figure 5A) fits perfectly and could partially be interpreted as a “twin record”. This observation is important because it could open the possibility to find “twin records” as punctual and exceptional cases but not as a rule. The CIE L variable, also known as reflectance, is believed to be linked either to the water content of the sediment [16], its grain size [17], or even its carbonate or silica content [18].
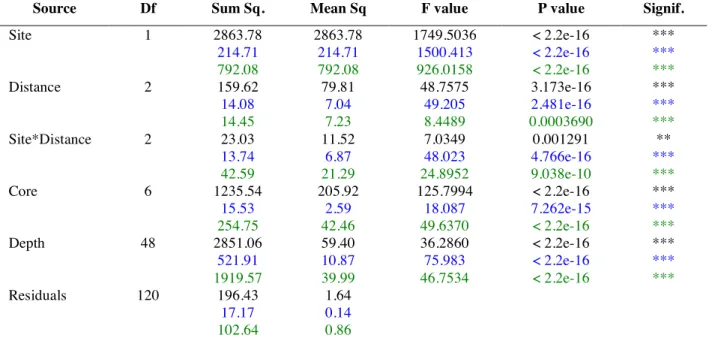
Table 2: Results from the analysis of variance based on the linear model from equation 1 for each of the three color parameters. Df : Degree of freedom, Sum Sq.: Sum squared, Mean Sq.: Mean squared
Source Df Sum Sq. Mean Sq F value P value Signif.
Site 1 2863.78 214.71 792.08 2863.78 214.71 792.08 1749.5036 1500.413 926.0158 < 2.2e-16 < 2.2e-16 < 2.2e-16 *** *** *** Distance 2 159.62 14.08 14.45 79.81 7.04 7.23 48.7575 49.205 8.4489 3.173e-16 2.481e-16 0.0003690 *** *** *** Site*Distance 2 23.03 13.74 42.59 11.52 6.87 21.29 7.0349 48.023 24.8952 0.001291 4.766e-16 9.038e-10 ** *** *** Core 6 1235.54 15.53 254.75 205.92 2.59 42.46 125.7994 18.087 49.6370 < 2.2e-16 7.262e-15 < 2.2e-16 *** *** *** Depth 48 2851.06 521.91 1919.57 59.40 10.87 39.99 36.2860 75.983 46.7534 < 2.2e-16 < 2.2e-16 < 2.2e-16 *** *** *** Residuals 120 196.43 17.17 102.64 1.64 0.14 0.86 Signif. codes: 0 '***' 0.001 '**' 0.01 '*' 0.05 '.' 0.1 ' ' 1 Black (CIE L); Blue (CIE a); Green (CIE b)
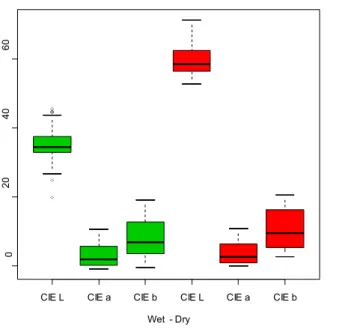
In the present case, the retrieved sediment was relatively dry (figure 4) but no water content was measured enabling to put aside the assumption than the observed differences in variance could be linked to changes in sediment moisture and not in composition. Indeed, a previous work on 12 cores from the upper marsh of 4 estuaries from the Algarve region showed that the moisture of the sediments do change significantly the CIE L values (p-value=0.2674 with two-sample t-test on n=144) but not the other two color components (figure 6).
A 1 5 2 0 2 5 3 0 3 5
CIE L for 50 cm distance
C IE L ( m ea n + s d) LG1 A LG1 B 1.0 1.5 2.0 2.5 3.0 3.5 1 5 2 0 2 5 3 0 3 5 4 0 Depth in m C IE L ( m ea n + s d) LG2 A LG2 B B 1 0 2 0 3 0 4 0
CIE L for 200 cm distance
C IE L ( m ea n + s d) LG1 A LG1 B 1.0 1.5 2.0 2.5 3.0 3.5 1 0 2 0 3 0 4 0 Depth in m C IE L ( m ea n + s d) LG2 A LG2 B C -1 0 1 2 3 4 5
6 CIE a for 50 cm distance
C IE a ( m ea n + s d) LG1 A LG1 B 1.0 1.5 2.0 2.5 3.0 3.5 -1 0 1 2 3 4 5 6 Depth in m C IE a ( m ea n + s d) LG2 A LG2 B D 0 5 1 0 1
5 CIE b for 50 cm distance
C IE b ( m ea n + s d) LG1 A LG1 B 1.0 1.5 2.0 2.5 3.0 3.5 0 5 1 0 1 5 Depth in m C IE b ( m ea n + s d) LG2 A LG2 B
Figure 5. Depth profiles of the mean values and the standard deviations, at both sites LG1 and LG2, for: A) CIE L for cores distant by 50 cm; B) CIE L for cores distant by 200 cm; C) CIE a for cores distant of 50 cm; and D) CIE b for cores distant of 50 cm (see text for discussion)
Hence, as the other color parameters profiles (CIE a and CIE b; figure 5C and 5D) show no corresponding overlap, one should not regard two records as similar or “Twin Cores” based only on the CIE L parameter profile. Likewise, the cores LG1A and LG1B show apparent overlap in the shallowest part of the profile of the CIE a and b parameters (figure 5C and 5D), but it is not statistically significant.
In general the color profiles (figure 5) reflect that: i) there are significant differences between the two sites; ii) there are significant differences between the two cores at any site and at any distances between them and iii) there are differences within depths. With increasing depth, the difference in the mean values of the color parameters between cores tends to be smaller, as well as the standard deviations. On the other hand, the upper part of the profiles shows great variability in mean values between cores with high standard deviations (figure 5). Assuming that the sediment accumulation rates are similar, this might be related to the upper sedimentary “instability” linked to vegetation roots, redox front and dynamics of groundwater table, which characterize saltmarsh environments [19]. At greater depth, the chemical conditions are more stable and thus the variance observed in sediment color between cores and even between sites should be smaller.
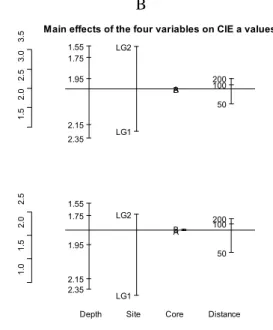
When plotting the main effects of the four variables used in the linear model on the mean values of each color parameter (figure 7), it appears that the variance for the deeper samples is effectively smaller than the variance for the shallower ones. In addition, the three color variables have different values for the upper part of the cores in relation to the deeper part. This corroborates the above observed variability in color profiles.
CIE L CIE a CIE b CIE L CIE a CIE b
0 2 0 4 0 6 0
Boxplot of the CIE Lab variables for wet and dry sediment
Wet - Dry
Figure 6. Boxplot of the three CIE lab color components for wet (green) and dry (red) sediment. Each boxplot represents 144 color analyses on samples recovered from12 cores from the Algarve region. Two-sample t-test between the wet and dry CIE L data sets gives a p-value of 0.2674 which means that the two data sets are significantly different. Furthermore, figure 7 puts in evidence that the main effects on the means’ variance are due to site location and sample depth but with much less contribution from the distance between cores. However, it is interesting to note that main variations in CIE a values seem to be linked to depth and not sites which can be interpreted as an indicator of a reduce lateral variation for sediment characteristics that are registered through this color parameter. Therefore, a detailed description of all interactions and
effects for each color parameter and at each factor level, as presented in the experiment design (table 2 and figure 7), can provide important information, as long as the link between color and sediment characteristics is known. In any case, if the purpose of a study is to compare records between sites, twin cores could still be used because the effect of distances is much less important than the one of sites. A 2 8 3 0 3 2 3
4 Main effects of the four variables on CIE L values
M ea ns 1.55 1.75 1.95 2.15 2.35 LG1 LG2 A B 50 100 200 4 5 6 7 8 S ta nd ar d de vi at io ns 1.55 1.75 1.95 2.15 2.35 LG1 LG2 A B 50 100 200
Depth Site Core Distance
B 1. 5 2. 0 2. 5 3. 0 3.
5 Main effects of the four variables on CIE a values
M ea ns 1.55 1.75 1.95 2.15 2.35 LG1 LG2 A B 50 100 200 1. 0 1. 5 2. 0 2. 5 S ta nd ar d de vi at io ns 1.55 1.75 1.95 2.15 2.35 LG1 LG2 A B 50 100 200
Depth Site Core Distance
C
5
6
7
8
9 Main effects of the four variables on CIE b values
M ea ns 1.551.751.95 2.15 2.35 LG1 LG2 A B 50 100 200 2. 5 3. 5 4. 5 S ta nd ar d de vi at io ns 1.55 1.75 1.95 2.15 2.35 LG1 LG2 A B 50 100 200
Depth Site Core Distance
.
Figure 7. Representation of the main effects of the four variables used in the experimental design on the means and standard deviations of the values obtained for each colour axis: CIE L (A), CIE a (B) and CIE b (C). Horizontal line in each of the design plot represent the overall mean of the data set (n=180) For instance for the mean of all CIE L values is 30.61 , 2.49 for all CIE a values, and 6.98 for all CIE b values. The present study used sample depth intervals of 20 cm in order to have independence between samples but the general trend in cored sediment’s studies is to work at very high resolution in order to acquire (almost) continuous physical properties [20] for documenting short time climatic events [6]. Such high resolution studies when applied to depositional environments such as estuaries where lateral variations are very important should have strong concern in extracting the overall climatic record from a unique site [2], because the variance observed between sites of only some hundreds of meters away might be more important, in some cases, than the variance within the site or the core.
In conclusion, the present experimental design helps to document the possibility of sediment core duplication for being used as “twin cores” for analysis purposes whenever sampling techniques allows it. This field of statistics, among others, allows including confidence and levels of significance to relations that might be either biased by the observer background or by the sampling method. Indeed, in the present study, the structure of the experimental design permits to conclude that the results are not due mere coincidence or randomness, at least for the studied estuary. A similar experimental design should be applied in future studies aiming to collect twin cores in such transitional regions.
Acknowledgment
The authors acknowledge the two reviewers (anonymous and M. Debret) for their constructive comments. This work was part of a financed project by FEDER and OE through the Portuguese Foundation for Science and Technology (FCT) (POCTI/CTA/39733/2001).
References
[1] Andrews J T and Freeman W 1996 The Measurement of Sediment Color Using the ColortronTM Spectrophotometre Arc. Alp. Res. 28 524-528
[2] Boski T, Camacho S, Moura D, Fletcher W, Wilamowski A, Veiga-Pires C, Correia V, Loureiro C and Santana P 2008 Chronology of the sedimentary processes during the postglacial sea level rise in two estuaries of the Algarve coast, Southern Portugal Estuar. Coast. Shelf Sci. 77 230-244
[3] Stuiver M 1970 Oxygen and carbon isotope ratios of fresh-water carbonates as climatic indicators J. Geophys. Res. 75 5247–5257
[4] Rothwell R G and Rack F R 2006 New Techniques in Sediment Core Analysis ed R G Rothwell
(Geo. Soc. Spec. Pub.. 267) (London:Geological Society) pp1-29
[5] Mix A C, Rugh W Pisias N G, Veirs S, Leg 138 Shipboard Sedimentologists and Leg 138 Scientific party 1992 Color Reflectance Spectroscopy: A Tool for Rapid Characterisation of
deep-sea sediments (Proc. of ODP 138) ed N G Pisias et al (Texas: Ocean Drilling Program)
pp 67-77
[6] Nederbragt A Jand Thurow J W 2004 Digital Sediment Colour Analysis as a Method to Obtain
High Resolution Climate Proxy Records ed P Francus (Dordrecht: Springer) pp 105-124
[7] Underwood A J 2006 Experiments in Ecology: Their Logical Design and Interpretation using
Analysis of Variance (Cambridge: Cambridge University Press) p 504
[8] X-Rite Color 2000 ColorShop – Getting Started Guide p 70
[9] R Development Core Team 2007 R: A language and environment for statistical computing R Foundation for Statistical Computing (Vienna) http://www.R-project.org
[10] Maindonald J and Braun J 2007 Data analysis and Graphics using R an Example-Based
Approach 2nd Edition ed R Gill et al (New York: Cambridge University Press) p 502
[11] Dalgaard P. 2002 Introductory Statistics with R ed J Chambers Use et al (New York: Springer) p 267
[12] Quinn G P and Keough M J 2002 Experimental Design and Data Analysis for Biologists (Cambridge: Cambridge University Press) p 537
[13] Zuur A F, Ieno E N and Smith G M 2007 Analysing Ecological Data ed M Gail et al (New York: Springer) p 672
[14] Francus P, Bradley R S and Thurow J W 2004 An Introduction to Image analysis, Sediments
and Paleoenvironments ed P Francus (Dordrecht: Springer) pp 1-7
[15] Walker R G and James N P 1992 Facies Models: Response to Sea Level Change (Stistville, Ontario: Geological Association of Canada) p 409
[16] Nagao S and Nakashima S 1991 A convenient method of color measurement of marine sediments by colorimetry Geochem. J. 25 187-197
[17] Blum P 1997 Physical Properties handbook: a guide to the shipboard measurement of physical properties of deep-sea cores ODP Tech. Note 26
[18] Balsam W L and Deaton B C 1991 Sediment dispersal in the Atlantic Ocean – Evaluation by visible light spectra Rev. in Aquatic Sci. 4 411-447
[19] Fagherazzi S, MArani M and Blum L K 2004 Coastal Estuarine Studies: The Ecogeomorphology of Tidal Marshes (Washington: AGU) p 268
[20] St-Onge G, Mulder T, Francus P and Long B 2007 Continuous Physical Properties of Cored