Setembro, 2017
David Seixas Esteves
Licenciado em Ciências de Engenharia de Micro e
Nanotecnologias
Development of piezoeletric structures based on cork and
electrospun fibers
Dissertação para obtenção do Grau de Mestre em
Engenharia de Micro e Nanotecnologias
Orientadora: Doutora Carmo Lança, Professora Auxiliar,
Faculdade de Ciências e Tecnologias da Universidade Nova
de Lisboa
Co-orientador: Doutor João Paulo Borges, Professor Auxiliar, Faculdade de
Ciências e Tecnologias da Universidade Nova de Lisboa
Júri:
Presidente: Prof. Doutor Rodrigo Ferrão de Paiva Martins
iii Copyright © David Seixas Esteves
Faculdade de Ciências e Tecnologia Universidade Nova de Lisboa.
A Faculdade de Ciências e Tecnologia e a Universidade Nova de Lisboa têm o direito, perpétuo e sem limites geográficos, de arquivar e publicar esta dissertação através de exemplares
impressos reproduzidos em papel ou de forma digital, ou por qualquer outro meio conhecido ou que venha a ser inventado, e de a divulgar através de repositórios científicos e de admitir a sua cópia e distribuição com objectivos educacionais ou de investigação, não comerciais, desde que
vii
Acknowledgments
I would like to thank the Faculty of Science and Technology of New University of Lisbon for all the opportunities and teaching quality it has provided me during these five years.
To Prof. Rodrigo Martins and Prof. Elvira Fortunato for creating the Msc in Micro and Nanotechnology Engineering course.
To my supervisor Prof. Carmo Lança and co-supervisor Prof. João Borges for all the help provided every time I had a question or problem. And who gave me the opportunity to do this project, which helped me to learn many new things.
I should also express my gratitude towards all the researchers that supported my work: Prof. Joana Pinto,Prof. Rita Branquinho, Prof. Rui Igreja, Prof. Carlos Dias, Ana Batista, Daniela Gomes, Paul Grey, Sónia Pereira, Ana Pimentel and Tomás Calmeiro. I would like to thank to all my course colleagues for all the good moments and afternoons playing futsal, especially to: Inês Martins, Cátia Figueiredo, Tiago Gameiro, João Luis, Pedro Trigo, Emanuel Carlos, Ana Samouco, Alexandre Fonseca and Francisco Matos.
To my good friends from home: Pedro Pereira, Diogo Magalhães, Oscar Freitas and João Silva for all the good time that we spend together during all these years.
Finally, to my closest family: mother, father and brother for all the patience, motivation and help to overcame all the difficulties that I found during my journey. Without their support I
ix
Abstract
Growing concern for the environment makes it important to find environment friendly materials and also to use wasted energy to create usable energy. Both can be achieved by using piezoelectric polymers.
Poly(vinylidene fluoride-trifluoroethylene), P(VDF-trFE), has good electroactive properties and high piezoelectric constant, also is a lead free material. It is used on sensors, actuators and energy harvesting devices converting wasted energy (vibrations and mechanical impacts) into usable energy. Cork is a natural product with excellent properties as a substrate. It is lightweight, flexible, impermeable and durable.
This work aims to develop piezoelectric structures using membranes of P(VDF-trFE) deposited on cork substrate. Electrospinning was used to fabricate P(VDF-trFE) membranes. The polarization of the fibers is achieved during electrospinning and is caused by the strong electric field present. This way in a single step production, is obtained a piezoelectric material and its simultaneous polarization.
Using different electrospinning parameters, the membranes were made and characterized.
The set of parameters giving rise to membranes with good crystallinity, β-phase and piezoelectric response, were further used to fabricate membranes on cork substrate.
This approach is a starting point to design and produce structures that could be used in future applications, such as, sensors and energy harvesting devices.
xi
Resumo
Com a crescente preocupação com o meio ambiente, torna-se importante encontrar materiais menos poluentes. É também importante aproveitar a energia desperdiçada e transformá-la em energia utilizável. Tudo isto passa a ser possível utilizando polímeros piezoeléctricos.
Poli(fluoreto de vinilideno-trifluoroetileno), P(VDF-trFE), possui ótimas propriedades eletroativas, elevada constante piezoelétrica e é um material que não possui chumbo. Este polímero pode ser usado em sensores, atuadores e dispositivos de criação de energia, de forma a utilizar a energia que é desperdiçada (vibrações e impactos mecânicos) e convertê-la em energia utilizável. A cortiça é também um produto natural com excelentes propriedades como substrato. É leve, flexível, impermeável e resistente.
Este trabalho tem como objetivo o desenvolvimento de estruturas piezoelétricas usando P(VDF-trFE) e cortiça. A electrofiação foi usado para fabricar membranas de P(VDF-trFE). A polarização das membranas é feita durante a electrofiação e é provocada pelo forte campo eléctrico presente. Desta forma, num único passo, é possível fabricar um material piezoeléctrico e ao mesmo tempo polarizá-lo.
As membranas foram fabricadas através do uso de diferentes parâmetros de electrofiação, sendo depois caracterizadas. Os parâmetros que deram origem a membranas com elevada
cristalinidade, fase β e resposta piezoeléctrica, foram depois usados nas deposições em substratos de cortiça.
Esta abordagem é um ponto de partida para projetar e produzir estruturas que poderiam ser usadas em aplicações futuras, como sensores e dispositivos de colheita de energia.
xiii
List of abbreviations
AC-Alternating current DC-Direct current
DSC-Differential scanning calorimetry
FTIR-ATR-Fourier-transform infrared spectroscopy attenuated total reflectance LEDs- Light emitting diodes
PVDF-Polyvinylidene fluoride
P(VDF-trFE)-Poly(vinylidene fluoride-trifluoroethylene) PEN-Polyethylene naphthalate
PET-Polyethylene terephthalate SEM-Scanning electron microscope Tc- Curie temperature
TCD-Tip to collector distance Tm-Melting temperature
TSDC-Thermo stimulated depolarization current w/w- Weight per weight
xv
Table of contents
1 Introduction ... 1
1.1 Piezoelectricity... 1
1.2 Piezoelectric materials ... 1
1.3 Poly( vinylidene fluoride) and Poly (vinylidene fluoride-Trifluoroethylene) ... 2
1.4 Electrospinning technique ... 3
1.4.1 Process parameters ... 4
1.5 Electrospinning of P(VDF-trFE) ... 5
1.6 Cork ... 5
2 Materials and methods ... 7
2.1 Electrospinning experiments ... 7
2.2 Screen printing of cork substrates ... 7
2.3 Electrospinning using cork as substrate ... 8
2.4 Characterization techniques... 8
3 Results and discussion ... 11
3.1 Fiber formation ... 11
3.1.1 Effect of Polymer concentration on fiber diameter: ... 11
3.1.2 Effect of applied voltage during electrospinning on the fiber diameter ... 12
3.1.3 Effect of TCD on the fiber diameter ... 12
3.1.4 Effect of the type of collector on fiber diameter ... 13
3.1.5 Effect of flow rate on fiber diameter ... 14
3.2 Crystallinity ... 15
3.2.1 XRD results ... 16
3.2.2 Effect of Polymer concentration on degree of crystallinity ... 16
3.2.3 Effect of voltage during electrospinning on the degree of crystallinity ... 16
3.2.4 TCD effect on the degree of crystallinity ... 17
3.2.5 Collector effect on the degree of crystallinity... 17
3.2.6 Flow rate effect on the degree of crystallinity ... 17
xvi
3.3 β-phase formation... 19
3.3.1 FTIR results ... 19
3.4 Output Voltage measurements ... 22
3.5 Dipole alignment ... 24
3.5.1 Thermally Stimulated Discharge Current (TSDC) ... 24
3.5.2 Impact tests for the repeated samples ... 26
3.6 P(VDF-trFE) deposition on cork substrate ... 27
4 Conclusion and future perspectives ... 31
5 References: ... 33
xvii
List of figures
Figure 1-Comparison between a) square non-piezoelectric structure and b) piezoelectric structure[9]. ... 1 Figure 2) a) structural differences between PVDF crystalline phases and b) representation of the P(VDF-trFE) repeat units [13]. ... 3 Figure 3) Schematic illustration of the basic setup for electrospinning [21]. ... 4 Figure 4) Illustration of the screen printing technique. ... 8 Figure 5- a) Fiber diameter for different concentrations, using an applied voltage of 15 kV, 15 cm of TCD and 1 mL/h flow rate. b) Fiber diameter for different applied voltages, for 20% w/w, 10cm and 1 mL/h flow rate. c) Fiber diameter for different applied voltage, for 20% w/w, 15 cm of TCD and 1 mL/h flow rate ... 12 Figure 6- a) SEM image of 10 cm TCD and b) 15 cm for a concentration of 20% and an applied voltage of 15 kV... 13 Figure 7- SEM image of fibers produced with a) static and b) rotating collector with 500 × and c) 3k × magnification. d) Fiber diameter comparison between depositions on static flat and rotating drum collector. ... 14 Figure 8- SEM image of fibers produced at a flow rate of a) 0.5 mL/h and b) 1 mL/h and c) fiber diameter comparison... 15 Figure 9- a) XRD diffractograms for fibers deposited on the static collector (red line) and on the rotatory collector (black line). b) XRD diffractograms for fibers deposited with an applied voltage of 15 kV (black line), 19 kV (red line) and 23 kV (blue line), all using rotatory collector. 17 Figure 10- DSC endothermic peaks for fibers produced from P(VDF-trFE) solutions with different concentrations. 15% (black line), 18% (red line) and 20% (blue line). It is possible to see the Curie temperature Tc and melting point Tm for all samples. ... 18 Figure 11-FTIR-ATR absorbance spectrum for fibers produced with P(VDF-trFE) solution of 20%, 15 cm TCD, 1 mL/h flow-rate and 15 kV (blue line), 19kV (red line) and 23 kV (black line) applied voltage. All samples have the same β-phase characteristic peaks. ... 20 Figure 12- a) and b) FTIR-ATR spectra of a sample with 18% concentration, 15 cm TCD and 19 kV applied voltage, showing the decrease in absorption values for the sample heated during 15 min at 130 °C (red line) compared with a untreated sample (blue line). c) Impact test on as-electrospun sample and d) impact test on the heated sample ... 22
xix
List of tables
xxi
Motivation and Objectives
The capacity of taking wasted energy around us and convert it in usable electric energy has been a topic of interest for many researchers. Nanogenerators that use piezoelectric materials have been used to harvest energy from mechanical deflections, acoustic waves, fluid or air flows and human activities. Although the power output with this materials is on the sub-milliwatt level, it is enough energy to power small electronic devices that do not need much electric energy to work, such as wireless devices, light-emitting diodes (LEDs) and different types of sensors [1].
Piezoelectric sensors and actuators are another interesting topic. The best known piezoelectric sensors are related with mechanical measurements, such as force, torque, strain, pressure, acceleration and acoustic emission [2].
These piezoelectric materials are usually ceramics made of compressed ferroelectric grains, that are then polarized in order to align the electric dipoles and enhance the piezoelectric response [2]. Even though they show greater piezoelectric properties, they have lead in their structure, which causes the necessity to find biocompatible and lead free piezoelectric materials, such as piezoelectric polymers [3].
Among the piezoelectric polymers, the most used is PVDF and its copolymer P(VDF-trFE). Both of them have good chemical resistance, flexibility and ease of processing. The main difference between PVDF and its copolymer is the introduction of an extra fluorine atom that
facilitates the β-phase formation (which is piezoelectric).
Electrospinning is one of the easiest ways of making polymeric membranes. This technique allows the fabrication of polymeric fibers and at the same time the electric field polarizes the fibers, improving its piezoelectric response [4, 5]. Persano et al. reported the fabrication of high performance nanofibers made of P(VDF-trFE) by electrospinning, with potential applications that range from self-powered micro-mechanical elements, to self-balancing robots and sensitive impact detectors [4].
The objective of this work is the development of a material that mixes the properties of cork with the piezoelectric properties of P(VDF-trFE). Lee et al. reported the deposition of electrospun PVDF nanofibers on glass, paper, PET and PEN for sound-driven energy harvesting [6]. To the best of our knowledge a similar deposition was never done on cork substrate.
The main advantages of using cork as substrate arise from properties that complement the polymer properties, such as lightweight, elasticity, flexibility, impermeability, thermal and sound insulation and fire resistance [7]. All these properties allow applications where flexibility is needed, it gives structure to the membrane and at the same time it protects the membrane against water and high temperatures.
1
1
Introduction
1.1
Piezoelectricity
A material is said to be piezoelectric if the application of an external mechanical stress gives rise to dielectric displacement in this material, which manifests itself has internal electric polarization. However, if the material’s lattice is centro symmectric, it will be unable to produce a piezoelectric effect [8].
Figure 1 represents the abovementioned concept. For the square structure on figure 1 a), the center of charge is still the same under compressive stress and therefore there is no polarization change. For the structure on figure 1 b), the center of charge changes with applied stress, one side becomes more positive and the other side becomes more negative, which causes an electric field [9].
There are two different effects that translate the interaction between mechanical and electrical systems in structures, the direct effect and the inverse piezoelectric effect. The inverse effect is when a piezoelectric material becomes strained if an external electric field is applied. Both effects happen in non-centric structures and are used in applications, such as, sensors, actuators and energy harvesting devices [8].
Figure 1-Comparison between a) square non-piezoelectric structure and b) piezoelectric
structure[9].
1.2
Piezoelectric materials
2 lead, there is a high interest in developing biocompatible and environmentally friendlier materials, such as piezoelectric polymers [3].
Piezoelectric materials convert the mechanical strain energy into electrical charge and vice versa. Such distinctive properties made these materials suitable for many different applications. The most common applications are related with sensing and control of different structures [11]. Nowadays, piezoelectric materials are also being used to acquire energy from the environment and converting it into usable electrical energy [10] This process is known as power or energy harvesting [12].With the development of low-power electronics and wireless technology, power harvesting is nowadays a growing area with an enormous potential. Mainly because it might enable the usage of ambient vibrations to power devices [1].
1.3
Poly( vinylidene fluoride) and Poly (vinylidene fluoride -Trifluoroethylene)
Poly(vinylidene fluoride) (PVDF) and its copolymers are known for their good electroactive properties, high piezoelectric constant, flexibility, lightweight and for being lead free [10, 13]. These properties make PVDF and its copolymers suitable for applications such as, sensors, actuators and energy harvesting devices [13].
PVDF is a semi-crystalline polymer, which means that it has both amorphous and crystalline phases with identical chemical compositions but with different physical properties [14]. This polymer has five different crystalline phases, that are related with different chain conformations, all-trans (TTT) planar zigzag for β-phase, trans-gauche-trans-gauche for α and δ
phases and T3GT3G’ for γ and ε phases. Some of the chain conformations are illustrated in figure 2 a). In the piezoelectric phases each polymer chain has a dipole moment perpendicular to it. When the chains are parallel to each other, the dipole moment is also parallel to each other and the crystal has a net dipole moment. This happens in β, δ and γ phases. On the other hand, α and ε phases are non-polar due to antiparallel packing of the dipoles within the unit cell. Among the
polar phases, β-phase has the largest spontaneous polarization per unit cell and the highest piezoelectric properties [13, 15].
3 Figure 2) a) structural differences between PVDF crystalline phases and b) representation of
the P(VDF-trFE) repeat units [13].
On the other hand, poly(vinylidene fluoride-Trifluoroethylene) P(VDF-trFE) always presents a high content of β-phase independently if the processing method is from melt or solution casting, as long as the VDF content is between 50 and 80% [13, 16]. This happens because the third fluorine cause microstructural defects, which favors the all-trans (TTT) planar zigzag conformation [17]. The representation of the P(VDF-trFE) repeat units are shown in figure 2 b).
The ferroelectric properties of P(VDF-trFE) are related with the electronegativity differences of fluorine, carbon and hydrogen atoms. When the electrons are attracted by the fluorine electronegativity to its side of the polymeric chain, polarization is created [18].
1.4
Electrospinning technique
One dimension nanostructures have gained much attention because of their improved properties when compared to the bulk materials. Examples of unidimensional nanostructures are wires, rods and fibers [19]. Fibers with diameters under 100 nm are considered nanofibers and the main advantages of these nanofibers are the high surface area to volume ratio, high porosity and flexibility [20]. From the different techniques to produce micro and nanofibers, one of the most used is electrospinning. This technique is easy to use, versatile and scalable. It allows the fabrication of long and uniform fibers with different compositions that can be used for different types of applications and areas, such as sensors, electronics, catalysis and bioengineering [21, 22].
4 the Taylor cone, a jet erupts starting the fiber production process [19, 21].
Figure 3) Schematic illustration of the basic setup for electrospinning [21].
Between the needle and the collector, the jet passes through a process of stretching and whipping. During this process, the solvent is evaporated and long and thin fibers are collected on the grounded collector [21].
1.4.1
Process parameters
During electrospinning, there are several parameters affecting the fiber formation. These are solution parameters, electrospinning parameters and ambient parameters [19]. The solution parameters are related with the polymer concentration, the solvent used (affecting the surface tension of the solution), the viscosity and the conductivity of the solution [19, 21, 22].
With increasing concentrations, the solution viscosity and the fiber diameter will also increase. The solvent is used to make the polymer soluble and it will evaporate, while travelling between the needle and the collector [22].
The electrospinning parameters are associated with the voltage applied, the flow rate of the polymer solution, the collector used and the distance between the tip of the needle and the collector [19].
5 different types of applications [19] and will affect fiber morphology.
The ambient parameters are humidity and temperature. Humidity causes changes in the nanofibers diameter because it affects the solvent evaporation. The temperature causes changes because higher temperatures increase solvent evaporation [19, 22].
It is important to understand the effects of all these parameters because they all affect the fabrication of smooth and bead-free electrospun fibers [22].
1.5
Electrospinning of P(VDF-trFE)
As explained before, β-phase presents the best electroactive properties and there are a few methods to convert PVDF α-phase in β-phase. The most common techniques to achieve β phase in PVDF are mechanical stretching mechanisms and electrical polling. These poling processes are also used for the reorientation of the crystallites, in order to align the molecular dipoles [13].
In case of P(VDF-trFE) the conversion of α-phase in β-phase is not critical because it
crystallizes predominantly in the β-phase [16]. However, it is necessary to align the molecular dipoles in order to enhance the piezoelectric effect [9, 23, 24]. The problem with the conventional poling process is the need of several steps (membrane fabrication and polarization) and when using electrospinning both are achieved at the same time [13, 24].
Electrospinning provides a strong mechanical stretching and at the same time polarizes the fibers, causing a directional alignment of the nanofiber molecular dipoles. Also, the polymer might be deposited directly in the substrate without the need of further treatments [24].
1.6
Cork
Cork is a natural product that grows on a specific Mediterranean tree, called, cork oak (Quercus Suber). Cork forests are well adapted to southern European regions and Portugal is one of the main producers of cork in the World [7].
The cork oak can create suberose tissue from its inner bark. The bark regenerates itself after harvesting, which makes it a truly renewable material [25]. There are three different types of suberose tissue: virgin cork, cork from the second extraction and cork from the subsequent extractions. Usually the cork of the first two extractions has lower quality and because of that cannot be used as cork stoppers, but it can be grinded, compressed and mixed with other materials and used as a agglomerated material [26, 27].
7
2
Materials and methods
In order to create the solutions for electrospinning, P(VDF-trFE) (72/28 weight %, Piezotech) was dissolved in 3:2 volume ratio of dimethylformamide/acetone (DMF/acetone, Prolabo and Sigma Aldrich) at a polymer concentration of 15%, 18%, 20% and 23% w/w. All solutions were then magnetically stirred and heated at 40° C for 24 h in order to make sure that the solutions were completely homogenous.
2.1
Electrospinning experiments
The electrospinning setup consisted of a high voltage power supply (Glassman High Voltage), a programmed syringe pump (NE-1000 New Era Pump Systems) and two different types of collectors. A flat collector and a drum (8 cm diameter) and rotational collector powered by a linear motor (Red Lion) at 2000 rpm.
The electrospinning experiments were conducted placing the P(VDF-trFE) solutions inside a 5 mL Syringe (11.8 mm diameter), fitted with a 27-gauge blunt tip needle, mounted in a syringe pump. The tip of the needle was connected to the power supply using a crocodile clip and the applied voltage was 15, 19 and 23 kV. The process was carried out using two different tip-to-collector distances (TCD), namely 10 and 15 cm. The flow-rate used was 0.5 and 1 mL.h-1. The collector was covered with aluminum foil and kept static in case of the flat collector, or rotated at 2000 rpm in case of the drum collector.
The ambient conditions were kept between 40-50% of relative humidity and the temperature was close to 25 °C. In order to study the membrane properties the amount of solution used in each deposition was 0.5 mL, except when the deposition was in the cork substrate. In that case the amount of solution was 1-1.5 mL. If the membrane was thinner the electrodes deposited on cork, would penetrate the membrane during the piezoelectric measurements, causing short circuits. After the deposition the mats were dried for 24h, in the desiccator containing freshly activated silica gel.
2.2
Screen printing of cork substrates
8
Figure 4) Illustration of the screen printing technique.
The screen printing process consisted of a screen mesh (model 777), with a defined printing pattern. In this case, a simple rectangle with a dimension of 2×4 cm. The screen mesh was then placed on the top of the cork substrate and the squeegee was moved over the screen 5 times, forcing the silver ink (PE-AG-30 Flexible Silver Conductive ink, Conductive Compounds) to pass through the pattern of the mesh and become printed on top of the cork substrate.
All samples with the printed patterns were then heated at 120 °C during 5 minutes, to make sure that all the solvents evaporated.
2.3
Electrospinning using cork as substrate
After membrane characterization, the samples with proven best results were then used on cork substrate. In order to do that, the cork substrate was then attached on the top of the tin foil using carbon tape, or placed under the tin foil with an opening on it. Two different types of cork agglomerate were used. A thicker one with 4 mm (generic cork underlayment roll, with an epoxy resin as binder) and a thinner one with 2 mm (Cork4U+ Polyurethane).
2.4
Characterization techniques
Scanning electron microscopy (SEM, Carl Zeiss Auriga) technique was used to evaluate the fiber morphology. The membranes were placed on top of a metallic plate, fixed with carbon tape and then coated with a layer of palladium/gold using a Q300T D Quorum sputter coater. The fiber diameter was then determined using ImageJ. It was measured the diameter of 20 fibers for each sample.
The X-Ray diffraction (XRD, X’Pert Pro from Panalytical) technique was used to study
the presence of β-phase and the crystallinity of the samples. The scans were done within the 2θ
range of 10° to 89°, using CuKα radiation.
9 technique was used to calculate the fraction of β-phase present in the membranes. The data was measured using an Attenuated Total Reflectance (ATR) sampling accessory (Smart iTR) equipped with a single bounce diamond crystal with an incident angle of 45° and the scans were done from 4500 to 500 cm-1.
The Differential Scanning Calorimetry (DSC, STA 449 F3 from Jupiter) technique was used to measure the peaks that correspond to the Curie and fusion temperature. The samples were heated from 35° to 250 ° C at a rate of 10° C/min, under a nitrogen gas flow of 30 mL/min.
The Thermally Stimulated Discharge Current (TSDC) equipment was used to study the polarization of the samples. Each sample was heated until 160° C at a rate of 5°C/min and all the depolarization currents were measured using an electrometer (Keithley 617) connected to a computer.
11
3
Results and discussion
In order to understand which electrospinning parameters would be responsible for the best piezoelectric properties of the fibrous membranes, five different parameters were considered: flow-rate, type of collector used, concentration, TCD and applied voltage.
From this study it was concluded that the best flow-rate to use is 1 mL/h. The flow-rate of 0.5 mL/h did not show significant improvements compared with the higher flow-rate and the deposition time was two times higher. In terms of commercial applications, this can be costly. The static collector was also not chosen. Once again it did not show significant improvements in the output voltage measured during the impact tests and showed production problems: while in the drum collector the depositions are longitudinal in the static collector the depositions are in form of a circle. For distances smaller than 15 cm the circle was too small to test and some hard polymeric agglomerations were collected in the center of the circle. Using the static collector could become a problem for industry, because the deposition area would be too small for mass production. After considering all results the 20 most promising samples were further analyzed.
The analysis was divided in four different parts. First, the fiber formation was studied in order to understand if the fibers are defect free. Then the crystallinity of the samples and the β -phase formation, was studied. It is important to know the amount of β-phase, because is the one with the best electroactive properties. After these steps, impact tests were done in order to understand which samples had the higher output voltage and finally it was studied the dipole alignment of the samples. After all these tests, the sample with the best set of properties was deposited on cork substrates.
3.1
Fiber formation
P(VDF-trFE) nanofiber mats were prepared varying different parameters. Overall, most of the fibers were uniform and without beads, but the fiber diameter differed with different parameters. All the fiber diameter values for the different parameters are in annex 1.
3.1.1
Effect of Polymer concentration on fiber diameter:
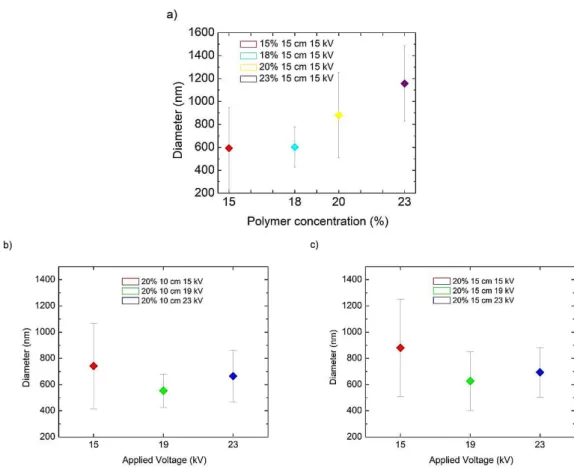
12 Figure 5- a) Fiber diameter for different concentrations, using an applied voltage of 15 kV, 15
cm of TCD and 1 mL/h flow rate. b) Fiber diameter for different applied voltages, for 20% w/w, 10cm
and 1 mL/h flow rate. c) Fiber diameter for different applied voltage, for 20% w/w, 15 cm of TCD and
1 mL/h flow rate
3.1.2
Effect of applied voltage during electrospinning on the fiber diameter
The electric field is the driving force of jet initiation. The process starts when the electric field causes the charges to repel each other, overcoming the surface tension of the solution and causing the jet to travel from the tip of the needle to the collector [32, 33]. In figure 5 b) and 5 c), it is possible to see that an increase in the applied voltage for the same TCD, resulting in an increase in the electric field, did not have a relevant impact in the fiber diameter of the fibers.
3.1.3
Effect of TCD on the fiber diameter
Figure 6 a) and b) can be used to understand how the TCD affects the fiber diameter. On
figure 6 a) the TCD is 10 cm and on 6 b) the TCD is 15 cm with diameters of (7.4±2.3)×102 nm and (8.8±2.5)×102 nm, respectively.
The decrease in the TCD has a similar effect to the increase of applied voltage, because when the electric field increases, the fibers suffer stronger elongation. Hence, for smaller
13 Figure 6- a) SEM image of 10 cm TCD and b) 15 cm for a concentration of 20% and an
applied voltage of 15 kV.
3.1.4
Effect of the type of collector on fiber diameter
During this work, two different types of collector were studied. The fiber morphology is shown on figure 7. Figure 7 a) shows fibers deposited on a flat and static collector. The membrane shown on figure 7 b) was the membrane with best overall properties, the parameters used were a rotatory drum collector, using 15% concentration a TCD of 15 cm, an applied voltage of 19 kV and a flow-rate of 1 mL/h. It is possible to see that fibers deposited on a static collector had more defects. They were deposited in a random orientation, but had lower average diameters as shown in figure 7 d). The fibers deposited on the rotatory collector showed fewer defects and were slightly more aligned. The mean diameter of fibers produced on flat and drum collectors were (5.0±2.0)×102 nm and (8.0±1.0)×102 nm, respectively.
14 Figure 7- SEM image of fibers produced with a) static and b) rotating collector with 500 ×
and c) 3k × magnification. d) Fiber diameter comparison between depositions on static flat and
rotating drum collector.
3.1.5
Effect of flow rate on fiber diameter
The influence of flow rate was studied by keeping the applied voltage at 15 kV, the TCD at 15 cm and the polymer concentration at 15%. The differences between the samples are shown on figure 8. The collector used was the rotatory collector and flow-rates of 0.5 and 1 mL.h-1. The time of electrospinning for the sample with the flow rate of 0.5 mL.h-1 was two times higher to make sure that the same volume was used in both depositions.
15 Figure 8- SEM image of fibers produced at a flow rate of a) 0.5 mL/h and b) 1 mL/h and c)
fiber diameter comparison
3.2
Crystallinity
In order to have a good piezoelectric material, some properties should be taken into consideration. One of the most important parameters affecting the piezoelectric properties is the crystallinity, specifically the percentage of the β-phase. Without a defined morphology, the material would not sustain a net dipole and therefore it would not show good piezoelectric properties [35].
Two common methods to study the crystallinity of PVDF and copolymers are X-ray diffraction (XRD) and Differential Scanning Calorimetry (DSC) techniques. With the XRD diffractograms, it is possible to study the difference between the sharp peaks (corresponding to the crystalline phase) and the broader background (that corresponds to the amorphous regions). With DSC, the polymer is heated at a constant rate and the melting points can be measured and divided by the value of a 100% crystalline material [35], allowing to calculate the degree of crystallinity.
16 calculated using the XRD diffractograms were used to compare the samples in a more qualitative manner. The DSC was used to study the Curie and melting points of three different samples and since it is a more reliable test, it was also used to calculate the degree of crystallinity of the three samples chosen. By using both XRD and DSC for the same samples, it was possible to infer that the samples had different quantitative results. Nevertheless, the results varied similarly in a qualitative manner, thus confirming that the qualitative comparison between samples is correct.
3.2.1
XRD results
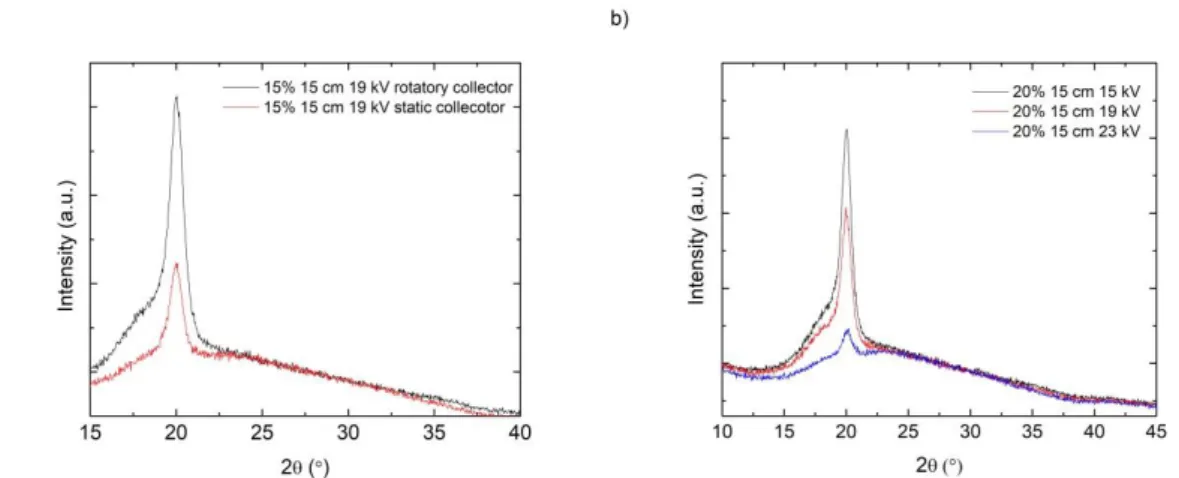
X-ray diffraction (XRD) data is shown in figure 9. It is possible to see a strong peak at
2θ=19.9 °, which corresponds to the (110) and (200) β-phase planes. This confirms the presence of
β-phase in the membranes [36]. In PVDF samples, it is common to appear a peak around 2θ =18°, which corresponds to the α-phase [37, 38]. In P(VDF-trFE), usually α-phase is not taking into account because the microstructural defects caused by the fluorine atom help in the β-phase formation [17]. So, accordingly, no peak related with α-phase is seen in our diffractograms.
The strong diffraction peak present in most of the samples indicates a high degree of crystallinity [18, 39]. This was confirmed using the following equation:
𝑋% = 𝐼200 − 𝐼𝑎𝑚𝐼200 × 100 (3.1)
Where, X% is the percentage of crystallinity, I200 is the peak intensity of the crystalline part and Iam is the intensity of the amorphous part [40, 41]. All the XRD results are in annex 1.
3.2.2
Effect of Polymer concentration on degree of crystallinity
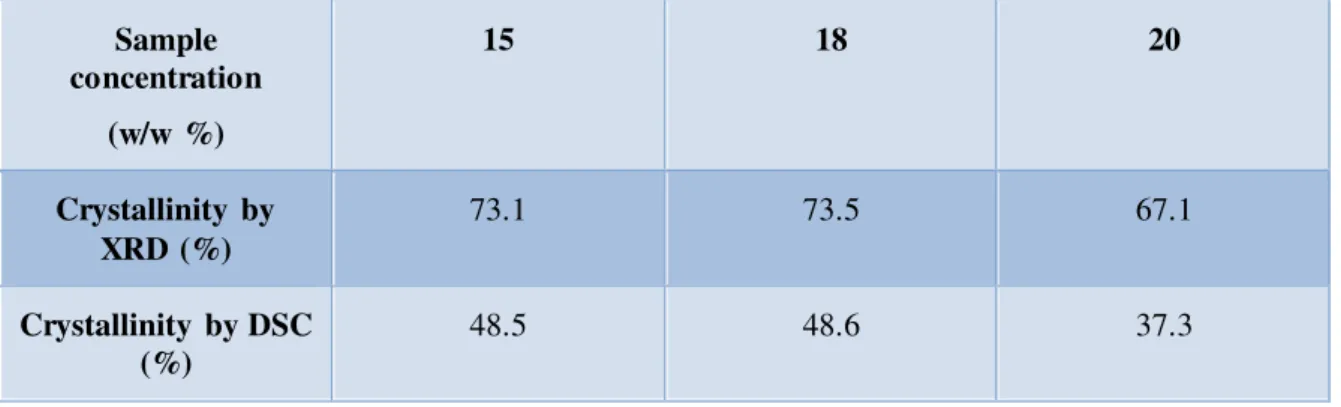
As shown in annex 1, for a TCD of 15 cm, a flow rate of 1 mL/h and an applied voltage of 19 kV, there is a decrease in crystallinity with the increase of solution concentration.
The decrease in crystallinity with increased concentration can be caused by the lower molecular orientation, during electrospinning, for higher polymer solution concentrations. This happens because polymer solutions with higher concentration have chains that are less mobile due to larger number of chain entanglements, which results in lower molecular orientation [42].
3.2.3
Effect of voltage during electrospinning on the degree of crystallinity
In figure 9 b), it is possible to see that for a TCD of 15 cm, a flow rate of 1mL/h and a polymer concentration of 20%, an increase in voltage from 15 kV to 23 kV decreased the degree of crystallinity. From our perspective this can be explained with the fact that an increase in the electric field cause a higher number of charges on the polymer solution, which accelerates the jet and decrease its flight time.
17
3.2.4
TCD effect on the degree of crystallinity
If the TCD had the same effect as the applied voltage, for higher distances the flight time should be superior and the molecular orientation would also be superior which would improve the crystallinity. But it seems that for an applied voltage of 19 kV, a flow rate of 1mL/h and for all the polymer concentration tested, decreasing the TCD from 15 cm to 10 cm increases the crystallinity.
The decrease in crystallinity may be related with the increase in the spiraling trajectory of the jet with increased distance, which causes instability and decreases the crystallinity [42].
3.2.5
Collector effect on the degree of crystallinity
During this work, two different types of collectors were used: a static and a rotating collector. Figure 9 a) shows the XRD results. It is possible to see that the rotating collector increased the crystallinity of the fibers.
The increase in crystallinity might be explained by the higher chain orientation of the fibers collected in the rotating collector [4, 34].
Figure 9- a) XRD diffractograms for fibers deposited on the static collector (red line) and on
the rotatory collector (black line). b) XRD diffractograms for fibers deposited with an applied voltage
of 15 kV (black line), 19 kV (red line) and 23 kV (blue line), all using rotatory collector.
3.2.6
Flow rate effect on the degree of crystallinity
The last analyzed variable potentially affecting crystallinity was flow rate. Two different flow-rates were studied. The XRD results show, contrary to what would be expected, that decreasing the flow rate from 1 mL/h to 0.5 mL/h slightly decreases the crystallinity of the fibers.
3.2.7
DSC results
18 second peak was around 145 °C and it is associated with the melting of the crystalline phase (Tm) [37, 43].
For polymer concentrations of 18% and 20%, the DSC curve has only two endothermic peaks, one for Curie temperature and another for the melting temperature. On the other hand, for 15% polymer concentration, the Curie temperature peak changed from one to two peaks. This behavior usually happens when more than one DSC cycle is done. It is explained by the formation of different ferroelectric phases, with different thermodynamic stability after melting and recrystallization. In other words, this phenomenon is associated with the splitting of one large uniform domain into two different domains, having the larger domain a higher Currie temperature [43, 44].
In this case it was done just one cycle, so, this probably happened because the membrane was cut in various pieces to fill the equipment sample container and different parts of the sample can have different domains.
Figure 10- DSC endothermic peaks for fibers produced from P(VDF-trFE) solutions with
different concentrations. 15% (black line), 18% (red line) and 20% (blue line). It is possible to see the
Curie temperature Tc and melting point Tm for all samples.
The DSC data was also used to confirm the DRX results for the crystallinity calculation. In order to calculate samples’ degree of crystallinity (∆Xc), the following equation was used:
∆𝑋𝑐 = ∆Hm
∆H0 × 100 (3.2)
19 100% crystalline sample. The value used for the 100% crystalline sample of P(VDF-trFE) was 45 J g-1[45]. The calculated results are in qualitative agreement with the XRD results as shown in table 1. It was possible to confirm that the crystallinity of the samples decreased with the concentration increase.
Table 1- Crystallinity values for different samples using XRD and DSC
Sample concentration
(w/w %)
15 18 20
Crystallinity by XRD (%)
73.1 73.5 67.1
Crystallinity by DSC (%)
48.5 48.6 37.3
3.3
β
-phase formation
The polar β-phase has the highest piezoelectric properties, amongst other and therefore it has attracted technological interest [15].
The study of the crystallinity of the samples, using XRD, showed that β-phase was present in all samples. However, it was not possible to quantify which samples had the higher amount of
β-phase. Therefore, FTIR was used to quantify the amount of β-phase of each sample.
The Fourier transformed infrared spectroscopy (FTIR) provides information about the polymer structure (molecular bonding), allowing to distinguish between different crystalline forms [13].
3.3.1
FTIR results
20 Figure 11-FTIR-ATR absorbance spectrum for fibers produced with P(VDF-trFE) solution of
20%, 15 cm TCD, 1 mL/h flow-rate and 15 kV (blue line), 19kV (red line) and 23 kV (black line)
applied voltage. All samples have the same β-phase characteristic peaks.
In order to quantify the β-phase content, it is assumed that FTIR absorption follows the
Lambert-Beer law and the absorption coefficients, Kα and Kβ, at the wavenumber of 766 and 840 cm-1 are used [13].
The fraction of β-phase can be calculated using the equation bellow: 𝐹(𝛽) = 𝐴𝛽
(𝐾𝛽𝐾𝛼)𝐴𝛼 + 𝐴𝛽 =
𝐴𝛽
1.26𝐴𝛼 + 𝐴𝛽 (3.3)
Where, Aα and Aβ are the absorbance at 766 and 840 cm-1 the Kα and Kβ are the
absorption coefficients at the respective wavenumbers, with values of 6.1 × 10⁴ and 7.7 × 104 cm2 mol-1[13].
According to table 3 in annex 1, it was possible to see that all samples show a value of
β-phase around 80%. As mentioned before, this is caused by the insertion of an extra fluorine atom
that improves β-phase formation. It was possible to see a slightly increase in β-phase for an applied voltage of 19 kV instead of 15 or 23 kV, when the TCD was 15 cm and the concentration 20%. This shows that 19 kV is the optimal voltage for that distance. Similar results were obtained for other concentrations. The different collectors, TCD and flow-rate did not show substantial differences.
Another way to increase the β-phase formation is by annealing. Annealing the samples
21 also decreases the piezoelectric response, due to thermal depoling or dipole randomization [35].
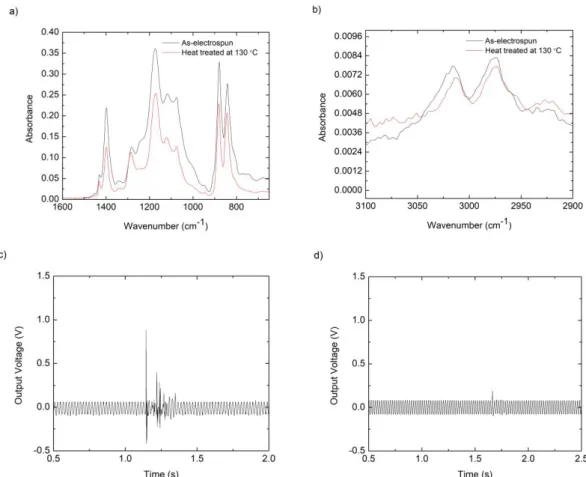
For a concentration of 18%, a TCD of 15 cm, an applied voltage of 19 kV and a flow rate of 1mL/h, annealing the sample for 15 minutes at 130° C, increased the fraction of β-phase of the sample from 77.9% to 87.2%, the FTIR-ATR spectra are shown in figure 12.
Lei et al. proved, using force spinning, that mechanical stretching without electrostatic force can produce β-phase in fibers. But without electrostatic force, the fibers did not show any piezoelectric activity. This happens because the mechanical force induces β-phase formation, but it fails to align the dipoles [47]. This means that, even if some fibers have higher β-phase content than others, they can have worst piezoelectric response.
Maldal et al proved the preferential orientation of CF2 dipoles in electrospun PVDF-trFE nanofibers, using FTIR spectroscopy and detecting the piezoelectric signals. In order to do that, they took two similar electrospun membranes and heated one of them above the curie temperature, aiming to cause a random dipole orientation [5].
After FTIR analysis, the dipole orientation was evaluated using the equation below: 𝑓dipolar =𝐴𝑣𝑎𝑠𝐴𝑣𝑠 (3.4)
Where, fdipolar is the ratio between the absorption intensity due to CH2 or CF2 asymmetric stretching vibration mode (Avas) and the absorption intensity due to the CH2 or CF2 symmetric stretching vibration (Avs).
Figure 12 shows the difference between one sample tested as electrospun and one sample that was heated for 15 minutes at 130° C. Using the equation 3.4, for the wavenumbers A3011/A2973, A1182/A1284 and A884/A845, it was possible to observe a reduction of 4%, 22% and 9%, respectively, for the sample that was heated at 130° C. This can be explained by the randomization of the dipoles, caused by the applied temperature above Tc. On the other hand, the higher values of fdipolar for the other sample can be explained by the alignment of the CF2 dipoles towards the electric field, during electrospinning [5].
22 Figure 12- a) and b) FTIR-ATR spectra of a sample with 18% concentration, 15 cm TCD and
19 kV applied voltage, showing the decrease in absorption values for the sample heated during 15 min
at 130 °C (red line) compared with a untreated sample (blue line). c) Impact test on as-electrospun
sample and d) impact test on the heated sample
A trial to calculate the fdipolar between samples with different parameters was performed. However, some of the samples had higher percentages in a given absorption region and lower percentages in other regions. Due to that, in order to compare the dipole alignment between different samples, TSDC was used.
3.4
Output Voltage measurements
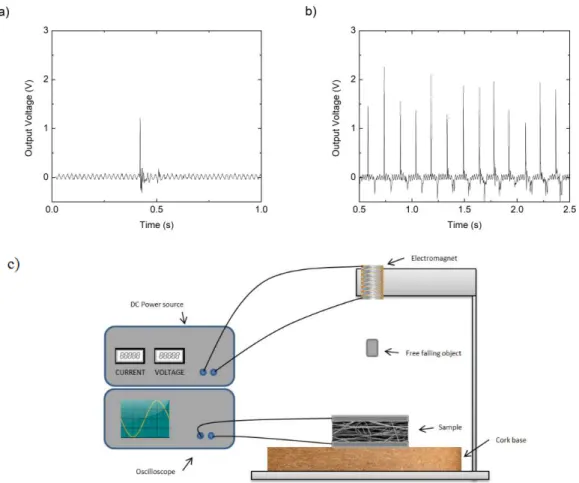
In order to measure the output voltage two electrodes, made of aluminum foil, were placed at the top and bottom of the electrospun membranes. The samples were then tested by dropping a cylindrical shape metal weight from 10 cm height, which produced an impact force of approximately 2× 10⁻¹ N. This test, figure 13 a) and c), was done 5 times for each sample in order to ensure results’ repeatability. In order to ensure that the voltage measurement came from the electrospun membranes another test was done, with a paper layer placed between the electrodes. As expected, the paper did not show any voltage output.
23 pencil, to illustrate the fast response of the membranes to the impact.
In figure 13 a) and b), it is also possible to see two opposite polarities. The positive one was caused when the material was pressed and the negative when the pressure was released [48]. When the cables were reversed, the opposite happened.
Figure 13- a) Output voltage using a free falling object and b) tapping test using a pencil. c)
Setup used to perform the free falling impact tests.
Table 3 in annex 1, shows the output voltage values for all the different samples. The samples with higher and lower output values were the ones made with the electrospinning parameters shown on table 2.
Table 2- Electrospinning parameters with best and worse output voltage values.
Electrospinning parameters
15 % 10 cm 19 kV 1 mL/h
15% 15 cm 19 kV 1
mL/h
18% 15cm 19 kV 1
mL/h
23% 15 cm 15 kV 1
mL/h
23% 15 cm 19 kV 1
mL/h
Output voltage (V)
24 the 23% samples had a higher output voltage. The reason could be related with the increased electric field with decreased distance. The higher electric field could be responsible for improving the dipole alignment in a solution with high viscosity.
3.5
Dipole alignment
The piezoelectric effect properties of P(VDF-trFE) are originated from induced polarization [49], as shown in figure 14. Usually, to do this in a semi-crystalline polymer such as P(VDF-trFE), it is necessary to reorient the dipoles through the application of a strong electric field at high temperature. Then, the temperature is lowered in the presence of the electric field, so that the domains stay locked in the aligned state. The material’s piezoelectric effect is directly related to the degree of polarization achieved [35]. The most common methods to induce dipole alignment are the electrode and corona poling [35]. However, electrospinning is a simple and scalable technique that allows the preparation of nanofiber webs at the same time that the electric field aligns the ferroelectric dipoles [5, 47]. Both processes are shown in figure 14.
Figure 14- a) Example of the dipole alignment process by corona polling and b)
electrospinning [35, 47]
Due to the difficulty of measuring the nanofibers’ d33, because of their high porosity and low rigidity, polarization was studied. The main goal was to try to understand if the fibers that showed a higher output voltage for the same impact conditions also showed a higher dipole alignment.
3.5.1
Thermally Stimulated Discharge Current (TSDC)
The Thermally Stimulated Discharge Current (TSDC) enables the dipole alignment study after samples’ polarization. This equipment provides heat to the sample and, at the same time, measures the current generated by the rearrangement of the dipoles to a more stable state [46, 50].
25 starts to lose its piezoelectric properties [46]. The samples were therefore all heated above the Curie temperature in order to cause dipole disorientation.
Aiming to study the internal electric polarization of the material, the following equation was used:
P = ∫T2𝐽(𝑇)𝛽
T1 . 𝑑T (3.5) Where, P is the polarization of the sample, β is the temperature heating ratio and J(T) is the current density [50].
Figure 15 a) and b) shows TSDC results for the same sample, when heated two times up to 160° C. It is possible to see that the current density becomes smaller in the second cycle and polarization density decreases from 9.1×10⁻³ to 2.9×10⁻⁵ C/m2. This shows that, after the first cycle, the dipoles lost most of their orientation. These results are in line with previous FTIR data.
Figure 15-a) First cycle of TSDC test for a 15% concentration sample and b) second cycle for
the same sample. c) TSDC test for a 18% concentration sample.
The polarization density results for the rest of the samples are in annex 1. It is possible to see that the results were inconclusive, since samples with similar polarization density showed different output voltage. As this could be caused by the measurements of the output voltage and TSDC tests in different locations on the sample, it was decided to repeat some tests for three different concentrations with promising results.
26 other parameters were kept the same for all the samples (15cm of TCD, an applied voltage of 19kV and a flow-rate of 1 mL/h). All of them were electrospun three times each, resulting in a total of 9 samples. Each one of the 9 samples was then divided in 3 sub-samples. Figure 18 and table 4 in annex 2, show the sample division and all the TSDC results. After all tests done, it was possible to conclude that the parameter with better average polarization density was the 15% concentration sample, with an average value of polarization of 1.5×10⁻² C/m2. For 18 and 20%, the average values were 7.33×10⁻³ and 9.77×10⁻³ C/m2, respectively. This test also showed that the values changed in different regions of the same sample and between samples with the same parameters, which could explain why the first measurements were inconclusive.
Figure 15 c) shows the TSDC result of one of the 18% concentration samples. It is possible to see that there is a decrease in current density from 30 °C to 80 °C and then, it has a cosimilar ascending behavior as the other sample shown at figure 15 a). The current density curve, between 30 and 80 °C, is not related with dipole randomization because the Curie temperature is above 100 °C. From our perspective the current density detected, from 30 to 80 °C, can be explained as surface charges that were trapped at the interstitial sites, during the electrospinning process. These charges are then released during TSDC measurements.
Zaccaria et al. reported that the charge stored in the bulk material and on the surface of the material due to electrospinning and triboelectric effect, can cause an electret behavior to the material and overcame the piezoelectric effect [48]. Electrets are polymeric dielectric materials that are able to retain charges over a long period of time and create an external macroscopic electric field [51].
In order to minimize the triboelectric effect, the electrodes and the electrospun mat were kept together (to decrease the friction between membrane and electrodes) and all samples were tested in the same way. As shown in table 3, some samples had higher output voltage than others. If all samples were tested in the same conditions and configuration, the triboelectric effect was probably not the reason behind the different output voltage values. From our own perspective, the differences between output voltage values can be due to the porosity of the membranes and the non-uniformity of the electric contacts with the samples.
3.5.2
Impact tests for the repeated samples
In order to understand if higher polarizations would give rise to higher output voltage values, a different impact machine was used. This machine applied pressure on the samples, 25 times at a frequency of 1 Hz. The applied pressure was measured using a calibrated piezoelectric sensor connected to one channel of the oscilloscope and the piezoelectric signal was measured using the other channel of the oscilloscope [31]. All results were then filtered in order to remove the signal noise and the peak-to-peak voltage was measured.
27 samples show high output voltage values and similar response for all the 25 cycles. Figure 16 shows the piezoelectric signal for the three different concentrations tested, using approximately 10 kPa of pressure, it is possible to see that the output voltage was similar for the three different samples. The peak-to-peak voltage measured was 3.48, 3.78 and 3.68 V for 15, 18 and 20% concentration, respectively. In this specific case, samples with higher output voltage are related with higher polarization density, with values of 2.59×10⁻³, 1.68×10⁻² and 4.56×10⁻³ C/m2 for, respectively, 15, 18 and 20 %. As expected, this means that the higher polarization values improve the piezoelectric response.
Figure 16 d) shows the relation between applied pressure and output voltage for the 15% polymer concentration samples. It was possible to understand that the output voltage is directly related with the applied pressure and the membranes were able to generate 0.4 V for each kPa applied.
Figure 16- Different output voltage for a) 15% b) 18% and c) 20% concentration samples.
The applied pressure was similar for the three samples, approximately 10 kPa. Figure d) shows the
relation between applied pressure and output voltage for the same region of three depositions of 15%
concentration.
3.6
P(VDF-trFE) deposition on cork substrate
28 also because it has lower concentration.
In order to do the deposition on cork substrate, a conductive layer was applied on top of two different types of cork. One was conventional insulation cork agglomerate, with 4 mm thickness and the other was a composite agglomerate of cork and polyurethane with 2 mm of thickness. The ideal would be to use two cork sheets made with the same material but with different thickness, but unfortunately it was not possible to find on the market the same material with a different thickness.
In order to do the deposition it was necessary to connect the electrode on top of the cork substrate to the collector. To do that, an aluminum foil was placed on top of the collector and carbon tape was used to connect the electrode to the aluminum foil. There was a problem related with the thicker cork sheet, since it was difficult to fix it to the drum collector at 2000 rpm. The thinner cork sheet was easier to fix, because it was lighter and much more flexible. The main problem with the thinner cork sheet was related with the high surface porosity, when compared with the thicker one. The high surface porosity made the screen printing process less effective and the electrodes printed on this type of cork caused some short-circuits or inconstant signal, during impact tests, due to the high surface roughness that penetrated the membrane.
To do the impact tests shown on figure 17 it was used the same machine that was previously used to study the repeated samples. However, because these samples had cork substrates it was not possible to use the same pressure as before. It appears that when the deposition is done on cork, the output voltage decreases and in this case it was necessary to use a higher pressure (half rotation instead of 1/16 rotation on the stepper motor). It was not possible to measure the applied pressure because the cork substrate absorbs some of the impact, as expected. Hence, this test was used to understand if the fiber still show any piezoelectricity when the deposition is done directly on the cork substrate.
Figure 17- Output values for two different cork substrate thicknesses, a) 4 mm of generic
cork underlayment and b) 2 mm of cork/polyurethane composite, using the following electrospinning
parameters: 15% concentration, 15 cm TCD, an applied voltage of 19 kV and a flow rate of 1m L/h.
31
4
Conclusion and future perspectives
The aim of this work was to make and characterize piezoelectric membranes and successfully deposit them on cork substrate while maintaining its functions. The impact tests performed showed that the usage of electrospinning to do the deposition of P(VDF-trFE) fibers on cork was successful. At the same time, the structure also showed a stable piezoelectric signal. For these reasons, our main goals were achieved.
A final set of parameters was selected to apply on the tested cork substrate: 15% polymer concentration, a TCD of 15 cm an applied voltage of 19 kV, a flow-rate of 1 mL/h and the rotating drum collector. These optimal parameters were identified after an exhaustive membrane’s characterization. The membrane’s characterization was divided in five different
parts: fiber formation, crystallinity, β-phase formation, output voltage measurements and dipole alignment. The fiber formation analysis was performed by using SEM, both in order to understand if the fibers had any defects and to calculate its diameters. Nevertheless, without a defined morphology, the material would not sustain a net dipole. It was therefore also necessary to study the crystallinity of the samples and the fraction of β-phase, since this is the phase with highest piezoelectric properties. In order to verify if the fibers were showing any output voltage under impact, its output voltage was measured. The dipole alignment was also studied, as in order to have a good piezoelectric signal it is necessary to have the dipoles oriented into the same direction.
The fibers that were created by using the above mentioned parameters did not show any defects and had a mean diameter of (7.7±1.3)×102 nm. The sample crystallinity was of 48.5%, according with the DSC results, and the β-phase fraction of 81.4%. When the sample was tested under impact, by dropping into it a cylinder shape material, it produced an output voltage of 1.2±0.2 V. This was the highest voltage among all samples tested. When it was tested under a pulsated pressure (1 Hz) of 10 kPa, it produced a peak-to-peak voltage of 3.48 V for each one of the 25 cycles. The polarization density of this sample varied for different regions, but overall it was higher than the rest of the samples. With this test, it was possible to understand that the dipole alignment during electrospinning may be responsible for increasing the piezoelectric response of the membrane. By heating twice the sample above the Curie temperature, the polarization density decreased from 9.1×10⁻³ to 2.9×10⁻⁵ C/m2. Both FTIR and impact tests showed that heating the sample above the Curie temperature caused a decrease in the piezoelectric signal. Overall, this sample presented very good properties to be used on cork substrate.
32 mm (generic cork underlayment roll, with an epoxy resin as binder) and a thinner one, with 2 mm (Cork4U + Polyurethane). The results showed that the generic cork produced a more consistent piezoelectric signal, with a repeated output voltage of 1 V.
To the best of our knowledge, this is the first work testing an electrospun piezoelectric structure with cork as substrate. This might have several practical implications, since this structure is low cost, ease to fabricate and it is constituted by environmentally friendly materials. This type of structures might have a practical usage as a sensor or an energy harvesting device. A practical application could be, for example, to protect fragile cargo. It could create added value by measuring the impact that the cargo suffers during shipping, while at the same time the cork could absorb the impact in case of falls. It could also be used as a pressure sensor inside buildings and at the same time as a floor covering. Within this potential application, the cork would be used to pave the floor and the fibers would work as an alarm system. It could also be used in crowded spaces, such as metro stations and public builds, as a
floor covering. Due to cork’s aesthetic features and comfort it might perfectly fit in such spaces, while using piezoelectric fibers to harvest energy from steps and vibrations. Finally, if future research helps to increase the output power, it might even be used in noisy places in order to convert sound vibrations into energy. While converting sound vibrations into energy, the cork would simultaneously work as a noise insulation.
Even though the chosen parameters appear to be the best fitting ones to use on cork, it would be important that future research could analyze and identify the root cause for the variability between samples and sample’s regions that was occasionally faced. For the further development of these structures as an impact sensor or energy harvesting device, it would be necessary to develop a device to study the output current. The output voltage does not allow us to clearly understand how good it would be as a device for energy harvesting. A potential alternative to direct electrospinning on cork substrate would be to use a hydraulic press to bind the fibers to the cork. In theory, this technique would not cause properties’ loss, while it would be cheaper and faster. An alternative research line would be to add up new composites, such as P(VDF-trFE) and silver nanowires. As those are being used to improve devices’ sensitivity, its

![Figure 3) Schematic illustration of the basic setup for electrospinning [21].](https://thumb-eu.123doks.com/thumbv2/123dok_br/16693237.743720/26.893.313.563.158.417/figure-schematic-illustration-basic-setup-electrospinning.webp)

![Figure 14- a) Example of the dipole alignment process by corona polling and b) electrospinning [35, 47]](https://thumb-eu.123doks.com/thumbv2/123dok_br/16693237.743720/46.893.185.716.528.748/figure-example-dipole-alignment-process-corona-polling-electrospinning.webp)

