Printed version ISSN 0001-3765 / Online version ISSN 1678-2690 http://dx.doi.org/10.1590/0001-3765201820170953
www.scielo.br/aabc | www.fb.com/aabcjournal
Technical efficiency analysis of marine shrimp farming (
Litopenaeus vannamei
)
in biofloc and conventional systems: A case study in northeastern Brazil
MARCELO A.S.REGO1
, OMAR J.SABBAG2
, ROBERTA B.SOARES3 and SILVIOPEIXOTO3
1
Instituto Federal de Educação, Ciência e Tecnologia de Sergipe, Campus Estância, Rua Café Filho, 260, Cidade Nova, 49200-000 Estância, SE, Brazil
2
Universidade Estadual Paulista Júlio de Mesquita Filho, Departamento de Fitotecnia, Tecnologia de Alimentos e Socioeconomia, Av. Brasil Centro, 56, 15385-000 Ilha Solteira, SP, Brazil
3
Universidade Federal Rural de Pernambuco, Departamento de Pesca e Aquicultura, Rua Dom Manoel de Medeiros, s/n, Dois Irmãos, 52171-030 Recife, PE, Brazil
Manuscript received on November 24, 2017; accepted for publication on May 31, 2018
ABSTRACT
Shrimp farming has a great ecological, economic, and social importance in northeastern Brazil. Although
the conventional farming system is widely used, biofloc technology (BFT) system has been developed
to reduce environmental impacts and optimizing the production. Thus,the present study evaluated the
technical efficiency of production cycles of Litopenaeus vannamei in conventional and BFT systems.We analyzed 48 production cycles in the conventional system in 2013 and 2014 and 9 cycles in the BFT system in 2014 through data envelopment analysis (DEA). The inputs corresponded to the population density (post-larvae m-2
), amount of feed (kg ha-1
cycle-1
), labor (man ha-1
) and power supply (HP ha-1
), whereas the yield (kg ha-1
cycle-1
) was considered the output. The results indicated four production cycles (7.0%)
technically efficient, three in the conventional system and one in the BFT. By comparing the productive systems, there was significant difference in their mean scores of technical efficiency. There was a greater influence of the management inefficiency on the conventional system, while the production scale reduced the average scores of technical efficiency in the BFT system. These results may help to improve the
development of sustainable L. vannamei farming in both systems by reducing waste and increasing profits.
Key words: data envelopment analysis, inefficiency, productive systems, shrimp farming.
INTRODUCTION
Marine shrimp farming represents a major rural activity that generates employment and income in Brazil, though its development still finds difficulties (Sampaio et al. 2008, Natori et al. 2011). The conventional farming system widely used in northeastern coastis possibly the cause of many negative effects, such as effluent disposal, escape of exotic species to the ecosystem and spread of diseases, among others (De
Lacerda et al. 2006, Sousa et al. 2006, Abreu et al. 2011, Da Silva et al. 2016). Therefore, there have been production losses due to the contamination by shrimp pathogens and the difficulty in regulating enterprises (Abreu et al. 2011).
Many countries adopted the bioflocs technology system (BFT), which presents several advantages when compared to the conventional shrimp farming (Avnimelech 2012, Hargreaves 2013, Zhou and Hanson 2017). The possibility of little or no water exchange is one of the main features of the BFT system, reducing contamination of shrimp by pathogens and the discharge of effluents in the ecosystem, thus contributing to the acceptance of this activity by the public and competent environmental authorities (Burford et al. 2003, Samocha et al. 2007, Avnimelech 2012). However, the ability to withstand high stocking densities, and thereby increase productivity, is the main attraction of the BFT system for entrepreneurs (Browdy and Moss 2005).
The effective increase in productivity (kg ha-1 cycle-1) in an enterprisemay not reflect gain of
competitiveness, since it does not consider which and how the resources are used (Ferreira and Gomes 2009). A good management of resources prevents waste and reduces costs, consequently increasing profits, thereby making the activity efficient and competitive.
The productive efficiency can also reduce environmental impacts of conventional shrimp farming in estuaries. This is possible through the reduction or elimination offood wastes, responsible for releasing nitrogen and phosphorus in the ecosystem and causing eutrophication (Martinez-Cordero and Leung 2004, Silva and Sampaio 2009). The elimination of wastes also reduces the water exchange in the ponds and diminishes the probability of pathogen contamination (Samocha et al. 2007).
The data envelopment analysis (DEA) is a non-parametric methodology1 used to analyze the degree of technical efficiency of production units. Through the DEA, each production unit or DMU (decision-making unit) is positioned in relation to one or more efficient DMUs (benchmark) and has one established score (Ferreira and Gomes 2009). These scores are used to place the efficient and inefficient DMUs, identifying possible savings of inputs or production increases in the latter (Sharma et al. 1999).This methodology builds a nonparametric efficient frontier, where the DMUs are found on or below this frontier (Charnes et al. 1978, Latruffe et al. 2005, Cinemre et al. 2006, Silva and Sampaio 2009).
Even though it is an important issue, there is little information in the shrimp farming industry to assist producers in managing their projects, using available resources in the best possible way, reducing costs and increasing competitiveness gains, thus mitigating negative impacts. We have previously evaluated the financial indicators and the risk of BFT and conventional systems (Rego et al. 2017a, b), but in this study
we focused on the technical efficiency of the production cycle of Litopenaeus vannamei in conventional and
BFT systemsin northeastern Brazil.
MATERIALS AND METHODS
The study was conducted at a farm in the state of Pernambuco, northeastern Brazil, where the degree of
technical and scalar efficiency was analyzed during the production cycles of L. vannamei over two years
(2013 and 2014). We evaluated the efficiencies of six ponds (average of 2.86 ha each) operating in the
1
A nonparametric method (linear programming technique that indirectly measures the
variability of the results) is more simplified in relation to the requirements and assumptions of
conventional farming system and three ponds (625 m2 each) in the BFT system. Each production cycle of both systems corresponded to a decision-making unit (DMU), performing similar tasks and differentiated by the amount of inputs used and generated output. The samples corresponded to 24 production cycles in the conventional system each year (2013 and 2014), and 9 cycles in the BFT system in 2014.
Due to a likely high amount of inputs used in some DMUs, we used the input and output orientation in the data envelopment analysis (DEA) to evaluate the possible reduction of resources without compromising the production and the increase of production to a technically recommended level without consuming more inputs, respectively (Latruffe et al. 2005, Ferreira and Gomes 2009).
To evaluate separately the technical efficiency of conventional and BFT systems, we used the DEA multipliers with constant returns to scale (CRS), i.e. an increase in inputs causes a proportional increase in the production of each system (Ferreira and Gomes 2009). In CRS, the results of the technical efficiencies of DMUs obtained in both input and output directions are equal (Ferreira and Gomes 2009). The input was expressed as:
Maximize Efo =
∑
=
s
j 1 j
µ
yjo(µ, ν)
Subject to:
∑
=
r
i i 1
ν
xio = 1∑
=
s
j 1 j
µ
yjk –∑
=
r
i i 1
ν
xik ≤ 0, ∀ k k = 1, 2, ..., nµj, νi ≥ 0, ∀ i, j
The formula for the multipliers model with CRS and the output orientation were as follows:
Minimize Efo =
∑
=
r
i 1 i
ν
xio(µ, ν)
Subject to:
∑
=
s
∑
=
s
j 1 j
µ
yjk –∑
=r
i i 1
ν
xik ≤ 0, ∀ k k = 1, 2, ..., nµj, νi ≥ 0, ∀ i, j
Where: Efo = radial measure of technical efficiency of the DMU goal; yj = value of product j; xi = value of
input i; µj = relative importance of product j; νi = relative importance of input i.
The variables used to evaluate each system separately correspond to the inputs stocking density (post-larvae m-2) and amount of feed used (kg ha-1 cycle-1), whereas the output corresponded to the yield (kg ha-1 cycle-1) (Table I). According to Sharma et al. (1999), it is important not to use a number of DMUs relatively small compared to the number of input variables (supplies) and output (product), thereby making efficiency results more stable. The small number of variables used in this step was due to the separate assessment of each system, resulting in a small number of DMUs in BFT.
Virtual efficient DMUs were created from those proved inefficient through linear combinations of efficient DMUs that were partners of excellence (peers). We also obtained positive values (λ) generated by the DEA, indicators of the important benchmarks for each inefficient DMU (Ferreira and Gomes 2009). The possible input slack of virtual DMUs can occur when it is still possible to use fewer inputs after the analysis of efficiency (Ferreira and Gomes 2009). These slacks and the optimal amounts of inputs to be used
by inefficient DMUs are identified as the decision variables λ, sio
and smo+in a linear programming (Ferreira and Gomes 2009). The second step of DEA is expressed as:
Maximize
∑
= −
r
i i
s
1+
∑
= +
s
j j
s
1(λ, sik
-, sjk+)
Subject to:
∑
=
n
k 1
λ
kxik + si- = θ*xio i = 1, 2, ..., r∑
=
n
k 1
λ
kyjk – sj+ = yjo j = 1, 2, ..., s
si-, sj+, λk ≥ 0 k = 1, 2, ..., n
Where: yj = value of product j; xi = value of input i; λ = importance of DMU k as a reference for DMU goal; si- = slack of input i; sj+ = slack of product j.
2009). This model also evaluated the technical efficiency without considering the production scale factor of each pond of the conventional system (Latruffe et al. 2005, Cinemre et al. 2006). This analysis is expressed as:
Minimize Efo =
∑
=
r
i i 1
ν
xio + ν0(µ, ν)
Subject to:
∑
=
s
j 1 j
µ
yjo = 1∑
=
s
j 1 j
µ
yjk -∑
=
r
i i 1
ν
xik + ν0 ≤ 0, ∀ kµj, νi ≥ 0 (ɛ), ∀ i, j
Where: Efo = radial measure of technical efficiency of the DMU goal; yj = value of product j; xi = value of
input i; µj = relative importance of product j; νi = relative importance of input i.
Constant returns to scale add: ν0 = 0
Variable returns to scale add: free ν0
Not increasing returns to scale add: ν0 ≥ 0
Not decreasing returns to scale add: ν0 ≤ 0
The variables used to assess the overall technical efficiency of the farm werestocking density (post-larvae m-2), amount of feed used (kg ha-1 cycle-1), labor (man ha-1) and power (HP ha-1) as inputs, and yield
(kg ha-1 cycle-1) as output (Table I).
TABLE I
Means (± SD) of the variables used to estimate the general and technical efficiency of conventional and biofloc (BFT) systems in a farm located on the coast of Pernambuco, Brazil.
Conventional BFT
Inputs
x1 - stocking density (post-larvae m-2
) 20.5 ± 3.2 113.1 ± 7.2
x2 - feed amount (kg ha-1
cycle-1
) 2,185.3 ± 649.6 14,280.2 ± 2,701.2
x3 - labor (man ha-1
) 0.2 ± 0.0 2.9 ± 0.0
x4 - energy (HP ha-1
) 0.5 ± 0.0 32.0 ± 0.0
Product
y - Productivity (kg ha-1
cycle-1
We used the SIAD 3.0 software to implement the models of data envelopment analysis (DEA). This software uses linear programming to estimate the production frontier and reference values (benchmark), efficiency scores and slacks and targets (Meza et al. 2005).
The efficiency scores obtained ranged from 0 to 1, with 1 being assigned to the efficient production unit located in the production line. We analyzed the efficiency of the productive cycles in the farm over two years (2013 and 2014), divided in four semesters and eight seasons, as well as the technical efficiency of each pond of the conventional system compared to the BFT system.
The scalar efficiencies of the ponds used in the conventional system were analyzed and obtained by the ratio between the technical efficiency score of the CRS model and the VRS score of each production cycle (Latruffe et al. 2005). If the result of this ratio is 1, the production cycle operated in optimum scale.
The mean values of efficiency of conventional ponds obtained through the DEA model with VRS were pure technical, i.e. do not represent scalar inefficiency (Latruffe et al. 2005). Due to the small sample size, it was not possible to evaluate the ponds of the BFT system separately, so that the whole system was evaluated for technical, scalar and pure technical efficiencies.
The efficiency scores were tested for normality (Shapiro-Wilk) and homoscedasticity (F distribution), followed by Student’s t-test to compare the means. We used one-way ANOVA to compare more than two samples and identified the differences through Tukey’s test. When the data were not normally distributed and the variances were not homogeneous, comparisons were performed using the nonparametric Mann-Whitney’s test for two samples and Kruskal-Wallis test for more than two samples, followed by the post-hoc Student-Newman-Keuls test. All analyses were performed with a significance level of 5% (α = 0.05).
RESULTS
The technical efficiency of the conventional system was not significantly different in different seasons over 2013 and 2014 (p = 0.0635). Significant differences were not observed when technical efficiencies were compared among semesters (p = 0.1702) and between 2013 (0.82 ± 0.15) and 2014 (0.79 ± 0.10) (p = 0.1904). The technical efficiencies of the ponds in conventional system were also not significantly different (p = 0.2013) (Table II).
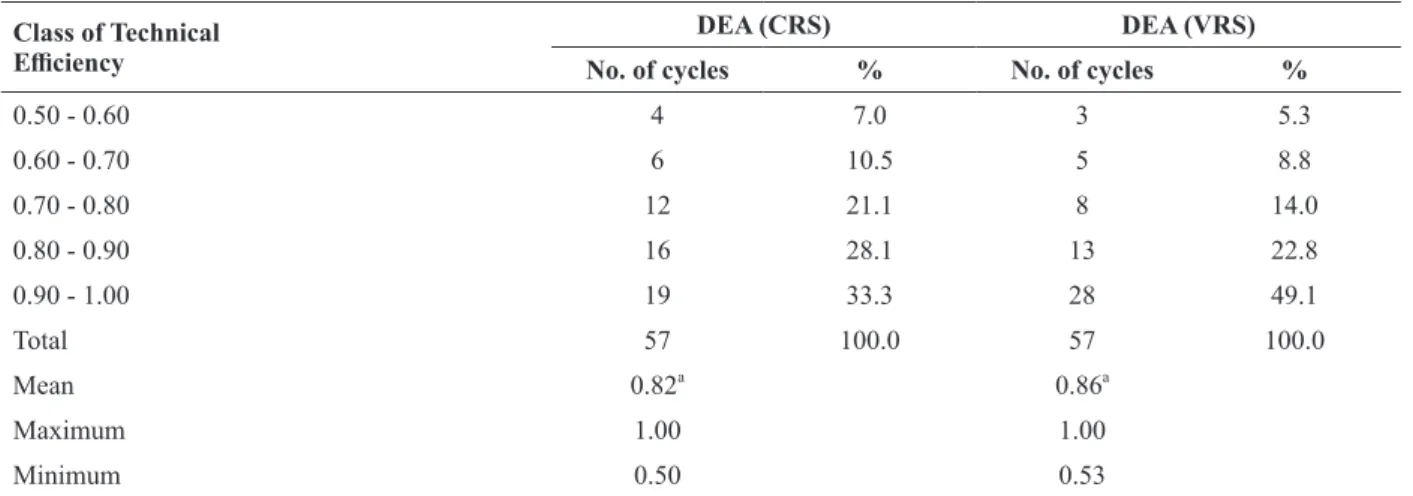
Regarding the technical efficiency scores for all production cycles of the farm in 2013 and 2014, 33.3% and 49.1% corresponded to values equal to and greater than 0.90, analyzedthrough data envelopment analysis with constant (CRS) and variable returns to scale (VRS), respectively (Table III). Significant differences were not observed in the means obtained by the separate results of the systems (CRS) with the average value of the farm (VRS) (p = 0.0888).
The analysis of technically inefficient DMUs in relation to the possible reductions of inputs without compromising production (input orientation) of the conventional system showed greater wastes in 2014 than in 2013 (Table IV). This same pattern was observed when analyzinga possible increase in production (output orientation) in the conventional system, with production lossesof 21.91 and 27.09% in 2013 and 2014, respectively. Regarding the BFT system, highest wastes occurred with post-larvae in comparison with the use of feed, whereas the yield loss was lower than that observed in the conventional system (Table IV).
TABLE II
Means (± SD) of technical efficiency of the conventional system ponds in a farm located on the coast of Pernambuco, Brazil, obtained through data envelopment analysis with constant returns to scale.
Pond Mean Maximum Minimum
1 0.79 ± 0.14a
1.00 0.58
2 0.74 ± 0.12a
0.89 0.50
3 0.76 ± 0.13a
0.96 0.53
4 0.86 ± 0.11a
1.00 0.66
5 0.86 ± 0.10a
1.00 0.73
6 0.83 ± 0.13a
0.95 0.57
Different letters in the same column indicate significant differences (p < 0.05).
TABLE III
Distribution of production cycles performed in all ponds (conventional and biofloc systems) by technical efficiency classes, obtained through data envelopment analysis (DEA) with constant (CRS) and variable returns to scale (VRS) over the
years 2013 and 2014 in a farm on the coast of Pernambuco, Brazil. Class of Technical
Efficiency No. of cyclesDEA (CRS) % No. of cyclesDEA (VRS) %
0.50 - 0.60 4 7.0 3 5.3
0.60 - 0.70 6 10.5 5 8.8
0.70 - 0.80 12 21.1 8 14.0
0.80 - 0.90 16 28.1 13 22.8
0.90 - 1.00 19 33.3 28 49.1
Total 57 100.0 57 100.0
Mean 0.82a
0.86a
Maximum 1.00 1.00
Minimum 0.50 0.53
Different superscript letters in the same row indicate significant differences (p < 0.05).
TABLE IV
Percentage of wastes (feed and post-larvae) and production losses in 2013 and 2014 verified through data envelopment analysis with constant returns to scale and input/output orientation of the conventional and biofloc (BFT) systems in a
farm located on the coast of Pernambuco, Brazil.
Conventional BFT
2013
Waste of feed 17.86 n.a.
Waste of post-larvae 19.16 n.a.
Production losses 21.91 n.a.
2014
Waste of feed 21.11 10.87
Waste of post-larvae 21.47 26.37
Production losses 27.09 12.19
of the same year obtained separately for each system was significantly different through DEA model with CRS (p = 0.0104).
By comparing the scalar efficiency scores of the ponds used in the conventional system, only pond 1 was significantly lower than other ponds (Table VI).
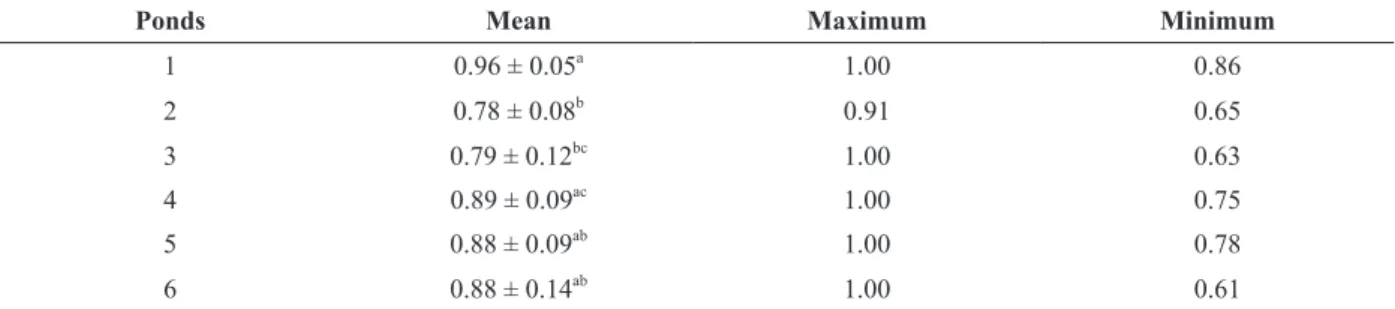
The conventional pond with the lowest scalar efficiency score (pond 1) showed the highest value of pure technical efficiency, differing significantly from ponds 2 and 3 (Table VII). The mean values of technical, scalar and pure technical efficiency of the BFT system corresponded, respectively, to 0.89, 0.91 and 0.98. Statistical analysis indicated significant differences between pure technical efficiencies of conventional and BFT systems in 2014 (p = 0.0011).
DISCUSSION
The technical efficiency scores of the production cycles in conventional ponds of the farm were standardized in 2013 and 2014. Studies evaluating the differentiation of technical efficiency over time have been
performed with other aquaculture species, such as the milkfish (Chanos chanos) produced in Taiwan from
1997 to 1999 (Chianget al. 2004). Knowledge of changes in efficiency over time, as observed by Latruffe et al. (2005) for agriculture and livestock from Poland, are important to understand the possible technological advances of activity.
We observed an increase in the average technical efficiency scorefrom 0.82 (CRS) to 0.86 (VRS) of the studied farm in Pernambuco state. The technical efficiency scores of CRS model are generally lower than the VRS model due to restrictions imposed by the latter for not considering the scale inefficiencies (Sousa Júnior 2003, Latruffe et al. 2005, Ferreira and Gomes 2009). According to Sousa Júnior (2003), 26 production cycles (38.24%) of the shrimp farming enterprises analyzed in the state of Ceará, northeastern Brazil, were efficient through the CRS model. However, 41 cycles (60.30%) were efficient through the VRS model. The same author stated that the maximum score must be obtained in both the CRS and VRS in the DEA model to consider a production unit efficient. In this study, four of the 11 cycles classified as efficient in the DEA model with variable returns to scale were equally efficient in the model with constant returns to scale.
TABLE V
Technical efficiency results obtained through data envelopment analysis (DEA) with constant (CRS) and variable returns to scale (VRS) of the production cycles in conventional and biofloc (BFT) systems held in 2014 in a farm located on the
coast of Pernambuco, Brazil.
Conventional BFT
DEA (CRS)
Efficiency 3 1
Ineffiency 45 8
Average Efficiency 0.79 ± 0.10a 0.89 ± 0.11b DEA (VRS)
Efficiency 10 1
Ineffiency 38 8
Average Efficiency 0.85 ± 0.11a 0.87 ± 0.11a
The production cycles of the conventional system, classified as efficient both by the DEA model with CRS and VRS, obtained either excellent results of feed conversion rate (FCR) or excellent survival of animals with resulting high productivity, or both. For example, one cycle had FCR equal to 0.9, but the farm productivity was below the average (1,138.5 kg ha-1 cycle-1). In the BFT system, only one production cycle was estimated as effective in DEA with CRS resulting in survival of 90%, FCR of1.6 and productivity of 11,200 kg ha-1 cycle-1, respectively. This cycle was also effective when analyzed together with the conventional system in DEA model with VRS.
If the conventional and BFT systems of the studied farm had operated technically efficiently in 2014, avoiding production losses, the annual financial gains per hectare would have increased from R$ 53,594.34
to R$ 76,395.68 (US$ 19,740.482) and from R$ 129,160.19 to R$ 181,252.09 (US$ 46,835.16), respectively.
Theaverage results observed by Gunaratne and Leung (2000), when evaluated the annual financial gains per hectare if the production of P. monodon in Asian countries was efficient, were equal to US$ 10,830.00 and US$ 34,000.00 for the semi-intensive and intensive production systems, respectively.
The reduction or elimination of waste is one of the strategies that enable the increase of the company’s profit by reducing production costs (Sousa Júnior 2003, Ferreira and Gomes 2009). In this study, the efficient use of inputs, i.e. the reduction of inputs without compromising production, could have increased
the annual income of the farm, in 2014, at R$ 5,170.00 ha-1 (US$ 1,335.92 ha-1) in the conventional system,
2Reference value (December 2015 - US$ 1.00 = R$ 3.87).
TABLE VI
Means (± SD) of scalar efficiency in the ponds of the conventional system in a farm located on the coast of Pernambuco, Brazil.
Pond Mean Maximum Minimum
1 0.82 ± 0.13a
1.00 0.60
2 0.95 ± 0.07b
1.00 0.77
3 0.95 ± 0.05b
1.00 0.84
4 0.96 ± 0.04b
1.00 0.89
5 0.97 ± 0.02b
1.00 0.93
6 0.95 ± 0.02b
0.97 0.91
Different superscript letters in the same column indicate significant differences (p < 0.05).
TABLE VII
Means (± SD) of pure technical efficiency obtained through data envelopment analysis with variable returns to scale of the conventional system ponds in a farm located on the coast of Pernambuco, Brazil.
Ponds Mean Maximum Minimum
1 0.96 ± 0.05a
1.00 0.86
2 0.78 ± 0.08b
0.91 0.65
3 0.79 ± 0.12bc
1.00 0.63
4 0.89 ± 0.09ac
1.00 0.75
5 0.88 ± 0.09ab 1.00 0.78
6 0.88 ± 0.14ab
1.00 0.61
and R$ 91,955.00 ha-1 (US$ 23,760.98 ha-1
) in BFT. This would be equivalent to savings of 13.78% and 30.84% in the total operating costs of conventional and BFT systems, respectively. Sousa Júnior (2003) recommended an average reduction of 19.11% of inputs in shrimp farms classified as inefficient in the state of Ceará, thusthey possibly obtain technical efficiency. This reduction in the amount of inputs used by inefficient shrimp farms in Ceará would promote an average reduction of 31.82% in the total operating costs of these companies.
When comparing the technical efficiencies of intensive and semi-intensive L. vannamei production
in Rio Grande do Norte state, northeastern Brazil, Silva and Sampaio (2009) did not observe significant differences in the results obtained from the DEA model with variable returns to scale. These authors
classified the farms as semi-intensive if operating with 20 to 50 shrimps m-2
and intensive with 51 to 100 shrimp m-2, and their average results of efficiency were 0.74 and 0.72, respectively. In this study, the mean levels of technical efficiency obtained by both DEA models for both systems were higher than the levels recorded by those authors, due to the different data used and respective variances, making it difficult to compare the studies (Latruffe et al. 2005). For example, the amount of feed used in the shrimp culture were not considered in the execution of models of efficiency by Silva and Sampaio (2009). However, these authors corroborate our results regarding the non-differentiation of average technical efficiency of the systems obtained by the DEA model with variable returns to scale. The different means of the systems when analyzed by the DEA model with constant returns to scale may be related to the evaluation of the efficiency of the conventional and BFT systems separately.
We verified how the production scale influenced the productive inefficiency of the ponds through the average scalar efficiency of each pond. The pond with a lower average score of scalar efficiency, corresponding to 18% of inefficiency (1.0 minus 0.82), operated with mean values of initial stocking density of 14.8 post-larvae m-2 and use of 1,381.3 kg feed per cycle, with average yield equal to 1,035.1 kg ha-1 cycle-1. These values are below the average conventional farming system and are responsible for the mean technical efficiency score of this pond with the CRS model of 0.79, in which 3% of 21% corresponded to the technical inefficiency. There was little influence of scalar inefficiency in the technical inefficiency if the difference between the scores of scalar and technical efficiencies of each pond in the conventional system were analyzed. Latruffe et al. (2005) observed this same pattern in agriculture and livestock farms in Poland, with only pure inefficiency in management practices being associated to the technical inefficiencies of these activities. The possible cause suggested by these authors is the low educational level of the people engaged in these activities. According to Sousa Júnior (2003), much of the staff in northeast brazilfarms, especially those who feed the shrimp, are semi illiterates.
Turkey. The use of nurseries, food trays, water quality monitoring equipment and aerators can contribute to the reduction of waste and make shrimp farming enterprises efficient (Silva and Sampaio 2009).
The knowledge about productive structures of shrimp farming, as well as their efficiency, is useful to develop strategies for the sustainable development of this activity (Gunaratne and Leung 2000). Before increasing production, it is important to understand that each farming system has its supported capacity. It may be more interesting trying to maintain productivity and avoid waste, obtaining excellent results of profitability (Gunaratne and Leung 2000). We hope this study provides useful information for improving shrimp farming of L. vannamei by enhancing technical efficiency.
In conclusion, inefficiencies were detected in both systems used in a farm located in the state of Pernambuco through data envelopment analysis (DEA). There was a greater influence of the management inefficiency on the conventional system, whereas the production scale influenced the reduction in technical efficiency score of the BFT system. Further studies are needed to identify possible shortcomings in the management practices, contributing to the maintenance and subsequent development of sustainable shrimp farming systems.
ACKNOWLEDGMENTS
The authors would like to acknowledge the Conselho Nacional de Desenvolvimento Científico e Tecnológico (CNPq) for the financial support provided through the grant number 405873/2012-3. The authors thank Jovêncio Silva Filho for his assistance during the experiement.
REFERENCES
ABREU MCS, MATTOS P, LIMA PES AND PADULA AD. 2011. Shrimp farming in coastal Brazil: Reasons for market failure and sustainability challenges. Ocean Coast Manage 54: 658-667.
AVNIMELECH Y. 2012. Biofloc technology - A practical guide book. World Aquaculture Society, Louisiana, 272 p.
BROWDY CL AND MOSS SM. 2005. Shrimp culture in urban, super-intensive closed systems. In: Costa-Pierce B, Desbonnet A, Edwards P and Baker D (Eds), Urban Aquaculture. CAB International, UK, p. 173-185.
BURFORD MA, THOMPSON PJ, MCINTOSH RP, BAUMAN RH AND PEARSON DC. 2003. Nutrient and microbial dynamics in high-intensity, zero-exchange shrimp ponds in Belize. Aquaculture 219: 393-411.
CHARNES A, COOPER WW AND RHODES E. 1978. Measuring the Efficiency of Decision Making Units. Eur J Oper Res 2: 429-444.
CHIANG FS, SUN CH AND YU JM. 2004. Technical efficiency analysis of milkfish (Chanos chanos) production in Taiwan - An application of the stochastic frontier production function. Aquaculture 230: 99-116.
CINEMRE HA, CEYHAN V AND BOZOǦLU M. 2006. The cost efficiency of trout farms in the Black Sea Region, Turkey.
Aquaculture 251: 324-332.
DA SILVA SMBC, DA SILVA ADR, LAVANDER HD, CASTELO-BRANCO CT, PEIXOTO S, GÁLVEZ AO AND COIMBRA MRM. 2016.Vertical transmission of infectious myonecrosis virus in Litopenaeus vannamei. Aquaculture 459: 216-222. DE LACERDA LD, VAISMAN AG, MAIA LP, SILVA CAR AND CUNHA EMS. 2006. Relative importance of nitrogen and
phosphorus emissions from shrimp farming and other anthropogenic sources for six estuaries along the NE Brazilian coast. Aquaculture 253: 433-446.
FERREIRA CMC AND GOMES AP. 2009. Introdução à análise envoltória de dados: teoria, modelos e aplicações. Editora UFV,
Viçosa, 389 p.
GUNARATNE LHP AND LEUNG PS. 2000. Asian black tiger shrimp industry: a productivity analysis. In: Leung P and Sharma KR (Eds), Economics and Management of Shrimp and Carp in Asia: A collection of research papers based on the ADB/NACA Farm Performance Survey. Network of Aquaculture Centres in Asia-Pacific, Bangkok.
HARGREAVES JA. 2013. Biofloc Production Systems for Aquaculture. SRAC Publication, USA, p. 55-68.
MARTINEZ-CORDERO FJ AND LEUNG P. 2004. Sustainable aquaculture and producer performance: Measurement of environmentally adjusted productivity and efficiency of a sample of shrimp farms in Mexico. Aquaculture 241: 249-268. MEZA LA, NETO LB, MELLO JCCBS AND GOMES EG. 2005. ISYDS – Integrated System for Decision Support (SIAD –
Sistema Integrado de Apoio a Decisão): a software package for data envelopment analysis model. Pesq Operac 25: 493-503. NATORI MM, SUSSEL FR, SANTOS ECB, PREVIERO TC, VIEGAS EMM AND GAMEIRO AH. 2011. Desenvolvimento da
carcinicultura marinha no Brasil e no mundo: avanços tecnológicos e desafios. Info Econ 41: 61-73.
REGO MAS, SABBAG OJ, SOARES R AND PEIXOTO S. 2017a..
Financial viability of inserting the biofloc technology in a marine shrimp Litopenaeus vannamei farm: a case study in the state of Pernambuco, Brazil. Aquacult Int 25: 473-483. REGO MAS, SABBAG OJ, SOARES R AND PEIXOTO S. 2017b. Risk analysis of the insertion of biofloc technology in a marine
shrimp Litopenaeus vannamei production in a farm in Pernambuco, Brazil: A case study. Aquaculture 469: 67-71.
SAMOCHA TM, PATNAIK S, SPEED M AND ALI AM. 2007. Use of molasses as carbon source in limited discharge nursery and grow-out systems for Litopenaeus vannamei. Aquac Eng 36: 184-191.
SAMPAIO Y, COSTA EF, ALBUQUERQUE E AND SAMPAIO BR. 2008. Impactos socioeconômicos do cultivo de camarão marinho em municípios selecionados do Nordeste brasileiro. Rev Econ Sociol Rural 46: 1015-1042.
SHARMA KR, LEUNG P, CHEN H AND PETERSON A. 1999. Economic efficiency and optimum stocking densities in fish polyculture: An application of data envelopment analysis (DEA) to Chinese fish farms. Aquaculture 180: 207-221.
SILVA JLM AND SAMPAIO LMB. 2009. Eficiência, gestão e meio ambiente na carcinicultura do Rio Grande do Norte. Rev Econ e Sociol Rural 47: 883-902.
SOUSA JÚNIOR JP. 2003. Análise da eficiência da produção de camarão marinho em cativeiro no Estado do Ceará. Masters dissertation, Universidade Federal do Ceará. (Unpublished).
SOUSA OV, MACRAE A, MENEZES FGR, GOMES NC, VIEIRA RH AND MENDONÇA-HAGLER LC. 2006. The impact of shrimp farming effluent on bacterial communities in mangrove waters, Ceará, Brazil. Mar Pollut Bull 52: 1725-1734. ZHOU X AND HANSON T. 2017. Economic optimization of super-intensive biosecure recirculating shrimp production systems.