Full Terms & Conditions of access and use can be found at
http://www.tandfonline.com/action/journalInformation?journalCode=hihc20
ISSN: 1044-7318 (Print) 1532-7590 (Online) Journal homepage: http://www.tandfonline.com/loi/hihc20
Do Individual Characteristics Influence the Types
of Technostress Reported by Workers?
Danilo Magno Marchiori, Emerson Wagner Mainardes & Ricardo Gouveia
Rodrigues
To cite this article: Danilo Magno Marchiori, Emerson Wagner Mainardes & Ricardo
Gouveia Rodrigues (2018): Do Individual Characteristics Influence the Types of Technostress Reported by Workers?, International Journal of Human–Computer Interaction, DOI:
10.1080/10447318.2018.1449713
To link to this article: https://doi.org/10.1080/10447318.2018.1449713
Published online: 22 Mar 2018.
Submit your article to this journal
View related articles
Do Individual Characteristics Influence the Types of Technostress Reported by
Workers?
Danilo Magno Marchiori a, Emerson Wagner Mainardesb, and Ricardo Gouveia Rodrigues c
aDepartamento de Gestão e Economia, Universidade da Beira Interior, Covilhã, Portugal;bAdministration Department, FUCAPE Business School,
Vitória, Brazil;cDepartment of Management and Economics, Universidade da Beira Interior, Covilhã, Portugal
ABSTRACT
Based on the perspective that the diversity of the workforce has implications for attitudes and behaviors at the individual and group levels, this article examines the role of individual differences related to gender, age, formal education, and length of professional experience in the levels of stress caused by the use of information technology (IT) in the daily activities of workers. This phenomenon, termed in the literature as technostress, is studied by identifying and measuring the factors that create technostress (the technostress creator factors: uncertainty, invasion, overload, and techno-complexity). The technostress phenomenon is related to the most varied types of disorders in workers and losses in organizations, such as fatigue, dissatisfaction, anxiety, and reduced productivity. To achieve the goal of this research, we applied structural equation models in a sample of 927 questionnaires completed by 14 different Brazilian public institutions that were distributed among all regions of the country and that were strongly dependent on IT for their main business processes. The results indicate that workers’ demographic characteristics relate to one another differently and specifically with the various forms of manifestation of technostress. More precisely, older workers or those with longer professional experience reported greater difficulties with the increase of technological complexity for the execution of tasks (complexity). Women reported being subject to higher levels of techno-complexity and techno-uncertainty, while men indicated feeling greater effects from techno-overload and techno-invasion. We did not detect differences related to the levels of formal education of workers. This study presents the implications of the results for theory and for the everyday life of modern organizations that are increasingly dependent on the use of IT.
KEYWORDS
Technostress; Individual Differences; Diversity; Structural Equation Models; MIMIC
1. Introduction
Currently, public and private organizations are expanding the use of information technology (IT) in their business processes (De Haes, Van Grembergen, & Debreceny,2013; Garicano & Heaton, 2010). However, this technological expansion is accompanied by difficulties in adapting workers to the envir-onment and the technological resources that they use. This problem, known as technostress, can have serious negative consequences for workers and organizations, such as reduced productivity and dissatisfaction with work (Tarafdar, Tu, Ragu-Nathan, & Ragu-Nathan, 2007). In decomposing the phenomenon, the literature that explores this theme explains that technostress is formed by five elements: techno-overload, techno-invasion, techno-insecurity, techno-complexity, and techno-uncertainty (Ragu-Nathan, Tarafdar, Ragu-Nathan, & Tu,2008; Tarafdar et al.,2007).
In parallel, managers and researchers in the field of applied psychology are increasingly dedicated to studying the diversity of the workforce and trying to understand its consequences for organizations and workers (Joshi & Roh, 2009; Lau & Murnighan, 1998; Roberson, Ryan, & Ragins,2017; Williams & O’Reilly III, 1998). Diversity refers to the existence of
differences between individuals, in any attribute, allowing the definition of a large number of analyzable dimensions. However, according to Van Knippenberg, De Dreu, and Homan (2004), the literature on this field generally focuses on the analysis of differences related to gender, age, race (or ethnicity), ownership, and professional and educational back-ground. In this regard and as stressed by Roberson et al. (2017), a large number of studies in the field of applied psychology evince the role of workforce diversity in the varia-tions in attitudes and individual and group behaviors in organizations.
The IT literature is also rich in research that finds evidence that the demographic characteristics of users can influence the most diverse aspects of the acceptance and outcome of IT use in organizations (Çoklar &Şahin, 2011; Fuglseth & Sørebø,
2014; He & Freeman,2010; Venkatesh et al.,2003; Venkatesh & Morris,2000). In this connection, Zeithaml, Parasuraman, and Malhotra (2002) indicated the need for research that seeks to identify how individual responses to the use of IT can be influenced by users’ individual characteristics. However, we did not find studies that specifically adjusted the focus of the research and deepened the investigation of the role of demographic variables in the factors that created
CONTACTDanilo Magno Marchiori [email protected]
Color versions of one or more of the figures in the article can be found online atwww.tandfonline.com/hihc. © 2018 Taylor & Francis Group, LLC
technostress, despite the recent proliferation of studies addressing this theme (Ahmad, Amin, & Wan Ismail,2014; Ayyagari, Grover, & Purvis, 2011; Fuglseth & Sørebø, 2014; Jena & Mahanti,2014; Krishnan,2017; Lee, Lee, & Suh,2016; Maier,2014; Maier, Laumer, & Eckhardt,2015; Ragu-Nathan et al., 2008; Riedl, 2012; Tams, Hill, & Thatcher, 2014; Tarafdar, Tu, & Ragu-Nathan, 2010; Tarafdar et al., 2007; Yan, Guo, Lee, & Vogel,2013).
When it is studied, the relationship between the differences in individual users and technostress is only tangential in the area’s research, and contradictory results are obtained. In addition to this connection, the knowledge gap that motivated the realization of the present study was the need to relate the demographic variables specifically to the technostress creator factors. Thus, in the present investigation, we seek to find the answer to the following question: do the individual differences in gender, age, educational level, and length of professional experience indicate the existence of statistically relevant dif-ferences in relation to technostress? In this regard, the objec-tive of this study was to detect whether personal characteristics related to gender, age, educational level, and length of professional experience influence the manner in which they are impacted by technostress by analysis of the technostress creator factors.
Theoretical and practical reasons justify the realization of this research effort. We used structural equations to detect how groups of workers, segmented from the most common demographic characteristics in studies on diversity (Van Knippenberg et al.,2004), suffer from the use of technology in the workplace. That is, understanding the role of individual differences in the context of technostress, subdivided by the technostress creator factors, can provide IT managers with information that can contribute to the adoption of actions to counter the problem that are designed specifically for each audience. In addition, this information can serve as a basis for the training of technical staff in IT departments, with a focus on understanding the reactions and needs of each subset of users, segmented by gender, age, level of formal education, and length of professional experience. In the academic field of IT, understanding the role of individual differences in tech-nostress, examined specifically in the context of each factor creating the phenomenon, can help us understand the see-mingly contradictory results observed in previous research. Moreover, understanding the dynamics of the relationship between the individual characteristics and the factors that create technostress can provide insights for the analysis of other phenomena present in the IT literature.
2. Literature review
2.1. Technostress creator factors
The expansion of technology use in organizations is accom-panied by reports of difficulties in adapting to technology presented by workers who use IT in their work activities (Tarafdar et al., 2007). This phenomenon is known in the literature as technostress, and its concept was presented for the first time in the early 1980s (Brod,1984). Subsequently, in 1997, technostress was conceptualized as being “any negative
impact on attitudes, thoughts, behaviors or physiology caused directly or indirectly by the use of technology” (Weil & Rosen,
1997, p.5). Currently, there is evidence that relates the diffi-culty of adapting workers to the use of IT in organizational environments to reduced productivity and problems related to anxiety and worker fatigue (Tarafdar et al.,2010,2007).
According to Riedl (2012), a central work in the literature on technostress is the study by Ayyagari et al. (2011), in which specific characteristics of technology (usability, intrusiveness, and dynamism) are investigated in regard to whether they influence IT-related stressors, more precisely, work overload, role ambiguity, job insecurity, work-home conflict, and inva-sion of privacy. The authors found evidence pointing to the influence of technological characteristics on the studied stres-sors and their effect on the respondents. Following this line, several studies find significant relationships between technos-tress and various aspects within the organizational and indi-vidual scope. For example, indiindi-vidual productivity, worker satisfaction, organizational commitment, the perceived sup-port received, and the intention to expand IT use are nega-tively affected by the phenomenon (Ahmad et al., 2014; Fuglseth & Sørebø, 2014; Ragu-Nathan et al., 2008, 2010; Tarafdar et al.,2007; Yan et al.,2013). Tarafdar et al. (2007) clarified that the presence of technostress also increases the general levels of occupational stress. Studying the context of teleworking, Suh and Lee (2017) identified that technostress is negatively related to the work satisfaction of professionals who act under this work modality. Lee et al. (2016), studying the stress generated by the use of mobile instant messaging after working hours, identified that this variation of stress caused by technology negatively affects workers’ productivity and quality of life. Jena (2015) has found evidence that indi-cates that technostress negatively affects the work satisfaction and organizational commitment of teachers who use IT in the context of collaborative learning.
Most recently, Brooks and Califf (2017) identified that a specific type of technological stress, provoked by the use of social media at work, is negatively related to the performance of workers. Following this line, Hsiao, Shu, and Huang (2017) gathered evidence that the compulsive use of mobile applica-tions is a new source of technostress. Maier, Laumer, & Eckhardt. (2015), on the basis of previous studies (e.g., Ayyagari et al., 2011; Ragu-Nathan et al., 2008; Tarafdar et al., 2010), proposed a comprehensive model for technos-tress that integrates stechnos-tressors, stechnos-tress, and organizational out-comes. The authors identified that, ultimately, technostress has a broad impact at the organizational and individual levels, affecting, for example, job satisfaction, employee turnover intention, and organizational commitment. Directing their lens of analysis to the final phase of the use cycle of informa-tion systems, Maier, Laumer, Weinert, and Weitzel (2015) identified that the stress caused by the use of social networks is an antecedent to the intention of discontinuing the use of this technology.
Notwithstanding the fact that most of the literature on technostress focuses on the identification of the phenomenon through the use of questionnaires (Sellberg & Susi, 2014), Riedl (2012) innovates by adopting a neurobiological approach to research. The author found evidence that the
levels of cortisol, the hormone most related to stress in humans, increase before the occurrence of failures in infor-mation systems used by workers. In this regard, Tams et al. (2014), in comparing psychometric and physiological meth-ods for stress measurement related to the use of IT, conclude that the complementary use of the two approaches allows a deeper and more holistic understanding of the problem. Following this line of reasoning, a recent study conducted by Baltaci and Gokcay (2016) collected evidence on the poten-tial for detecting stress in computer users through pupil dila-tion and facial temperature. Sellberg and Susi (2014) also followed an unusual route to research on technostress by studying the phenomenon through a field study associated with the use of questionnaires. The authors concluded that the phenomenon is complex and multidimensional and suggest that researchers should use a mixed research approach.
Some researchers have turned their attention to the study of personality with regard to the use of IT. In this regard, Maier (2012) presents a comprehensive literature review that relates personality to research in the area of information systems. More specifically, some studies have analyzed the phenomenon of technostress from the personality character-istics of workers. For example, Krishnan (2017) identified several significant relationships between workers’ responses to technostress and personality traits (the Big Five), in addi-tion to the cultural dimensions of Hofstede. Finally, Hung, Chen, and Lin (2014) identified the role of proactive person-ality in minimizing the effects of communication overload caused by IT.
In this broad context, an approach frequently used in the literature is the operationalization of technostress by means of the measurement of the technostress creator factors (Ragu-Nathan et al.,2008; Tarafdar et al., 2010). The authors pro-pose that technostress can be measured in five different dimensions or types of negative effects perceived and reported by IT users: techno-overload (the feeling that they are increas-ingly working more and faster), techno-invasion (the feeling that it is necessary to sacrifice one’s personal life), techno-complexity (the feeling that the technological environment is very complex), techno-uncertainty (the feeling that there are constant technological changes), and techno-insecurity (the fear of losing their jobs to someone who is technologically better prepared).
2.2. Demographic characteristics in the use of IT
Demographic or individual characteristics can influence the manner in which users perceive and react to the use of IT, but we still need to understand how this occurs (Zeithaml et al.,
2002). For example, the influence of gender has been observed in several aspects relating to individuals’ behavior, for exam-ple, emotions, motivation, and cognition (Gabriel & Gardner,
1999; Saleem, Beaudry, & Croteau, 2011). In this sense, there is evidence that women tend to be more oriented toward interpersonal relationships and are less likely to overestimate their job performance. Men, in turn, seem to be more perfor-mance oriented, more aggressive, and more competitive (Barnett & Karson,1989; Fletcher, 2001; Gabriel & Gardner,
1999; Heinrich,1991; Wahn,2003).
Specifically in relation to the use of IT, in a study on the factors influencing the intention of new technology usage, Venkatesh and Morris (2000) identified that women tend to value more the aspects related to the ease of IT use and consider this issue when assessing the usefulness of a techno-logical solution. Men, in turn, seem to be more orientated by the perception of the technology’s utility, that is, how much users believe IT will impact their professional performance. In addition, men tend to be more influenced by extrinsic aspects related to the use of IT, while women are more sensitive to intrinsic aspects (Venkatesh et al.,2003). In differentiating IT professionals and IT users in the professional environment, Maier, Laumer and Eckhardt (2015) identified different results for the groups with regard to organizational results. More specifically, the researchers found that technology-induced exhaustion has a direct effect on the job satisfaction, organizational commitment, and turnover intention of IT users, but for IT professionals, this effect is only indirect. Laumer, Maier, Eckhardt, and Weitzel (2016) studied employee resistance to IT-induced change and identified mixed results for the role of the variables gender, age, and professional experience in perceived ease of use, usefulness, and perceptual resistance to change.
Proceeding on the topic, Huffman, Whetten, and Huffman (2013) gathered studies that indicate that men exhibit more positive attitudes regarding the use of computers and a lower level of anxiety regarding the use of technology and are more comfortable with the use of computers (Coffin & Macintyre,
1999; Cooper, 2006; Young, 2000). He and Freeman (2010) noted that women showed lower confidence and greater anxi-ety regarding the use of computers, and Çoklar and Şahin (2011) identified increased levels of technostress among women. However, in contrast, some studies have indicated that men are more prone to this type of technological stress (Ragu-Nathan et al.,2008; Tarafdar, Tu, Nathan, & Ragu-Nathan, 2011). Studying the role of gender and personality traits in the potential impact of the hedonic use of computing platforms, Schwark, Dolgov, Hor, and Graves (2013) identified differences between the behavior of men and women as well as the effect of personality characteristics linked to neuroticism, narcissism, self-esteem, and extraversion. Other differences in relation to users’ age, time of professional experience, and amount of formal education received are also frequently observed in the literature (Burton-Jones & Hubona, 2005; Çoklar & Şahin, 2011; Elie-Dit-Cosaque, Pallud, & Kalika,
2011; Jena & Mahanti, 2014; Joiner et al., 2013; Mikkelsen, Øgaard, Lindøe, & Olsen, 2002; Morris, Venkatesh, & Ackerman, 2005; Ragu-Nathan et al., 2008; Şahin & Çoklar,
2009; Simon & Usunier,2007; Tarafdar et al.,2011; Venkatesh et al., 2003; Venkatesh, Thong, & Xu,2012).
The literature also suggests that younger generations cope better with IT than previous generations (Prensky, 2001; Zemke, Raines, & Filipczak, 1999). Studies related to the acceptance of IT indicate that users’ age is negatively related to their perception of the ease of use of technology (Burton-Jones & Hubona, 2005; Venkatesh et al., 2003). Zhou, Chourasia, and Vanderheiden (2017) identified that the need for metaphors used in the processes of developing mental models applied to reduce interaction problems related to the
use of IT applications and services should be adapted for older users. Czaja and Sharit (1993) found higher levels of stress among older users when performing computer-mediated tasks. Recently, it has been understood that an antecedent of the acceptance and intent of IT usage is supporting condi-tions, that is, users’ belief about the adequacy of the support they receive for the use of IT (Venkatesh et al.,2012). In this context, researchers have explained that users’ age and gender are important moderating factors in this relationship, consid-ering that older users tend to have greater difficulties in processing new and complex information, which can affect their ability to learn new technologies (Morris et al., 2005; Venkatesh et al., 2012). In this sense, Simon and Usunier (2007) observed that users’ age is negatively related to their preference for the use of IT-based services. Similarly, older workers have reported higher levels of anxiety regarding the use of computers (Elie-Dit-Cosaque et al.,2011; Joiner et al.,
2013; Mikkelsen et al.,2002) and higher levels of technostress (Çoklar &Şahin,2011; Jena & Mahanti,2014). On the other hand, younger users reported more technostress in the studies by Ragu-Nathan et al. (2008), Şahin and Çoklar (2009), and Tarafdar et al. (2011).
Other studies have found evidence of the moderating effect of users’ educational level on their reactions to the use of IT (Agarwal & Prasad, 1999; Elie-Dit-Cosaque et al., 2011; Mikkelsen et al., 2002; Ragu-Nathan et al., 2008; Tarafdar et al.,2011). Workers’ educational level is related to various aspects of their organizational life, such as behaviors, beliefs, and professional performance (Ng & Feldman,2009). Holden and Rada (2011) indicated that in IT, users’ educational level, among other factors, should be considered in studies related to users’ behavior in relation to the acceptance of technology usage. Agarwal and Prasad (1999), for example, suggested that educational level may be indicative of the cognitive potential of users, facilitating the learning process of new technologies. In addition, users with higher levels of formal education are more exposed to the use of computers in general, which facilitates their technological adaptation (Tarafdar et al.,
2011). In this sense, Elie-Dit-Cosaque et al. (2011) suggested that workers, in the course of their academic life, should acquire skills in the use of IT, becoming more comfortable with its use. In a study involving French IT workers, research-ers found evidence that workresearch-ers with higher levels of formal education suffer less anxiety regarding the use of IT. Agarwal and Prasad (1999) identified that the ease with which users use new technologies increases according to their educational level. According to Hsiao (2017), Krishnan (2017), Ragu-Nathan et al. (2008), Tarafdar et al. (2011), users with a higher level of formal education report less technostress. Similarly, Mikkelsen et al. (2002) detected that anxiety regarding the use of computers is negatively related to education.
However, although several studies reported in the previous paragraphs indicate the importance of demographic variables for the use of IT, some studies did not detect this relationship (Hsiao et al., 2017; Korobili, Togia, & Malliari, 2010; Maier et al., 2015; Maier, Laumer, Eckhardt, & Weitzel, 2015; Parayitam, Desai, Desai, & Eason, 2010; Scott & Walczak,
2009; Wang, Shu, & Tu, 2008). For example, Scott and Walczak (2009) did not observe significant differences in age
in relation to users’ self-efficacy regarding the use of compu-ters. Similarly, Parayitam et al. (2010) found no influence of the variables age and gender on the levels of users’ anxiety regarding the use of IT. Korobili et al. (2010) did not observe differences in the educational level of users with anxiety due to the use of computers or in their attitudes toward IT. The variables gender, age, and educational level did not have explanatory power over the general level of technostress in research conducted by Wang et al. (2008). Maier et al. (2015) did not detect differences in gender and age for the exhaus-tion provoked by the use of IT, even with IT professionals and users evaluating themselves. In the same vein, Hsiao et al. (2017) did not detect a strong influence of the gender variable on technostress, in contrast to what was expected by the authors. Maier et al. (2015) studied the social overload caused by the use of social networking sites, a type of stress provoked by the use of IT, but they did not find significance for the variables gender and age, in contrast to the authors’ expecta-tions. Although Hsiao (2017) detected a correlation between age and educational level and technostress, the author did not find the same effect for the gender variable. On the other hand, Krishnan (2017) did not find evidence of the effect of the variables age and gender on technostress but identified a slight effect of the level of formal education.
Thus, considering that the empirical evidence on the dif-ferences related to demographic characteristics and the results regarding IT usage in organizations are inconclusive and sometimes contradictory, this study is proposed to contribute to the debate, presenting new evidence obtained from the observation of these variables’ behavior when compared with the technostress creator factors. In this regard, we expect that by adjusting the focus of the analysis for each of the measured subdimensions, this study will help broaden the understand-ing of the role of differences related to gender, age, educa-tional level, and time of professional experience by IT users with regard to the result of the use of these technologies in organizations.
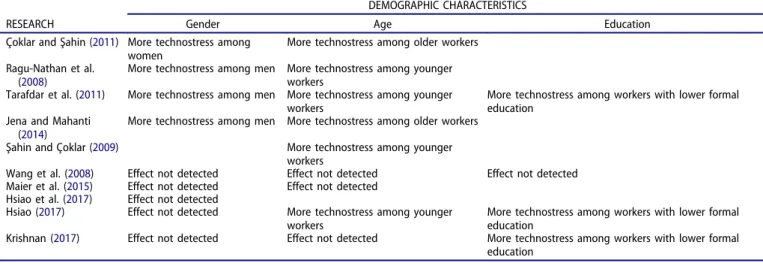
To summarize the results found in the previous surveys of the relationship between technostress and the demographic characteristics related to gender, age, and formal education, we elaborate Table 1. On the other hand, the scarcity of studies that relate the time of professional experience and that directly relate to technostress suggests that this is a gap to be filled in the literature.
2.3. Hypotheses and research model
Considering that previous studies have dealt with technostress in general, although the phenomenon is a second-order con-struct (Ragu-Nathan et al.,2008), as well as considering the need to clarify the controversial results of the literature, we chose to test each factor of technostress separately, deepening the results and seeking to clarify the divergences of the literature.
Thus, from the studies that indicate that the younger gen-erations accept and deal better with new technology, they indicate to finding it easier and having a preference for the use of technology in daily activities, as well as presenting lower levels of stress and anxiety with the use of computers
to reduce interaction problems related to the use of IT appli-cations and services (Burton-Jones & Hubona,2005; Czaja & Sharit,1993; Elie-Dit-Cosaque et al., 2011; Joiner et al.,2013; Mikkelsen et al., 2002; Morris et al., 2005; Prensky, 2001; Simon & Usunier,2007; Venkatesh et al.,2003, 2012; Zemke et al.,1999), we present the following research hypothesis: H1: Compared to younger workers, older workers are more affected by (a) techno-overload, (b) techno-invasion, (c) techno-complexity, and (d) techno-uncertainty.
In spite of the lack of studies that have related technostress and professional experience, we expect that the time of experi-ence of a worker is related to the age of the workers. Thus, according to the previous findings related to age, and con-sidering that the time of professional experience is one of the main aspects of interest in the literature on diversity in the workforce (Van Knippenberg et al., 2004), we present the following research hypothesis:
H2: Compared to less experienced workers, more experi-enced workers are more affected by (a) techno-overload, (b) invasion, (c) complexity, and (d) techno-uncertainty.
From the studies that indicate that men present more positive attitudes, lower levels of anxiety, as well as feeling more comfortable and confident with the use of computers (Chua, Chen, & Wong, 1999; Coffin & Macintyre, 1999; Cooper, 2006; He & Freeman, 2010; Huffman et al., 2013; Young,2000), we present the following research hypothesis: H3: Compared to men, women are more affected by (a) techno-overload, (b) techno-invasion, (c) techno-complexity, and (d) techno-uncertainty.
Finally, in view of studies that found evidence that people with a higher educational level tend to adapt and learn to new technologies better and more easily, as well as having lower levels of anxiety and feeling more comfortable with the use of computers (Agarwal & Prasad,1999; Elie-Dit-Cosaque et al.,
2011; Mikkelsen et al., 2002; Tarafdar et al.,2011; Venkatesh & Morris, 2000), we present the following research hypothesis:
H4: Compared with workers with a higher level of formal education, workers with lower levels of formal education are more affected by (a) techno-overload, (b) techno-invasion, (c) techno-complexity, and (d) techno-uncertainty.
Table 1.Research on technostress and demographic characteristics.
DEMOGRAPHIC CHARACTERISTICS
RESEARCH Gender Age Education
Çoklar andŞahin (2011) More technostress among women
More technostress among older workers Ragu-Nathan et al.
(2008)
More technostress among men More technostress among younger workers
Tarafdar et al. (2011) More technostress among men More technostress among younger workers
More technostress among workers with lower formal education
Jena and Mahanti (2014)
More technostress among men More technostress among older workers Şahin and Çoklar (2009) More technostress among younger
workers
Wang et al. (2008) Effect not detected Effect not detected Effect not detected Maier et al. (2015) Effect not detected Effect not detected
Hsiao et al. (2017) Effect not detected
Hsiao (2017) Effect not detected More technostress among younger workers
More technostress among workers with lower formal education
Krishnan (2017) Effect not detected Effect not detected More technostress among workers with lower formal education
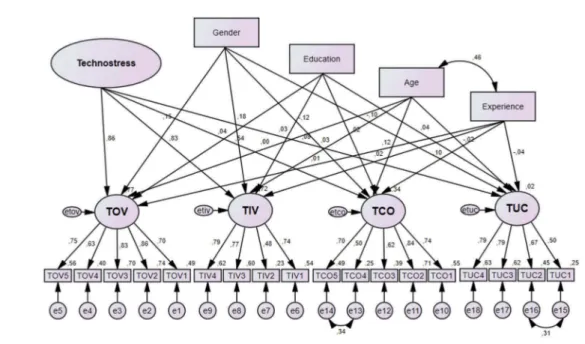
In this sense, the hypotheses developed for the present study can be represented by the research model presented in
Figure 1.
3. Methodology
For the present study, we adopted a quantitative approach, considering that users’ perceptions were represented by numer-ical data, facilitating statistnumer-ical analysis of the data collected. The research is descriptive, given that it was based on a structured plan that measured the characteristics described in the investi-gated research problem. To that end, we conducted a cross-sectional analysis since the data were collected exclusively between the months of November and December 2014. The data can be classified as primary and subjective: primary because they were collected specifically to complete the research project, and subjective because they reflect the opinions of the partici-pants (Hair, Babin, Money, & Samouel,2005).
Fourteen public Brazilian institutions, all with high rates of IT use in their organizational processes, agreed to participate. The workers of these public institutions, linked to the Brazilian judiciary, basically work on two lines of action. The first is related to the direct service provided to citizens, especially the receiving and processing of their legal claims. The second line of action is related to support activities such as human resource management, accounting, and finance. In addition, all agencies contained internal departments to provide IT services to users, thus justifying why they were chosen. Approximately 4500 users received an invitation via e-mail to participate in the research. A total of 940 people sent their answers through the completion of an electronic form. However, after preliminary analysis of the replies, we decided to withdraw 13 question-naires that were filled out incompletely. Thus, the final sample contained 927 questionnaires, which represents a response rate of 20.3%. The questionnaires were administered between the months of November and December 2014.
The questionnaire used to measure the technostress creator factors is based on the instrument presented by Tarafdar et al. (2007). More specifically, the variable techno-overload (TOV) was measured by five questions. For techno-invasion (TIV), we used four questions. Techno-complexity (TCO) was mea-sured by five questions. Finally, four questions meamea-sured techno-uncertainty (TUC). In all cases, we used a 5-point Likert scale ranging from “totally disagree” to “totally agree.” However, we opted to remove from the questionnaire items referring to the construct of techno-insecurity. This decision was because the sample was exclusively composed of public servants who have the right to job security, as guaranteed by the Brazilian Federal Constitution. Thus, considering that, in essence, techno-insecurity captures the fear that workers report of losing their jobs and being replaced by other work-ers who are more technologically skilled, the inclusion of techno-insecurity could generate a bias in the analyses, com-promising the results.
To gather additional information necessary to achieve the objective of this study, we included questions regarding vari-ables related to the individual characteristics gender (GEN), age (AGE), level of formal instruction (EDU), and length of professional experience (EXP). Thus, the applied
questionnaire contained a total of 24 questions, and for ques-tions related to technostress, we offered the answer option of “I do not know or non-applicable.” Before the questionnaires were administered, they were submitted to a group of six users to verify the understanding of the questions, with no problems being registered (Hair et al.,2005).
To perform quantitative analyses, we calculated the pro-portion measures, descriptive statistics (mean and standard deviation), and the questionnaire’s internal consistency indexes (Cronbach’s alpha). As a support tool, we used SPSS 22.0. Then, the existence of differences between user groups identified on the basis of gender, age, educational level, and length of professional experience was investigated by the specification of a multiple imputation and multiple causes (MIMIC) model, using structural equations modeling (SEM), as proposed by Joreskog and Goldberger (1975). This is an agile method of identifying differences between groups through the use of dummy variables in a causal model (Marôco, 2014). Thus, for the variable gender, we established a value of 0 for women and 1 for men. For the variable formal instruction, we established a value of 0 for the group with less formal education (graduate or less) and 1 for respondents with specialization (lato sensu), master’s degrees and doctorates. To create groups based on the age criteria, we considered 39 years of age a point of delimitation, considering that people at that age, or younger, generally started their professional life after the beginning of IT usage in professional environments (these were identified with a value of 1). Thus, it is possible to analyze the differences between these people and those who have worked without IT support (they received a value of 0). Finally, for the variable experience, we estab-lished a value of 0 for the group with a lower number of years worked in the agency (up to 10 years) and 1 for respondents with longer experience (11 years or more). The structural models were specified in the IBM AMOS version 22 package.
4. Data analysis and discussion
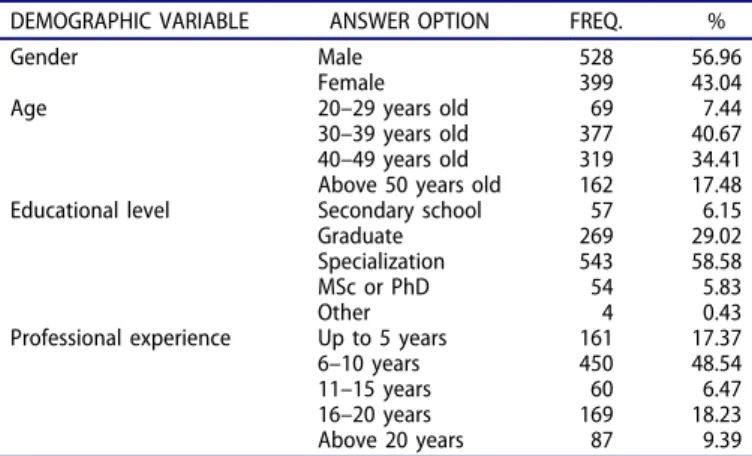
Data analysis began with the characterization of the sample presented inTable 2.
Given the answers by the participants, they can be char-acterized as follows:
Table 2.Summary of sample characterization.
DEMOGRAPHIC VARIABLE ANSWER OPTION FREQ. %
Gender Male 528 56.96
Female 399 43.04 Age 20–29 years old 69 7.44 30–39 years old 377 40.67 40–49 years old 319 34.41 Above 50 years old 162 17.48 Educational level Secondary school 57 6.15 Graduate 269 29.02 Specialization 543 58.58 MSc or PhD 54 5.83
Other 4 0.43
Professional experience Up to 5 years 161 17.37 6–10 years 450 48.54 11–15 years 60 6.47 16–20 years 169 18.23 Above 20 years 87 9.39
● Most of the 927 participants are male (56.96%), and 43.04% are female;
● The majority completed a specialization course (post-graduate lato sensu), representing 58.58% of the answers; ● There was a predominance of participants with ages ranging between 30 and 39 years (40.67%) and who have worked at the institution between 6 and 10 years.
We did not identify trends or absolute majorities in the sample that could interfere in the results. We also did not observe significant differences in the distribution of the char-acteristics of the sample and population servers in a compar-ison of available data on the basis of human resource agencies. The data on the participants’ gender and age allow us to determine that the research respondent is the typical user of the organization, given that there were no biases or tendencies observed that may compromise the representativeness of the sample. For the same observation, information related to the time of experience in the organization is established since it is compatible with civil service examination periods to fill vacancies. Similarly, the prevalence of users that completed specialization courses (58.59%) is explained by an organiza-tional strategy shared between the 14 researched agencies that grants financial incentives to employees who complete specia-lization courses. Thus, we can conclude that the sample col-lected is appropriate for the objectives of the study.
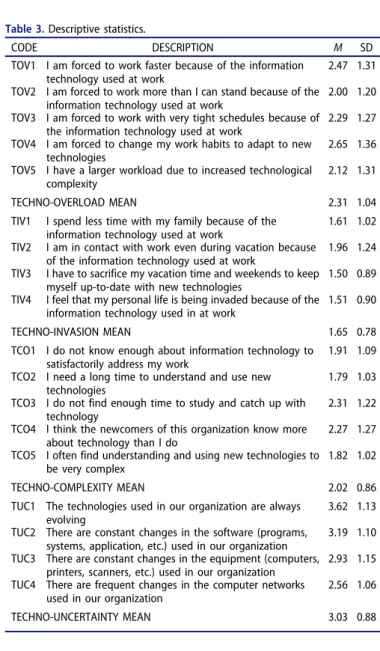
The evaluation of the variables related to technostress (Ragu-Nathan et al., 2008; Tarafdar et al., 2007) revealed that, in general, the averages found were low, which suggests that this problem does not appear to be particularly relevant in the opinion of the population surveyed (Table 3). For example, the lowest mean among the research variables (M = 1.65) was detected in the construct of techno-invasion (TIV). That is, the surveyed users stated that their personal lives are not being heavily invaded by the use of IT in their organizations. In addition, this was a homogeneous opinion (SD = 0.78). Although all of the items of the variable pre-sented low means, some users reported that they have contact with work, even during their vacations, because of the IT used in the organization. This statement is based on the fact that this item presented the highest mean of the construct (M = 1.96) and a high degree of discrepancy in the responses (SD = 1.24).
Similarly, users did not report facing many difficulties with the complexity of the technological environment that they use at work. This is what the mean of 2.02, identified for the techno-complexity (TCO) variable, and the standard devia-tion of 0.86 suggest. Among the items that compose the construct, what stands out is the users feel that they do not have enough time to study or to keep technologically up-to-date (M = 2.31), a nonconsensual opinion (SD = 1.22). On the other hand, the item with the lowest impact was the opinion that the users find understanding and using new technologies to be complex (M = 1.82). The result of the techno-overload (TOV) variable appeared to be more noticeable though still inconsistent, with a mean of 2.31. The data suggest that users do not realize how important the intricacies related to the increased volume of work provided by the use of IT in their organizations are. The data suggest that users do not realize
how important the difficulties that they face are related to the increase in work volume provided by the use of IT in their organizations. However, this is not a homogeneous opinion, given the detection of a standard deviation of 1.04, the largest among the variables studied. Thus, the data indicate that a share of users reported being subject to this problem, which can be explained by the use of different technological solu-tions by the internal departments of public agencies and by the irregular workload distribution between the areas of the organization. Finally, the techno-uncertainty (TUC) variable presented the highest mean among the four technostress-related variables, reaching a value slightly higher than neu-trality (M = 3.07), and a high degree of convergence of opinions (SD = 0.88). In this construct, which is related to the constant changes in the organization’s technological environment, we highlight the item concerning the constant evolution of the technological environment applied by users (M = 3.62 and SD = 1.13). It is worth noting that the values found were very similar to those obtained by the item that measured the degree of innovation of the services provided by the IT department (M = 3.50 and SD = 1.01) present in the product service construct.
Table 3.Descriptive statistics.
CODE DESCRIPTION M SD
TOV1 I am forced to work faster because of the information technology used at work
2.47 1.31 TOV2 I am forced to work more than I can stand because of the
information technology used at work
2.00 1.20 TOV3 I am forced to work with very tight schedules because of
the information technology used at work
2.29 1.27 TOV4 I am forced to change my work habits to adapt to new
technologies
2.65 1.36 TOV5 I have a larger workload due to increased technological
complexity
2.12 1.31
TECHNO-OVERLOAD MEAN 2.31 1.04 TIV1 I spend less time with my family because of the
information technology used at work
1.61 1.02 TIV2 I am in contact with work even during vacation because
of the information technology used at work
1.96 1.24 TIV3 I have to sacrifice my vacation time and weekends to keep
myself up-to-date with new technologies
1.50 0.89 TIV4 I feel that my personal life is being invaded because of the
information technology used in at work
1.51 0.90
TECHNO-INVASION MEAN 1.65 0.78 TCO1 I do not know enough about information technology to
satisfactorily address my work
1.91 1.09 TCO2 I need a long time to understand and use new
technologies
1.79 1.03 TCO3 I do not find enough time to study and catch up with
technology
2.31 1.22 TCO4 I think the newcomers of this organization know more
about technology than I do
2.27 1.27 TCO5 I often find understanding and using new technologies to
be very complex
1.82 1.02
TECHNO-COMPLEXITY MEAN 2.02 0.86 TUC1 The technologies used in our organization are always
evolving
3.62 1.13 TUC2 There are constant changes in the software (programs,
systems, application, etc.) used in our organization
3.19 1.10 TUC3 There are constant changes in the equipment (computers,
printers, scanners, etc.) used in our organization
2.93 1.15 TUC4 There are frequent changes in the computer networks
used in our organization
2.56 1.06
Comparing the results obtained in this research with the data obtained by Tarafdar et al. (2007) and Ragu-Nathan et al. (2008), several similarities were also identified (Table 4). In general, the levels of technostress detected in the three surveys were low, and in all three cases, the variable techno-complex-ity was the variable achieving the highest score. Similarly, the techno-invasion variable obtained the lowest mean in all three studies. The standard deviations were also drawn near and overall indicated a reasonable level of agreement among the participants. Finally, the reliability indicators of the constructs were located in similar levels, slightly lower than those found in the three variables of service encounter but with proper consistency.
Despite the similarity between results, we observed that the levels of technostress highlighted in this study were lower than those presented inTable 4. In addition to the differences related to the technological environment of the surveyed organizations, a possible explanation for the observed tech-nostress reduction in the four studied factors may be in the fact that seven years have passed since the completion of previous studies. During this period, users experienced the use of IT in their professional and personal lives intensively, in such a way that technology is already part of their lives. Thus, the data suggest that users may have become accus-tomed to the use of IT, which may have caused a reduction in the levels of technostress. Finally, Cronbach’s alpha analysis indicates the reliability of the internal coherence of the instru-ment used in the research, whereas all of the values found
were located between 0.77 and 0.86, greater than the mini-mum recommended value of 0.70 (Hair et al.,2005).
To detect whether the answers of the respondents classified by gender, age, educational level, and time of experience presented means with significant differences, we performed comparisons through the specification of five structural equa-tion models (SEM), with each being specifically built for each variable in the study. To allow the use of the MIMIC approach, we specified a second-order structural equation model for the technostress construct, in conjunction with the four dummy variables related to the individual character-istics analyzed, according toFigure 2. After making the neces-sary adjustments to the model, the goodness-of-fit indices obtained can be considered acceptable, as described in Marôco (2014): χ2/df (190) = 874.980; CFI = 0.911; PCFI = 0.750; GFI = 0.920; PGFI = 0.691; RMSEA = 0.062; and SRMR = 0.055.
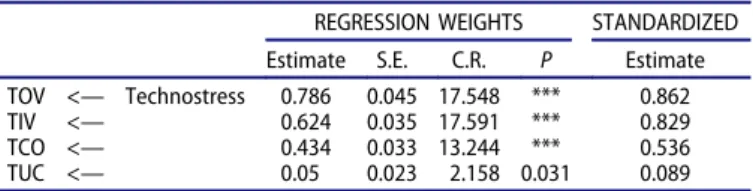
The analysis of the regressions weights indicated that the four technostress creator factors studied in this article were significant (0.05 level), corroborating Tarafdar et al. (2007) and Ragu-Nathan et al. (2008).Table 5presents the estimates obtained.
4.1. Age
Table 6presents the estimates obtained for the age variable, related to each of the four technostress creator factors. Users under 39 years of age were grouped (N = 446), as were those over this age limit (N = 481). This division allowed users to be grouped into those who started their professional careers before the diffusion of IT in organizations compared to respondents who started their careers after this diffusion. Thus, a dummy variable was specified to represent older users.
Regarding the effect of the age of the workers on technos-tress (H1), we tested hypotheses that when compared to younger workers, older workers are more affected by (a) Table 4.Comparison of the technostress creator factors.
Tarafdar et al. (2007)
Ragu-Nathan et al. (2008)
Data from the present research Variable % SD α % SD α % SD α Techno-overload 49.25 1.00 0.89 50.00 0.91 0.82 32.75 1.04 0.86 Techno-invasion 22.75 0.77 0.81 30.25 0.83 0.80 16.25 0.78 0.77 Techno-complexity 38.50 0.83 0.84 42.75 0.75 0.77 25.50 0.86 0.82 Techno-uncertainty 53.75 0.80 0.82 58.25 0.76 0.83 51.75 0.88 0.80
Figure 2.Structural model.
techno-overload, (b) techno-invasion, (c) techno-complexity, and (d) techno-uncertainty. In this sense, the evidence sup-ported hypothesis H1c and did not support hypotheses H1a, H1b, and H1d. More precisely, we detected a difference related to the age of users: the results suggest that older users tend to perceive the organizational technology environ-ment (techno-complexity) to be more complex than younger users. This finding is consistent with the studies byŞahin and Çoklar (2009) and Jena and Mahanti (2014) but contradicts the results found by Ragu-Nathan et al. (2008), Tarafdar et al. (2011), and Çoklar andŞahin (2011). A possible explanation is the fact that younger people are more familiar with the use of various technologies, which can cause the reduction in the perception of the complexity of the technological environ-ment. New generations use technological devices from a very young age and more often (Prensky,2001). For example, Joiner et al. (2013) identified that younger users use the Internet more, in terms of frequency and amplitude, than previous generations. However, Helsper and Eynon (2010) warned that users’ age is one of the factors that should be considered in this regard, in addition to gender, education, experience, and the amplitude of IT use. Finally, no significant differences for the remaining technostress creator factors (techno-overload, techno-invasion, and techno-uncertainty) were found.
4.2. Professional experience
Table 7presents the estimates obtained for the variable pro-fessional experience, related to each of the four technostress
creator factors. The division between the groups added users with longer professional experience in the public institutions surveyed (N = 316) and compared them with the group of users who have worked for less time in the organizations (N = 611). Thus, a dummy variable was specified to represent users with longer professional experience.
Regarding the effect of workers’ time of professional experience on technostress (H2), we tested hypotheses that, when compared to less experienced workers, more experi-enced workers are more affected by (a) techno-overload, (b) invasion, (c) complexity, and (d) techno-uncertainty. In this sense, the evidence supported hypothesis H2c and did not support hypotheses H2a, H2b, and H2d. More precisely, we did not observe any relationship between users’ professional experience and the factors techno-over-load, techno-invasion, and techno-uncertainty. However, a positive relationship between users’ professional experience and the techno-complexity problem was detected. That is, the longer the users’ length of professional experience is, the more these users are affected by this problem. A possible explanation may be related to the fact that in the surveyed institutions, users with more experience in general are older professionals. Thus, this result is coherent with what was detected in relation to the age variable in this study.
4.3. Gender
Table 8presents the estimates obtained referring to the gender variable, related to each of the four technostress creator fac-tors. The users were divided between women (N = 399) and men (N = 528). A dummy variable was specified to represent male users.
Regarding the effect of the gender of workers on technos-tress (H3), we tested the hypothesis that when compared to men, women are more affected by (a) techno-overload, (b) invasion, (c) complexity, and (d) techno-uncertainty. In this regard, evidence supported hypothesis H3c and H3d, but did not support hypotheses H3a and H3b. The data indicated that technostress can be influenced by gender differences, supporting the findings by Tarafdar et al. (2011), Ragu-Nathan et al. (2008), Çoklar and Şahin (2011), and Jena and Mahanti (2014). Surprisingly, however, women and men were differently affected by the phenom-enon. Women reported being subject to higher levels of techno-complexity and techno-uncertainty, while men indi-cated feeling greater effects from overload and techno-invasion. These findings seem to be related to the evidence indicating that men are more oriented toward extrinsic aspects regarding the use of IT while women are more sensi-Table 5.Estimates for technostress.
REGRESSION WEIGHTS STANDARDIZED Estimate S.E. C.R. P Estimate TOV <— Technostress 0.786 0.045 17.548 *** 0.862 TIV <— 0.624 0.035 17.591 *** 0.829 TCO <— 0.434 0.033 13.244 *** 0.536 TUC <— 0.05 0.023 2.158 0.031 0.089 TOV: Techno-overload; TIV: Techno-invasion; TCO: Techno-complexity; TUC:
Techno-uncertainty
Table 6.Estimates for age.
REGRESSION WEIGHTS STANDARDIZED Estimate S.E. C.R. P Estimate TOV <— Age −0.002 0.071 −0.035 0.972 −0.001 TIV <— 0.052 0.061 0.85 0.395 0.034 TCO <— 0.196 0.064 3.062 0.002 0.121 TUC <— −0.02 0.046 −0.437 0.662 −0.018 TOV: Techno-overload; TIV: Techno-invasion; TCO: Techno-complexity; TUC:
Techno-uncertainty
Table 7.Estimates for professional experience.
REGRESSION WEIGHTS STANDARDIZED Estimate S.E. C.R. P Estimate TOV <— Professional experience 0.026 0.075 0.349 0.727 0.014 TIV <— 0.033 0.064 0.522 0.602 0.021 TCO <— 0.166 0.067 2.464 0.014 0.097 TUC <— −0.051 0.049 −1.047 0.295 −0.043 TOV: Techno-overload; TIV: Techno-invasion; TCO: Techno-complexity; TUC:
Techno-uncertainty
Table 8.Estimates for gender.
REGRESSION WEIGHTS STANDARDIZED Estimate S.E. C.R. P Estimate TOV <— Gender 0.285 0.064 4.442 *** 0.155 TIV <— 0.276 0.055 5.034 *** 0.182 TCO <— −0.198 0.058 -−3.449 *** −0.121 TUC <— −0.11 0.042 -−2.622 0.009 −0.097 TOV: Techno-overload; TIV: Techno-invasion; TCO: Techno-complexity; TUC:
tive to intrinsic aspects (Venkatesh et al.,2003). In this sense, among the technostress creator factors, techno-overload and techno-invasion are the most closely related to external aspects of the phenomenon (increasing workload and inva-sion of private life), while complexity and techno-uncertainty refer to internal factors of the problem (difficul-ties with the complexity of and with the constant changes in the technological environment being used).
4.4. Educational level
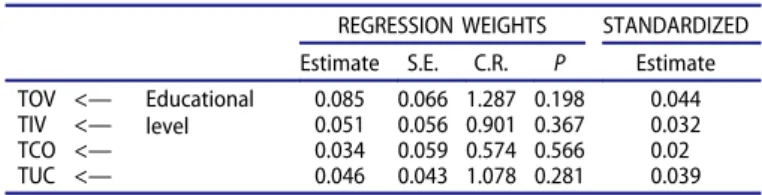
Table 9 presents the estimates obtained for the variable of educational level, related to each of the four technostress creator factors. The division between the groups added users who have studied up to the undergraduate level (N = 330) and compared them with the group of users who have a speciali-zation or completed their master’s degree or doctorate (N = 597). Thus, a dummy variable was specified to represent users with a higher level of formal education.
Regarding the effect of workers’ level of formal education on technostress (H4), we tested the hypothesis that when compared to workers with higher level of formal education, workers with lower levels of formal education are more affected by (a) techno-overload, (b) techno-invasion, (c) techno-complexity, and (d) techno-uncertainty. Nonetheless, we did not observe any rela-tionship between users’ educational level and the four technos-tress creator factors (hypotheses H4a, H4b, H4c, and H4d), which is consistent with the findings by Wang et al. (2008) and contradicts those found by Ragu-Nathan et al. (2008), Tarafdar et al. (2011), Hsiao (2017), and Krishnan (2017).
In summary, considering the five analyses carried out, the results suggest that the individual differences related to gen-der, age, educational level, and users’ length of professional experience presented significant differences when related to the different aspects (or factors) of stress caused by IT usage in organizations. However, the results indicate that, aiming at a broader understanding of the problem, these demographic characteristics should be examined individually and must be connected one by one with the technostress creator factors.
In general, we observe that the effects of a particular demo-graphic characteristic vary according to each factor of technos-tress, taken in isolation. In some cases, the analysis of a given characteristic produced the opposite results according to dif-ferent stressors (for example, for the gender of the respon-dents). That is, managers and future researchers should be aware that a broader and deeper understanding of technostress necessarily involves a detailed analysis of the effect of each of its components on the variables or associated constructs.
In view of the contradictory results observed in the litera-ture on the effect of the association of demographic and technostress characteristics, we needed to find possible expla-nations. To do so, we used the literature on the diversity of the workforce, coming from the field of applied psychology. In this regard, Roberson et al. (2017) present a comprehensive review of the literature of the field, from which we were able to identify that the degree of distribution of differences within organizations can affect the outcome of the variables of inter-est (Williams & O’Reilly III, 1998). That is, the analysis of very different groups, in terms of demographic characteristics, may produce highly different results. Another possible expla-nation may be related to the fact that individuals may be identified more (or less) with demographically marked sub-groups than with larger sub-groups, which can cause changes in the functioning of the groups, including responses to external stimuli (Lau & Murnighan,1998). In addition, different orga-nizational contexts can impact the results of studies. In this regard, Joshi and Roh (2009) examined the role of contextual factors in the research of the diversity of the workforce and warned that the variation in the research contexts, such as the types of market, occupation, or team, can lead to significant changes in the results of field studies at the organizational and individual levels. In this respect, previous research has alerted us to the importance of personality traits and cultural aspects in research on the beliefs, perceptions, and results concerning the use of IT in organizations (Krishnan,2017; Maier,2012).
5. Conclusion
The objective of this study was to determine whether the indivi-dual characteristics of gender, age, educational level, and users’ length of professional experience produce differences in relation to users’ perception of the technostress creator factors. The results indicated that the stress caused by the use of IT in organizations affects users in the most varied ways and those individual char-acteristics strongly influence the manifestation of the phenom-enon. More specifically, the results of this study indicated that the longer the users’ length of professional experience is, the more they will be affected by the perception of the complexity of the professional technological environment (techno-complexity), an issue that was also impacting older users. In relation to gender differences, women reported being more exposed to higher levels of techno-complexity and techno-uncertainty, while men seemed to suffer more from the effects of overload and techno-invasion. Finally, we did not observe any relationship between users’ educational level and the four technostress creator factors among the users of the surveyed public institutions.
Because the body of previous research that studies the problem of technostress faced by workers is aligned with itself (e.g., Ahmad et al., 2014; Ayyagari et al., 2011; Fuglseth & Sørebø, 2014; Jena, 2015; Krishnan, 2017; Lee et al., 2016; Maier, 2014; Maier et al., 2015; Ragu-Nathan et al., 2008; Riedl, 2012; Suh & Lee, 2017b; Tams et al., 2014; Tarafdar et al.,2007, 2010; Yan et al., 2013), the present study adjusts its focus of analysis specifically to the relationship of each creator of technostress (Ragu-Nathan et al.,2008), with the variables gender, age, professional experience, and formal education being among the most commonly presented topics Table 9.Estimates for formal education.
REGRESSION WEIGHTS STANDARDIZED Estimate S.E. C.R. P Estimate TOV <— Educational level 0.085 0.066 1.287 0.198 0.044 TIV <— 0.051 0.056 0.901 0.367 0.032 TCO <— 0.034 0.059 0.574 0.566 0.02 TUC <— 0.046 0.043 1.078 0.281 0.039 TOV: Techno-overload; TIV: Techno-invasion; TCO: Techno-complexity; TUC:
in the literature on workforce diversity (Van Knippenberg et al., 2004). In this regard, several contributions can be drawn for the theory and management of IT services in organizations. In the theoretical field, the study results expli-citly state that demographic differences can significantly alter the levels of technostress reported by users. Therefore, future research can consider the impact of this influence when relat-ing the phenomenon to variables at the organizational and individual levels. However, the association between technos-tress and the individual characteristics studied is differen-tiated. In contrast, the results noted that this association must be made in a specific manner, relating the demographic characteristics to each specific stressor.
In this sense, the results of the present study provide elements that may help understand the seemingly contradictory results observed in previous research, which at times points to the existence of differences related to demographic characteristics or gathers evidence in the opposite direction. More specifically, rescuing the divergences of the results in previous research (presented in Table 1), Ragu-Nathan et al. (2008), Tarafdar et al. (2011), and Jena and Mahanti (2014) identified higher levels of technostress among men, while the evidence obtained by Çoklar and Şahin (2011) indicates the opposite (more tech-nostress among women); in addition, the results presented by Wang et al. (2008), Maier et al. (2015), Hsiao et al. (2017), Hsiao (2017), and Krishnan (2017) did not find significant results. In the present study, the results indicate that the gender variable is affected in a mixed manner; that is, men are subject to higher levels of overload and invasion, whereas techno-uncertainty and techno-complexity seem to affect women more. The evidence from the literature is also contradictory for the age variable: Çoklar andŞahin (2011) and Jena and Mahanti (2014) detected higher levels of technostress among older workers, whereas Ragu-Nathan et al. (2008), Tarafdar et al. (2011), and Hsiao (2017) found evidence in the opposite direction (more technostress among youth). The results of the present study indicate that only one of the four analyzed technostress creator factors was significant (techno-complexity), affecting older work-ers more intensely. Finally, for Tarafdar et al. (2011), workers with higher levels of formal education are more subject to technostress, while Hsiao (2017) and Krishnan (2017) found contradictory evidence (more technostress among the less edu-cated). On the other hand, the results of the present study did not find significant effects between the technostress creator factors and the level of formal education of the users, corrobor-ating the results obtained by Wang et al. (2008).
In the practical field, the results of this study help IT managers understand the role of individual differences in the context of technostress, subdivided by the technostress creator factors. IT managers are provided with information that can contribute to the adoption of problem-solving actions designed specifically for each audience. In addition, this information can serve as a basis for the training of technical staff, with a focus on understanding the reactions and needs of each subset of users, segmented by gender, age, level of formal education, and time of experience. We identi-fied, for example, that older workers suffer more from problems related to the complexity of the technological environment. With this in mind, professionals and IT managers must direct efforts and investments to increase the usability of IT solutions, making
the technological environment simpler and more intuitive. Another possibility to meet the needs of older workers is the specialization of support professionals for the service of this public. In addition, older workers could receive specialized training on new and future solutions, with a strong emphasis on practical activities. Therefore, as highlighted by Ayyagari et al. (2011), understanding the factors that help explain the origins and con-sequences of the technostress can guide managers to adopt inter-ventions with the objective of reducing the costs associated with the existence of people with stress in organizations
The study, however, has limitations that contraindicate the generalization of the results. First, the data were collected by means of a non-probabilistic sampling process and defined by convenience, considering that the respondents’ participation was voluntary. Second, the investigation focused on public sector bodies, which, as noted by evidence in the literature (Baarspul & Wilderom,2011; Rainey & Chun,2007), have operating dynamics, especially on the organizational level, that are very diverse in private organizations. From these limitations, we suggest that subsequent studies include private and third sector organizations and expand investigations to other geographical and cultural con-texts so that the results can be compared with those obtained by the present study. By also considering the different results found in the literature, we suggest that future researchers deepen the ana-lysis of the relationship between the individual characteristics and technostress, general and relative to its creator factors, through the study of the influence of technological, contextual, and social contexts in which the workers are involved (Elie-Dit-Cosaque et al.,2011; Joshi & Roh,2009; Krishnan,2017; Maier,2012). We also suggest studies that investigate the role of individual charac-teristics in technostress under different contexts relating to the use of IT in organizations, as proposed by Yeo and Gold (2015): standardization (full IT use), hybridization (partial IT use), and conventionalization (disuse of IT).
ORCID
Danilo Magno Marchiori http://orcid.org/0000-0002-7386-9706 Ricardo Gouveia Rodrigues http://orcid.org/0000-0001-6382-5147
References
Agarwal, R., & Prasad, J. (1999). Are individual differences germane to the acceptance of new information technologies? Decision Sciences, 30 (2), 361–391. doi:10.1111/j.1540-5915.1999.tb01614.x
Ahmad, U. N. U., Amin, S. M., & Wan Ismail, W. K. (2014). Moderating effect of technostress inhibitors on the relationship between technos-tress creators and organisational commitment. Jurnal Teknologi (Sciences and Engineering), 67(1), 51–62. doi:10.11113/jt.v67.1932 Ayyagari, R., Grover, V., & Purvis, R. (2011). Technostress:
Technological antecedents and implications. MIS Quarterly, 35(4), 831–858. doi:10.1093/bja/aeq366
Baarspul, H. C., & Wilderom, C. P. M. (2011). Do employees behave differently in public- vs private-sector organizations?: A state-of-the-art review. Public Management Review, 13(7), 967–1002. doi:10.1080/ 14719037.2011.589614
Baltaci, S., & Gokcay, D. (2016). Stress detection in human–computer interaction: Fusion of pupil dilation and facial temperature features. International Journal of Human-Computer Interaction, 32(12), 956– 966. doi:10.1080/10447318.2016.1220069
Barnett, J. H., & Karson, M. J. (1989). Managers, values, and executive decisions: An exploration of the role of gender, career stage,
organizational level, function, and the importance of ethics, relation-ships and results in managerial decision-making. Journal of Business Ethics, 8(10), 747–771. doi:10.1007/BF00383775
Brod, C. (1984). Technostress: The human cost of the computer revolution. Massachusetts: Addison Wesley Publishing Company.
Brooks, S., & Califf, C. (2017). Social media-induced technostress: Its impact on the job performance of it professionals and the moderating role of job characteristics. Computer Networks, 114, 143–153. doi:10.1016/j.comnet.2016.08.020
Burton-Jones, A., & Hubona, G. S. (2005). Individual differences and usage behavior: Revisiting a technology acceptance model assumption. ACM SIGMIS Database, 36(2), 58–77. doi:10.1145/1066149.1066155 Chua, S. L., Chen, D. T., & Wong, A. F. L. (1999). Computer anxiety and
its correlates: A meta-analysis. Computers in Human Behavior, 15(5), 609–623. doi:10.1016/S0747-5632(99)00039-4
Coffin, R. J., & Macintyre, P. D. (1999). Motivational influences on computer-related affective states. Computers in Human Behaviour, 15(5), 549–569. doi:10.1016/S0747-5632(99)00036-9
Çoklar, A. N., &Şahin, Y. L. (2011). Technostress levels of social network users based on ICTs in Turkey. European Journal of Social Science, 23 (2), 171–182.
Cooper, J. (2006). The digital divide: The special case of gender. Journal of Computer Assisted Learning, 22(5), 320–334. doi: 10.1111/j.1365-2729.2006.00185.x
Czaja, S. J., & Sharit, J. (1993). Stress reactions to computer-interactive tasks as a function of task structure and individual differences. International Journal of Human-Computer Interaction, 5(1), 1–22. doi:10.1080/10447319309526053
De Haes, S., Van Grembergen, W., & Debreceny, R. S. (2013). COBIT 5 and enterprise governance of information technology: Building blocks and research opportunities. Journal of Information Systems, 27(1), 307–324. doi:10.2308/isys-50422
Elie-Dit-Cosaque, C., Pallud, J., & Kalika, M. (2011). The influence of individual, contextual, and social factors on perceived behavioral control of information technology: A field theory approach. Journal of Management Information Systems, 28(3), 201–234. doi:10.2753/ MIS0742-1222280306
Fletcher, J. K. (2001). Disappearing acts: Gender, power, and relational practice at work. Cambridge, MA: Mit Press.
Fuglseth, A. M., & Sørebø, Ø. (2014). The effects of technostress within the context of employee use of ICT. Computers in Human Behavior, 40, 161–170. doi:10.1016/j.chb.2014.07.040
Gabriel, S., & Gardner, W. L. (1999). Are there“his” and “hers” types of interdependence? The implications of gender differences in collective versus relational interdependence for affect, behavior, and cognition. Journal of Personality and Social Psychology, 77(3), 642–655. doi:10.1037/0022-3514.77.3.642
Garicano, L., & Heaton, P. (2010). Information technology, organization, and productivity in the public sector: Evidence from police depart-ments. Journal of Labor Economics, 28(1), 167–201. doi:10.1086/649844 Hair, J. F., Babin, B., Money, A., & Samouel, P. (2005). Fundamentos de métodos de pesquisa em administração. Porto Alegre: Bookman Companhia Ed.
He, J., & Freeman, L. A. (2010). Are men more technology-oriented than women? The role of gender on the development of general computer self-efficacy of college students. Journal of Applied Computing and Information Technology, 21(2), 203–213.
Heinrich, K. T. (1991). Loving partnerships. The Journal of Higher Education, 62(5), 514–538. doi:10.1080/00221546.1991.11774150 Helsper, E. J., & Eynon, R. (2010). Digital natives: Where is the evidence?
British Educational Research Journal, 36(3), 503–520. doi:10.1080/ 01411920902989227
Holden, H., & Rada, R. (2011). Understanding the influence of perceived usability and technology self-efficacy on teachers’ technology accep-tance. Journal of Research on Technology in Education, 43(4), 343–367. doi:10.1080/15391523.2011.10782576
Hsiao, K. L. (2017). Compulsive mobile application usage and technos-tress: The role of personality traits. Online Information Review, 41(2), 272–295. doi:10.1108/OIR-03-2016-0091
Hsiao, K. L., Shu, Y., & Huang, T. C. (2017). Exploring the effect of compulsive social app usage on technostress and academic perfor-mance: Perspectives from personality traits. Telematics and Informatics, 34(2), 679–690. doi:10.1016/j.tele.2016.11.001
Huffman, A. H., Whetten, J., & Huffman, W. H. (2013). Using technol-ogy in higher education: The influence of gender roles on technoltechnol-ogy self-efficacy. Computers in Human Behavior, 29(4), 1779–1786. doi:10.1016/j.chb.2013.02.012
Hung, W. H., Chen, K., & Lin, C. P. (2014). Does the proactive person-ality mitigate the adverse effect of technostress on productivity in the mobile environment? Telematics and Informatics, 32(1), 143–157. doi:10.1016/j.tele.2014.06.002
Jena, R. K. (2015). Technostress in ICT enabled collaborative learning environment: An empirical study among Indian academician. Computers in Human Behavior, 51, 1116–1123. doi:10.1016/j. chb.2015.03.020
Jena, R. K., & Mahanti, P. K. (2014). An Empirical study of Technostress among Indian Academicians. International Journal of Education and Learning, 3(2), 1–10. doi:10.14257/ijel.2014.3.2.01
Joiner, R., Gavin, J., Brosnan, M., Cromby, J., Gregory, H., Guiller, J., . . . Moon, A. (2013). Comparing first and second generation digital natives’ internet use, internet anxiety, and internet identification. Cyberpsychology, Behavior, and Social Networking, 16(7), 549–552. doi:10.1089/cyber.2012.0526
Joreskog, K. G., & Goldberger, A. S. (1975). Estimation of a model with multiple indicators and multiple causes of a single latent variable. Journal of American Statistical Association, 70(351), 631–639. Joshi, A., & Roh, H. (2009). The role of context in work team diversity
research: A meta-analytic review. Academy of Management Journal, 52 (3), 599–627. doi:10.5465/AMJ.2009.41331491
Korobili, S., Togia, A., & Malliari, A. (2010). Computer anxiety and attitudes among undergraduate students in Greece. Computers in Human Behavior, 26(3), 399–405. doi:10.1016/j.chb.2009.11.011 Krishnan, S. (2017). Personality and espoused cultural differences in
technostress creators. Computers in Human Behavior, 66, 154–167. doi:10.1016/j.chb.2016.09.039
Lau, D. C., & Murnighan, J. K. (1998). Demographic diversity and faultlines: The compositional dynamics of organizational groups. Academy of Management Review, 23(2), 325–340. doi:10.5465/ AMR.1998.533229
Laumer, S., Maier, C., Eckhardt, A., & Weitzel, T. (2016). User person-ality and resistance to mandatory information systems in organiza-tions: A theoretical model and empirical test of dispositional resistance to change. Journal of Information Technology, 31(1), 67– 82. doi:10.1057/jit.2015.17
Lee, S. B., Lee, S. C., & Suh, Y. H. (2016). Technostress from mobile communication and its impact on quality of life and productivity. Total Quality Management, 27(7), 775–790. doi:10.1080/ 14783363.2016.1187998
Maier, C. (2012). Personality within information systems research: A literature analysis. Ecis, 101. Retrieved from http://home.aisnet.org/ displaycommon.cfm?an=1&subarticlenbr=346
Maier, C. (2014). Technostress. Retrieved from https://d-nb.info/ 1066645345/34
Maier, C., Laumer, S., & Eckhardt, A. (2015). Information technology as daily stressor: Pinning down the causes of burnout. Journal of Business Economics, 85(4), 349–387. doi:10.1007/s11573-014-0759-8
Maier, C., Laumer, S., Eckhardt, A., & Weitzel, T. (2015). Giving too much social support: Social overload on social networking sites. European Journal of Information Systems, 24(5), 447–464. doi:10.1057/ejis.2014.3
Maier, C., Laumer, S., Weinert, C., & Weitzel, T. (2015). The effects of technostress and switching stress on discontinued use of social net-working services: A study of Facebook use. Information Systems Journal, 25(3), 275–308. doi:10.1111/isj.12068
Marôco, J. (2014). Análise de equações estruturais: fundamentos teóricos, software & aplicações. Lisboa, Portugal: ReportNumber.
Mikkelsen, A., Øgaard, T., Lindøe, P. H., & Olsen, O. E. (2002). Job characteristics and computer anxiety in the production industry.