i
ANALYSIS OF URBAN LAND USE AND LAND COVER
CHANGES:
A Case Study in Bahir Dar, Ethiopia
ii
ANALYSIS OF URBAN LAND USE AND LAND COVER CHANGES:
A Case Study in Bahir Dar, Ethiopia
Dissertation supervised by: Prof. Doutor Pedro Cabral
Instituto Superior de Estatística e Gestão de Informação (ISEGI), Universidade Nova de Lisboa, Lisbon, Portugal.
Dissertation Co - supervised by: Prof. Doutor Edzer Pebesma Institute for Geoinformatics (IFGI), Heisenbergstraße 2, Münster, Germany.
Prof. Doutor Jorge Mateu
Department of Mathematics, Universitat Jaume I (UJI), Castellon, Spain.
iii
ACKNOWLEDGMENTS
First and foremost, my extraordinary thanks goes for my Almighty God.
I would like to thank the Erasmus Mundus scholarship programe for the grant support in which my study goes to end. I would also like to thank the coordinators Prof. Dr. Marco Painho (ISEGI), Dr. Christoph Brox (IFGI) and Prof. Dr. Joaquín Huerta (UJI) of the partner universities in the consortium.
A special thank goes to my supervisor Pedro Cabral for his support and guidance. You always helped me when I had problems with my analysis, corrected my thesis at several occasions and you have always been patient. Furthermore, you both encouraged me to do new analyses and to find new results. I am grateful to my co-supervisors Prof. Dr. Edzer Pebesma and Prof. Dr. Jorge Mateu for their building comments and suggestions.
I would like to thank Prof. Dr. Marco Painho and Prof. Dr. Tiago Oliveira for continuous thesis follow up and encouragement and facilitating software licenses from Clark labs on behalf of ISEGI.
I would also like to thank the Ethiopian Mapping Agency for providing me GIS data for this research. I do not know what I would have done without this data!.
I also like to thank my friends Asmamaw Adamau, Joel Denis, Mesfin Bekalo and Tigabu Dagne for their support and suggestions.
Finally, I would like to thank my parents who were always supporting and encouraging me with their best wishes.
iv
ANALYSIS OF URBAN LAND USE AND LAND COVER CHANGES:
A Case Study in Bahir Dar, Ethiopia
ABSTRACT
The high rate of urbanization coupled with population growth has caused changes in land use and land cover in Bahir Dar, Ethiopia. Therefore, understanding and quantifying the spatio- temporal dynamics of urban land use and land cover changes and its driving factors is essential to put forward the right policies and monitoring mechanisms on urban growth for decision making. Thus, the objective of this study was to analyze land use and land cover changes in Bahir Dar area, Ethiopia by applying geospatial and land use change modeling tools. In order to achieve this, satellite data of Landsat TM for 1986 and ETM for 2001 and 2010 have been obtained and preprocessed using ArcGIS. The Maximum Liklihood Algorithm of Supervised Classification has been used to generate land use and land cover maps. For the accuracy of classified land use and land cover maps, a confusion matrix was used to derive overall accuracy and results were above the minimum and acceptable threshold level. The generated land cover maps have been run with Land Change Modeler for quantifying land use and land cover changes, to examine land use transitions between land cover classes, to identify gain and losses of built up areas in relation to other land cover classes and to asses spatial trend of built up areas. Finally, Land Change Modeler has been run to model land use and land cover changes in Bahir Dar area and to predict future urban land use changes. To achieve this, four model variables that explain urban growth and six land cover transitions were incorporated in the modeling process. Multi-layer perceptron neural network was used to model the transition potential maps and achieved an accuracy of 61%. This result was acceptable to make actual prediction using Markov chain analysis for year 2010. Validation results showed that the model (Land Change Modeler) had a lower accuracy in simulating changes for the year 2010. Generally, the results of this study have shown that there was an increased expansion of built up areas in the last 25 years from 1.5% in 1986 to 4.1 % in 2001 and 9.4% in 2010 at the expense of agricultural areas. The spatial trend of built up areas also showed that there was a growing trend in the western part of Bahir Dar relative to other directions. Therefore, the findings of this study could provide as decision making for urban planning.
v
KEYWORDS
Bahir Dar
Change detection
Geographical Information system Image classification
Land Change Modeler
Land use and land cover change Remote sensing
vi
ACRONYMS
ANRS - Amhara National Regional State ANN - Artificial Neural Network
CA - Cellular Automata
CORINE- Co-ordination of Information on the Environment CSA - Central Statistical Agency
DEM - Digital Elevation Model EEA - European Environment Agency ETM- Enhanced Thematic Mapper GIS - Geographical Information System GLCF - Global Land Cover Facility
IGBP - International Geosphere and Biosphere Programme IHDP - International Human Dimensions Programme LCM - Land Change Modeler
MCE - Multi Criteria Evaluation MLP - Multi Layer Perceptron
OIES - Office of Interdisciplinary Earth Studies
REDD - Reducing Emissions from Deforestation and Forest Degradation SSA - Sub-Saharan African
SSE - Supervised Spatial Encoder
UNFPA - United Nations Population Fund USGS - United States Geological Survey WGS -World Geodetic System
vii
TABLE OF CONTENTS
ACKNOWLEDGMENTS ... iii ABSTRACT ... iv KEYWORDS ... v ACRONYMS ... viTABLE OF CONTENTS ... vii
INDEX OF TABLES ... x
INDEX OF FIGURES ... xi
1. INTRODUCTION ... 1
1.1. Background of the Study ... 1
1.2. Statement of the Problem ... 2
1.3. Objective of the Study ... 3
1.4. Research Questions ... 4
1.5. Significance of the Study ... 4
1.6. Structure of the Thesis ... 4
2. LITERATURE REVIEW ... 6
2.1. Land use and Land cover Changes ... 6
2.2. Urban Land use Changes ... 8
2.3. Trends of Urban Growth ... 10
2.4. Land use and Land cover Change Studies in Ethiopia ... 11
2.5. The Role of Remote Sensing on Land use and Land cover Changes ... 14
2.6. Image Classification ... 15
2.6.1. Object-Oriented Image Classification Methods ... 16
2.6.2. Pixel-Based Image Classification Methods ... 16
2.6.3. Contextual Image Classification Approaches ... 17
2.7. Land use Change Detection Analysis ... 17
viii
2.8.1. Image Regression Method ... 19
2.8.2. Image Ratio Method ... 19
2.8.3. Image Differencing Method ... 19
2.8.4. Post Classification Method ... 20
2.9. Introduction to Land use Change Modeling ... 20
2.10. Land use Change Models ... 21
2.10.1. Spatially-Explicit Econometric Models ... 22
2.10.2. Spatial Allocation Models ... 23
2.10.3. Agent-Based Models ... 23
2.11. Markov Chain Models ... 24
2.12. Land Change Modeler ... 25
3. DATA AND METHODOLOGY... 27
3.1. Description of the Study Area ... 27
3.1.1. Population ... 28
3.1.2. Physiographic Nature of the Study Area ... 28
3.2. Methodology ... 31
3.2.1. Data and Processing ... 32
3.2.2. Nomenclatures of Land cover Classes ... 33
3.2.3. Image Classification ... 34
3.2.4. Accuracy Assessment ... 35
3.3. Application of LCM for Land use Modeling ... 36
3.3.1. Change Analysis with LCM ... 37
3.3.2. Transition Potential Modeling with LCM ... 37
3.3.3. Change Prediction and Validation ... 44
4. RESULTS AND DISCUSSIONS ... 46
4.1. Classification and Validation results of Land cover Maps ... 46
4.2. Accuracy Assessment of the Classification ... 48
4.2.1. User's Accuracy ... 49
ix
4.2.3. Overall Accuracy ... 51
4.3. Land cover changes of Built up areas ... 52
4.4. Analysis of Land cover maps using LCM ... 53
4.4.1. Change Analysis Results of LCM... 53
4.4.2. Transition of Land cover Classes ... 56
4.4.3. Spatial Trend of Change ... 56
4.5. Model Simulations and Validations ... 58
5. CONCLUSIONS AND RECOMMENDATIONS ... 63
5.1. Conclusions... 63 5.2. Recommendations ... 65 BIBLIOGRAPHY ... 66 APPENDICES ... 76 Appendix A ... 76 Appendix B ... 79
x
INDEX OF TABLES
Table 3.1: Total Population of Bahir Dar 1984-2007 ...28
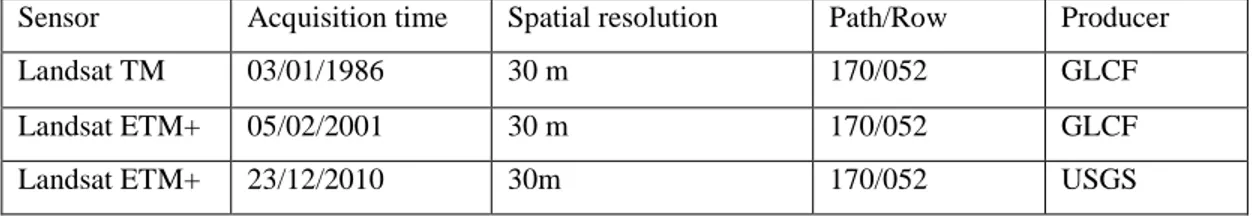
Table 3.2: The characteristics of landsat satellite data used in this study...32
Table 3.3: Land cover classes nomenclature...34
Table 4.1 Area statistics of the land use and land cover units from 1986-2010...48
Table 4.2: Confusion matrix for land cover map of 1986...50
Table 4.3: Confusion matrix for land cover map of 2001...50
Table 4.4: Confusion matrix for land cover map of 2010...51
Table 4.5: Built and non built-up areas between 1986 - 2010...52
Table 4.6: Comparison of changes in land cover classes between 1986-2010 using LCM...55
xi
INDEX OF FIGURES
Figure 2.1: World's urban and rural population size estimated and projected,
1950–2030...10
Figure 2.2: Classification of Models based on structure...22
Figure 3.1: Map of the study area...27
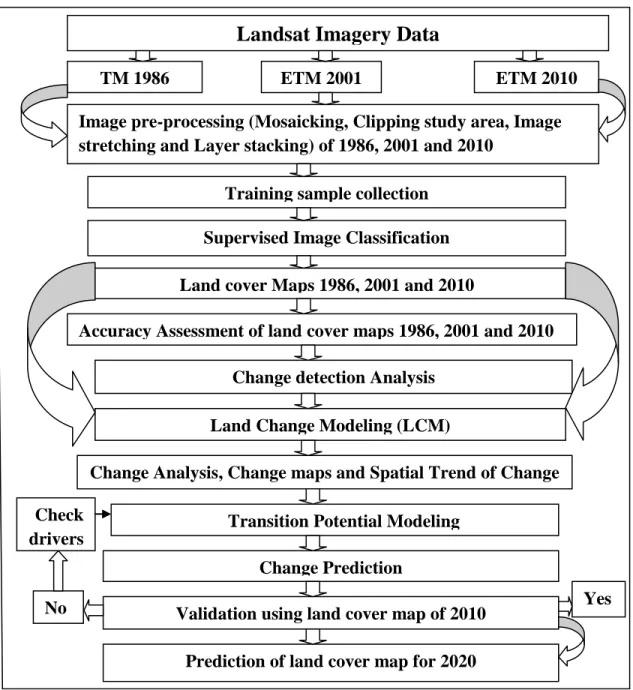
Figure 3.2: Flow chart of the methodology...31
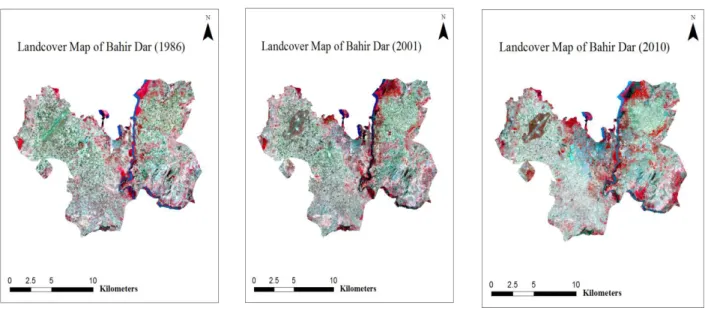
Figure 3.3: False color composite of 1986 (left), 2001 (middle) and 2010 (right)...33
Figure 3.4: Constraints...39
Figure 3.5: Maps of standardized factors...41
Figure 3.6: Illustration of a three-layered MLP...44
Figure 4.1: Land cover map of Bahir Dar for 1986 (a), 2001 (b) and 2010 (c)...47
Figure 4.2: Built up and Non built up areas for 1986 (left), 2001 (middle) and 2010 (right) respectively...53
Figure 4.3: Gains and losses of land cover classes in (ha)...54
Figure 4.4: Contributions of land cover classes to built up areas in (ha)...55
Figure 4.5: Map of spatial trend of changes in built up areas between 1986- 2010...57
.Figure 4.6: Land cover maps for 2010 actual (left) and simulated (right)...59
Figure 4.7: Prediction correctness and error map based on land cover maps of 2001 (reference), 2010 (reference) and 2010 (simulated)...60
1
CHAPTER ONE
1. INTRODUCTION
1.1. Background of the StudyRapid urbanization has been the main theme of urban studies in developing countries since the explosion of rates of growth in the 1960's and 1970's in very large cities (Barros, 2004). Like other anthropogenic-environment interactions, urban land cover changes respond to socioeconomic, political, cultural, demographic and environmental conditions, largely characterized by a concentration of humans (Masek et al, 2000). In spite of its small area coverage relative to the earth's surface, dynamic urban growth processes, particularly the expansion of urban population in a larger extent and urbanized area, have a significant impact on natural and human environment at all geographic scales (Herold et al, 2005).
According to the United Nations report on World Urbanization Prospects, the world urban population is expected to increase by 72 % by 2050, from 3.6 billion in 2011 to 6.3 billion in 2050. Thus, the urban areas of the world are expected to absorb all the population growth expected over the next four decades while at the same time people are moving to rural areas by assuming that rural life is seen as simpler and less stressful. Furthermore, in the cities and towns of less developed regions the expected population growth is more concentrated than the developed regions of Europe and America (Desa, 2012).
Associated with the rapid expansion of urbanization, a lot of land has been converted from rural to urban. From the land use and land cover change point of view, expansion of urban areas is of greater importance because of its strong effect on other land cover classes, such as agricultural lands, non built areas, forests and others. Ethiopia, having the second largest population in Africa has a total of over 80 million population. It has a 2.3% of annual growth rate and having 4.6% average annual urban growth rate (Haregeweyn et al, 2012). In spite of its low urbanization rate compared to other African countries, the impact of land
2
use and land cover changes become a big challenge to the country. Bahir Dar is a region in Ethiopia, where this study conducted, has also experienced greater changes. Analyzing and modeling these changes, therefore, provide a better information for urban planners and decision makers to design strategies and solutions to manage the impacts of land use and land cover changes in both spatial and temporal scales.
Understanding the rapid growth dynamics, developments of urban sprawl and quantifying the spatial extent of urbanization requires a geospatial tool (Araya and Cabral, 2010). Since accurate and timely information of land use and land cover change is highly necessary to many groups, remotely sensed data can be used as it provides the land cover information. It is also important for estimating levels and rates of deforestation, habitat fragmentation, urbanization, wetland and soil degradation and many other landscape-level phenomena (Vogelmann et al, 2001). The main focus of this study is, therefore, detecting and analyzing land use and land cover changes in Bahir Dar area by integrating remote sensing, Geographical Information System (GIS) and spatial modeling tools.
1.2. Statement of the Problem
Land as a finite and a potentially productive natural resource represents our basic food production facility. However, the diversity of residents and intensive use of the resources through the increasing of population coupled with economic activities and global market drive unprecedented land use and land cover changes (Ezeaku and Davidson, 1992). These changes lead to transformations in the hydrological, ecological, geomorphologic and socioeconomic systems and which are often neglected by both rural and urban administrations. Thus, special attention and continuous assessment are required for monitoring and planning urban development and decision making.
Bahir Dar city is perceived as a place where one could have a better life; because of better opportunities, higher salaries, better services, and better lifestyles. It is also considered as one of the most beautiful, well planned, and safest cities by many standards, and in 2002 it was awarded the UNESCO Cities for Peace Prize for addressing the challenges of rapid
3
urbanization (Wikipedia, 2013). As a result an influx of people is moving from rural areas. This would have significant impact on the surrounding ecosystem: loss of agricultural land, destruction of forest cover, water depletion and on the benefits generated from the land. Because of this rapid growth on the urban-rural fringe, planners and policy makers lack accurate, timely and cost effective urban land use data which is most essential to make decision concerning land resource management. Quantifying changes in land use and land cover and modeling of it for future time is, therefore, important in Bahir Dar, Ethiopia for monitoring and resolving the negative consequences. This could be useful for better land use management and environmental development in the study area.
1.3. Objective of the Study
The main objective of this study was to detect and analyze land use and land cover changes in Bahir Dar area by integrating remote sensing techniques and Land Change Modeler. The specific objectives of this study were:
To produce land use and land cover maps of the study area for selected times; To analyze the dynamics of urban land use changes within the selected times; To evaluate the accuracy assessment of the classification techniques;
To quantify gain and losses of land cover classes, examine land use transitions and asses spatial trends of changes in built up areas using Land Change Modeler;
To evaluate the predictive power of the Land Change Modeler in simulating and predicting of urban land use in Bahir Dar;
To recommend possible mitigation measures to minimize the effects of land use changes.
4 1.4. Research Questions
As this study mainly focuses on built up areas, the following research questions were set: • Were there any major changes in the built up areas within the study periods?
How was the spatial trend of changes (growth) of the built up areas during the study periods?
How was the contribution of land cover classes for the growth of built up areas? Had the model been satisfactory in predicting and simulating the changes?
1.5. Significance of the Study
Land use and land cover change is a major aspect of the pressure on the limited land resources that is driven by different biophysical and anthropogenic factors particularly population growth. Therefore, analyzing and modeling of urban land use changes provide greater importance to the research community, urban planners, stake holders as well as decision making groups in terms of understanding the impacts of land use land cover changes in Bahir Dar area.
The results of this study could provide better information about the changes in urban land use quantified through integrated application of GIS, remote sensing and land change modeler. In addition, it also provide the opportunity to understand the trends of changes in built up areas as a result of driving variables. Moreover, the findings of this study will be an initial input for future research direction for interested groups in the area.
1.6. Structure of the Thesis
The first chapter introduces statement of the problem and introduction, study objectives, research questions and significance of the study. The next section, chapter two, concentrates on theoretical literature review and related work for this study. This section presents brief understanding of land use and land cover changes, land use change models, the use of remote sensing in land use and land cover change, image classification, change detection methods and accuracy assessments of land cover maps generated in the
5
classification. The third chapter focuses on the general methodology followed, the data sets used in this study and detail explanation of the study area. This chapter highlights all the procedures and techniques applied for image classification and land use modeling including the tools such as ArcGIS and Land Change Modeler. The results and discussions is the fourth chapter which presents the quantified results from image classification and land use change modeling. In this section, land cover maps generated using maximum likelihood classification, change detection and accuracy assessments of the classification are discussed in detail. Moreover, change analysis using Land Change Modeler, spatial trends and simulation of land cover maps has been performed. Validation of the simulated land cover maps has been done for comparison of model performance. The last chapter presents conclusions and recommendations. In this section, key findings and critical points that need further treatment has been forwarded as a recommendation for future work.
6
CHAPTER TWO
2. LITERATURE REVIEW
The earth's surface has been changed considerably over the past decades by humans because of urbanization, deforestation and agriculture. Even though the conversion of land to agriculture and deforestation rates vary across the world, the number of people residing in cities has been increasing continuously. Urbanization has been increasing since World War II, and has not shown any sign of decline and is likely to continue into the twenty-first century (Oğuz, 2004). In this chapter, pervious related published works are discussed in order to strengthen this specific study.
2.1. Land use and Land cover Changes
The definition of land use and land cover has been used interchangeably in the land use research community because of the availability of many existing information systems. However, these two terms explain two different issues and meanings. Land cover refers to the observed biophysical cover on the earth's surface including vegetation, bare soil, hard surfaces and water bodies. Whereas land use is the utilization of land cover type by human activities for the purpose of agriculture, forestry, settlement and pasture by altering land surface processes including biogeochemistry, hydrology and biodiversity (Di Gregorio and Jansen, 2000).
Land use and land cover changes became prominent as a research topic on the global environmental change several decades ago with the idea of processes in the earth's surface influence climate. In early 1980's the significance impact of land use and land cover change on the global climate via carbon cycle was understood where terrestrial ecosystems acted as a source and sinks due to the changes. Following this, the forthcoming volume of the 1991 Global Change Institute of the Office of Interdisciplinary Earth Studies(OIES) dedicated to land use and land cover changes at global level by explaining the major recent trends of changes, their consequences in environment, human causes on it as well as data
7
and modeling of changes (Meyer and Turner, 1992). Latter, under the support of land use and land cover change project of the International Geosphere and Biosphere Programme (IGBP) and International Human Dimensions Programme on Global Environmental Change (IHDP), the research community has identified three basic issues. These were understanding the causes of land use and land cover changes, how to quantify it and how to apply models of predicting the changes (Lambin et al, 2003).
Conversion and modification are the two forms of land cover changes described by Meyer and turner (1992) where the former is a change from one class of land cover to another (e.g from grassland to cropland). The latter is, however, a change within a land cover category (e.g thinning of a forest or a change in composition). Land cover changes due to human activities drive land use and hence a single class of cover could support multiple uses (forest used for combinations of timbering, slash and burn agriculture, fuel wood collection and soil protection). On the other hand, a single system of land use can maintain several covers (as certain farming systems combine cultivated land, improved pasture and settlements).
Changes in land use and land cover caused through direct and indirect consequences of human activities on the environment for the purpose of having better life. One of the direct impact of humans is population growth where its increase and decrease have effects on land use especially in developing world at longer time scales. According to Lambin et al (2003), it can also be caused by the mutual interactions between environmental and social factors at different spatial and temporal scales as land use and land cover change is a complex process.
Verburg et al (2002) showed that causes of land use and land cover change can be
categorized as direct (proximate) or indirect (underlying). The direct causes comprise human activities that could arise from the continuous use of land and directly alter land cover which reflect that human are driving forces. They are generally operated at local levels and explain how and why local land cover and ecosystem processes are modified directly by humans. On the other hand, indirect causes are fundamental forces that
8
strengthen the more direct causes of land cover changes. These causes are resulted due to the complex interaction of social, political, economic, technological and biophysical variables.
Land use and land cover changes have significant consequences on climate change, hydrology, air pollution and biodiversity. Meyer and Turner (1992) mentioned in their study that it caused a various microclimatic changes. The rise in global surface temperature is associated with deforestation through changes in land use. This in turn caused a strong warming in urban environment called urban heat island. Their study also showed water pollution occurred due to land cover changes from cultivation to settlement (urban areas). It has been reported also that loss of forest species has wide range of effects on biodiversity.
Identifying the causes and impacts of land use and land cover change require understanding both how people make land-use decisions and how specific environmental and social factors interact to influence these decisions (Lambin et al, 2001). In order to understand the impacts of dynamic land use and land cover changes, the use of land use change models become an advantage since they provide information of land use trajectories by projecting for the future. This ability of models, however, important for better environmental management and land use planning (Verburg et al, 2002).
2.2. Urban Land use Changes
From a broader point of view urbanization is one of the ways in which human activities altering global land cover. Although urbanization trend is global, according to the reports of the United Nations Centre for Human Settlements (Habitat, 2001), it has showed most remarked changes in developing countries associated with the migration of rural people to cities for better opportunities. Following this there had been estimated a rapid growth of population in urban areas at an average rate of 2.3% per year between 2000-2030 (
9
Urban growth, particularly the movement of residential and commercial land use to rural areas at the periphery of metropolitan areas, has long been considered as a sign of regional economic vitality (Yuan et al, 2005). However, its importance become unbalanced with impacts on ecosystem, greater economic differences and social fragmentation. It can be defined as the rate of increase in urban population. Dynamic processes due to urban change, especially the tremendous worldwide expansion of urban population and urbanized area, affect both human and natural systems at all geographic scales (Brockerhoff, 2000). Araya and Cabral (2010) have shown that urban growth in Setúbal and Sesimbra, Portugal has been increased significantly between 1990 and 2000 by 91.11%. Much of this growth, however, was towards the periphery of urban areas due to the coalescence of a number of smaller settlements as well as through the consumption of agricultural land. The growth was predicted to continue in the future and would have wide range of consequences on natural resources. Their study also noted that population growth was one of the major driving factor for such rapid growth in the study area.
Traditionally demographic data has been used to asses urban sprawl (Carlson and Traci,
2000). Meanwhile the use of aerial photography become important to update land cover
maps. Since land cover changes at regional level occurred increasingly due to human activity, the changes couldn't be realized in the community. Therefore, accurate and updated information is required to design strategies for sustainable development and to improve the livelihood of cities.
The ability to monitor urban land cover and land use changes is highly desirable by local communities and policy decision makers. Due to the increased availability and improved quality of multi spatio-temporal data and new analytical techniques, nowadays it is possible to monitor urban land cover and land use changes and urban sprawl in a timely and cost-effective way (Yang et al, 2003). Therefore, the use of satellite data provides for regional planning and urban ecology.
10 2.3. Trends of Urban Growth
The world is undergoing the largest wave of urban growth in history. According to the United Nations Population Fund (UNFPA, 2013), rapid population growth has been concentrated in towns and cities of the world. The report also projected that by the year 2030 the vast majority of this growth will be observed in the developing world of Africa and Asia where urban growth is highly concentrated. Because cities offer a lot of opportunities such as jobs and sources of income than the corresponding rural areas, they attracted a lot of people.
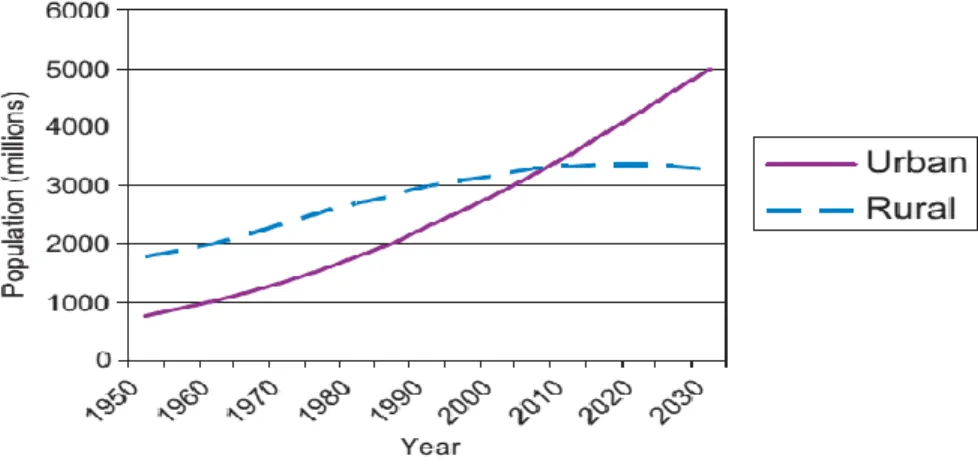
Following the rapid increase of population in urban areas, the growth of the world’s rural population has shown a slowly decreasing pattern as indicated in figure 2.1 below.
Figure 2.1: World's urban and rural population size estimated and projected, 1950–2030, (Source: Cohen, 2006).
It is clearly shown in figure 2.1 that when the world’s urban population increased four-fold between 1950 and 2003, the world’s rural population less than doubled going from 1.8 billion in 1950 to 3.2 billion in 2000 (Cohen, 2006). Regarding to projection of population growth, the world’s urban population is expected to increase by almost 2 billion over the next 30 years, whereas the world’s rural population is actually expected to decline slightly falling from 3.3 billion in 2003 to 3.2 billion in 2030.
11
Ethiopia is one of the second largest populated country in Africa with a total population of over 80 million and having an annual growth rate of 3.02%. The country is experiencing an average annual urban growth rate of 4.6%, which is a high rate by world standard (Cohen, 2004). Even though urbanization rates differ depending on the methodologies applied, Ethiopia's urbanization is low relative to other Sub-Saharan African (SSA) countries. Since the majority of the population (85%) is living in the rural areas, where agriculture is the backbone of the country's economy, it is evident that urban growth to be low. The self-sufficiency of agriculture also contributed to reinforcing of the rural peasant life from their territory. According to Central Statistical Agency of Ethiopia (CSA), it is only 16% of the population lived in urban areas. Among these are in small cities and towns (Schmidt and Kedir, 2011).
The city of Bahir Dar, where this study is conducted, is located in the north-western part of Ethiopia. It is one of the fastest growing city in the country. The urban area is believed to be in a dynamic state of expansion following the nomination of the city as the capital of Awraja, an administrative unit or hierarchy next to a region used during the previous regimes, in1948. Following the fall of the former government of Ethiopia in 1991, Bahir Dar was selected as the seat of the regional government of the Amhara National Regional State (Haregeweyn et al, 2012).
2.4. Land use and Land cover Change Studies in Ethiopia
As 85% of the total population live in rural areas, 85% of the economy is dependent on agriculture with traditional farming (plough), the growth of urban population from time to time, with an increase of migration of rural population to cities for better life and the encouraging land lease policy to investors become important to study land use and land cover changes and its impacts in Ethiopia to design management and monitoring policies. Researches on land use and land cover change in Ethiopia involved in different regions and disciplines depending on the availability of data and tools to perform analysis. However, most of the studies have focused on deforestation, the expansion of cultivated land to land
12
degradation, river catchments and watersheds, natural ecosystems and forests as well as the associated consequences. Among these: Amsalu et al (2007); Bewket and Abebe (2013); Tekle and Hedlund (2000); Zeleke and Hurni (2001) were found. While urban growth and its impacts are relatively studied in larger and megacities (a metropolitan area of more than ten million people) worldwide. Urban growth and modeling studies in cities of developing countries like, Ethiopia, were limited. However, few studies have been reported relatively such as: Haregeweyn et al (2012); Dorosh and Schmidt (2010); Zeleke and Hurni (2001); Amsalu et al (2007) and Bekalo ( 2009).
Zeleke and Hurni (2001) reported an expansion of cultivated land at the expense of natural forest cover between 1957 and 1982 in Dembecha area, north-western Ethiopia. The study also investigated a series trend of land degradation resulted due to the expansion of cultivated land on steep slopes at the expense of natural forests. Amsalu et al (2007) showed a significant decline in natural vegetation cover, however, there was an increase of plantation in Beressa watershed, in the central highlands of Ethiopia between 1957 and 2000. Yeshaneh et al (2013) also showed a significant decrease of natural woody vegetation of the Koga catchment since 1950 due to deforestation in spite of an increasing trend in eucalyptus tree plantations after the 1980's. Bewket and Abebe (2013) reported a reduction of natural vegetation cover, but an expansion of open grassland, cultivated areas and settlements in Gish Abay watershed, north-western Ethiopia.
Tegene (2002) reported a significant conversion of natural vegetation cover to cultivated land between 1957 and 1986 in Derekolli catchment of the South Welo Zone of Amhara Region, Ethiopia. Kindu et al (2013) investigated a significantly reduction of natural forest cover and grasslands, but an increase of croplands between 1973 and 2012 in Munessa, Shashemene landscape of the Ethiopian Highlands. A similar study by Tekle and Hedlund (2000) reported an increase of open areas and settlements as the expense of forests and shrub land between 1958 and 1986 in Kalu District, Southern Wello, Ethiopia.
The impacts of land use and land cover changes on the hydrological flow regime of the watershed have been reported in many studies. The impact is through altering the balance
13
between rainfall and evaporation and the runoff response. Muluneh and Arnalds (2011) reported an increment of a direct runoff Gum-Selassa and Maileba catchments annually from 1964 to 2006 in both catchments due to long-term changes of land use and land cover. A similar study reported the drying of Lake Cheleleka and the disappeared Lake Haramaya due to these long-term impacts. It was also reported by Geremew (2013) that land use and land cover changes affected the stream flow of gilgel Abbay watershed, Ethiopia. His study identified that there was an increase of stream flow by 16.26 m3/s during wet months and decreased by 5.41 m3/s from 1986 to 2001 as a consequence of conversion of cultivated land.
Land use and land cover changes in response to urban growth also reported by some studies that, an expansion of urban areas annually from 1957 to 2009 has been identified by Haregeweyn et al (2012) in the urban fringe of Bahir Dar area as a consequence of increasing population.Bekalo (2009) identified a significantly increase of urban areas from 34% in 1986 to 51% in 2000 in Addis Ababa, Ethiopia by the expense of agricultural land and vegetated areas driven by population growth.Dorosh and Schmidt (2010) also reported a significant urban growth for the last 3 decades as a result of increase in population of Ethiopian highlands. Muluneh and Arnalds (2011) cited on Haile (2004) that unsustainable growth of population contributed to environmental degradation especially in most populated areas such as in Ethiopian highlands.
From most of these studies it is evident that population pressure is one of the major drivers of land use and land cover changes through destruction of forest and vegetation cover for the purpose of agricultural and urban expansion as discussed by Zeleke and Hurni (2001) and Amsalu et al (2007). Population growth coupled with migration from rural to cities leads to further expansion of urban areas at the expense of vegetation cover which is commonly practiced in western highlands of Ethiopia according to Zeleke and Hurni (2001) study.
14
2.5. The Role of Remote Sensing on Land use and Land cover Changes
Maktav et al (2005) showed that traditional data collection methods such as demographic data, census and sample maps were not satisfactory for the purpose of urban land use management. Accurate information of land use and land cover change is therefore highly essential to many groups. To achieve this information, remotely sensed data can be used since it provides land cover information. Remote sensing refers to the science or art of acquiring information of an object or phenomena in the earth's surface without any physical contact with it. And this can be done though sensing and recording of either reflected or emitted energy and the information being processed, analyzed and applied to a given problem (Campbell, 2002).
Remote sensing is important for estimating levels and rates of deforestation, habitat fragmentation, urbanization, wetland degradation and many other landscape-level phenomena. Such useful information can be then integrated into many regional to global scale models, including those that are used to develop parameters for carbon fluxes and hydrological cycles. Therefore, remote sensing data can be used as the basis for answering important ecological questions with regional to global implications (Vogelmann et al, 2001). Herold et al (2005) also noted that one of the advantages of remote sensing is its ability to provide spatially consistent data sets covering large areas with both high detail and high temporal frequency, including historical time series.
Over the past decades almost all the remote sensing researches have given more attention to natural environment than urban areas. The reason was that urban areas have complex and heterogeneous by nature (Melesse et al, 2007). However, Herold et al (2005) reported that with the availability of high resolution imagery together with suitable techniques, urban remote sensing become a rapidly gaining interest in the remote sensing community. Supported by advanced technology and satisfying social needs, urban remote sensing has become a new field of geospatial technology and applicable in all socioeconomic environments (Melesse et al, 2007).
15
Following this, a number of applications of remote sensing for urban studies have shown
the potential to map and monitor urban land use and infrastructure. Moreover, Herold and
Menz (2001) showed urban land use information in high thematic, temporal and spatial
accuracy, derived from remotely sensed data, is an important condition for decision support of city planners, economists, ecologists and resource managers. Generally, land use and land cover changes have a wide range of impacts on environmental and landscape attributes including the quality of water, land and air resources, ecosystem processes and functions (Rimal, 2011). Therefore, the use of remote sensing data and analysis techniques provide accurate, timely and detailed information for detecting and monitoring changes in land cover and land use.
2.6. Image Classification
In order to examine and asses environmental and socioeconomic applications such as: urban change detection and socioeconomic variables, image classification results with better accuracy are mandatory. Image classification refers to the extraction of differentiated classes or themes, usually land cover and land use categories, from raw remotely sensed digital satellite data (Weng, 2012). Image classification using remote sensing techniques has attracted the attention of research community as the results of classification are the backbone of environmental, social and economic applications (Lu and Weng, 2007). Because image classification is generated using a remotely sensed data, there are many factors that cause difficulty to achieve a more accurate result. Some of the factors are:
The characteristics of a study area,
Availability of high resolution remotely sensed data, Ancillary and ground reference data,
Suitable classification algorithms and the analyst’s experience, and Time constraint.
These factors highly determine the type of classification algorithm to be used for image classification.
16
There are various image classification methods that can be applied to extract land cover information from remotely sensed images (Lu and Weng, 2007). However, their
application depends on the methodology and type of data to be used. Some of these
methods are: artificial neural networks, fuzzy-sets and expert systems. In a more specified way, image classification approaches can be categorized as supervised and unsupervised, or parametric and nonparametric, or hard and soft (fuzzy) classification, or per-pixel, sub-pixel and per-field. Some of the most commonly used image classification methods are discussed below.
2.6.1. Object-Oriented Image Classification Methods
This method of image classification is based on identifying image objects, or segments with similar texture, color and tone of spatially contiguous pixels (Gao and Mas, 2008;
Weng, 2012). This approach allows for consideration of shape, size, and context as well as
spectral content (MacLean and Congalton, 2012). The classification stage starts by grouping the neighboring pixels into meaningful areas. Qian et al (2007) noted that in object oriented classification approach, single pixels cannot be classified rather homogenous image objects are extracted during segmentation step. Image analysis in object-oriented is based on contiguous, homogeneous image regions that are generated by initial image segmentation.
2.6.2. Pixel-Based Image Classification Methods
Pixel-based classification methods automatically categorizes all pixels in an image into land cover classes fundamentally based on spectral similarities (Qian et al, 2007; Weng, 2012). These types of classifiers develop a signature by summing up all pixels. Thus, the developed signature contains the necessary things found in the training pixels but does not contain the influence of mixed pixels (Weng, 2012). According to Tadesse et al (2003), there are two primary types of pixel-based classification algorithms applied to remotely sensed data: unsupervised and supervised.
17
Unsupervised image classification algorithms are based on categorizing each pixel to unknown cluster centers and then moving from one cluster center to another in a way that the Supervised Spatial Encoder (SSE) measure of the preceding section is reduced data. Whereas in the case of supervised image classification the analyst has previous knowledge about pixels to generate representative parameters for each land cover class of interest. The Maximum Likelihood classification, under the category of supervised classification, which is the most widely used per-pixel method by taking in to account spectral information of land cover classes (Qian et al, 2007).
Although pixel based classification methods have been widely accepted and applicable, however, there are limitations in including spatial pattern during classification. This happened especially in Maximum Likelihood classification methods where they consider only spectral information by neglecting contextual and texture information (Zhou and Robson, 2001; Dean and Smith, 2003).
2.6.3. Contextual Image Classification Approaches
In the case of maximum likelihood classification technique the pixels are assigned to represent classes taken in to consideration and this is done through observing of each pixel. However, there could be misclassification errors especially during the presence of random noise which causes different classes to be appeared similar (Sharma and Sarkar, 1998). To avoid such problems, contextual classification techniques have been chosen which exploits spatial information among neighboring pixels. These techniques are based on the assumption that the response and class of two spatially neighboring pixels are highly related. The advantage of using contextual techniques will improve image classification results by reducing error rates related to spectral properties (Weng, 2012).
2.7. Land use Change Detection Analysis
Change detection can be defined as the process of identifying differences in the state of object or phenomena by observing them at different times by using remote sensing techniques (Singh, 1989). Essentially, it also involves the ability to quantify temporal
18
effects using multi-temporal data sets. Because of repetitive spatial coverage at short time intervals and consistent image quality, change detection is considered as one of the major applications of remotely-sensed data obtained from Earth-orbiting satellites (Singh, 1989). Change detection has a wide range of applications in different disciplines such as land use change analysis, forest management, vegetation phenology, seasonal changes in pasture production, risk assessment and other environmental changes (Singh, 1989). The main objective of change detection is to compare spatial representation of two points in time frame by controlling all the variances due to differences in non target variables and to quantify the changes due to differences in the variables of interest (Lu et al, 2004). A change detection research to be good, it should provide the following vital information: area change and rate of changes, spatial distribution of changed types, change trajectories of land-cover types and accuracy assessment of change detection results.
Quantifying land use and land cover changes and applying suitable change detection methods highly depend on the type of changes that happened in landscapes and how those changes are noticeable in images. The changes could be continuous or categorical. According to Abuelgasim et al (1999), change detection in continuous land cover changes focuses on measuring the degree of changes in amount or concentration through time. However, in the case of categorical land cover changes, the goal of change detection is to identify new land cover classes and changes between classes through time.
2.8. Change Detection Techniques using a Remotely Sensed Data
The selection of suitable method or algorithm for change detection is important in producing a more accurate change detection result since constraints such as spatial, spectral, thematic and temporal properties affect digital change detection. Some techniques such as image differencing can only provide change or non-change information, while some techniques such as post classification comparison can provide a complete matrix of change directions. According to Bekalo (2009), different change detection methods could produce different changes of maps depending on the algorithm they followed.
19
Although there are many change detection methods in remote sensing of image classification, recently researchers divided in to image ratio, image regression, image differencing and the method of change detection after classification (post classification method) (Xu et al, 2009; Bekalo, 2009). The classification of methods mainly depend on data transformation procedures if exists and analysis techniques applied. So, based on these conditions the current common methods of change detection are discussed below:
2.8.1. Image Regression Method
In image regression method of change detection, pixels from time t1 are assumed to be a linear function of the time t2 pixels (Singh, 1989). Under this assumption, it is possible to find an estimate of image obtained from t2 by using least-squares regression. According to Abuelgasim et al (1999), image regression technique takes in to account differences in the mean and variance between pixel values for different dates. This consideration minimizes the influence of differences in atmospheric conditions. In detecting changes of urban areas the regression procedure has more advantage than image differencing technique.
2.8.2. Image Ratio Method
In image ratio method, images must be registered beforehand and rationed band by band. The results of image ratio are interpreted with a threshold of values. If the ratio of the two images is 1, it means that there is no change in the land cover classes where as a ratio value of greater or less than 1 indicates a change in land cover classes (Singh, 1989; Bekalo, 2009). This method rapidly identifies areas of changes in relative terms.
2.8.3. Image Differencing Method
Image differencing is one of the most extensively applied change detection method. It can be applied to a wide variety of images and geographical environment. In this technique, images of the same area, obtained from times t1 and t2, are subtracted pixel wise. It is generally conducted on the basis of gray scale which used to show the spatial extent of
20
changes in the two images. A threshold value is required for the gray of difference image in order to examine the changed and unchanged regions (Xu et al, 2009).
2.8.4. Post Classification Method
This method is the most simple and obvious change detection based on the comparison of independently classified images (Singh, 1989). Maps of changes can be produced by the researcher which shows a complete matrix of changes from times t1 to time t2. Based on this matrix, if the corresponding pixels have the same category label, the pixel has not been changed, or else the pixel has been changed (Xu et al, 2009).
2.9. Introduction to Land use Change Modeling
Land is utilized for multiple purposes and it is critical that land cover change be monitored and evaluated for both its negative and positive consequences. Dynamic urban land use and land cover change processes caused due to human activities have a wide range of effects on the global climate change either directly or indirectly (Herold et al, 2001; Lambin et al, 2001). It also affect human and natural systems and contribute to changes in carbon exchange and climate through a range of feedbacks. Its future changes are also a function of numerous driving variables (Lambin et al, 2003; Veldkamp and Lambin, 2001). Some of these drivers are population change, economic activity and growth as well as biophysical conditions and are most important at a range of geographic scales.
Bhatta (2010) noted that, the first and foremost reason for urban growth is an increase of urban population. Urban areas attained rapid growth as a result of natural increase in population. This is due to uncontrolled family planning where birth rate is greater than death rate. The second one is migration to urban areas. Where migration is defined as the movement of people from rural to urban areas within the country.
Therefore, modeling of urban growth is a very essential step for further improvement of urban planning and land use management. The rising awareness and importance of
land-21
use models in the land use and land cover research community has led to the development of a wide range of land-use change models (Verburg et al, 2002).
2.10. Land use Change Models
Because of the significance impacts of land use and land cover changes, the use of land use change models become important to understand these changes and driving factors (Verburg et al, 2004). Models are representations of the real world, based on theoretical assumptions that represent systems(Verburg et al, 2002). Over the past decades, a range of land use change models have been invented by the land use modeling community for the land management needs as well as to analyze and project impacts for the future. Lambin et al (2001) described integrated modeling in a wider scale is an important technique in order to predict future scenarios.
Land use change models are tools which support the analysis of the causes and consequences of land use changes. They provide better understanding of the dynamics of systems to develop hypotheses that can be tested empirically. Verburg et al (2004) reported that they are useful for extracting complex driving forces that affect the spatio-temporal pattern of land use changes and impacts.
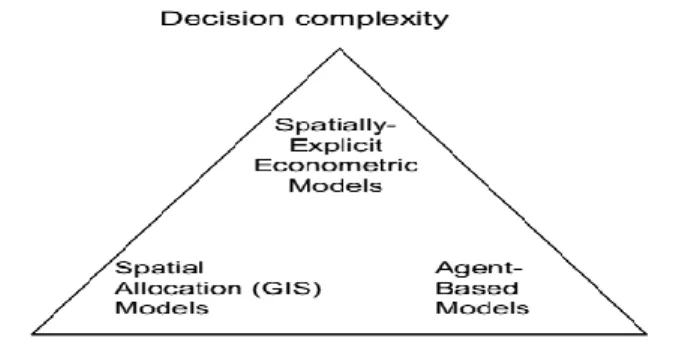
Literature has described a number of models depending on different disciplines such as on: landscape ecology, urban planning, statistics and geographic information science (Veldkamp and Lambin, 2001; Verburg et al, 2004). Comparing the performance of models is a complex issue because of its high dependency on disciplinary perspectives, applied methods, data types used and modeling goals. For example: the GEOMOD model simulates change between two land categories where as Markov chain and the cellular automata Markov model simulate change among several categories (Brown et al, 2004). According to Wainger et al (2007), for different applications of land use change modeling, models were categorized in to three major types as: spatially explicit econometric models, spatial allocation (GIS neighborhood rules) and agent-based models as shown in figure 2.2 below. The criteria to group these models is based on structure and methodologies.
22
Structure in this case refers to the spatial relationships between the components of a landscape.
Figure 2.2: Classification of Models based on structure.(Source: Wainger et al, 2007)
2.10.1. Spatially-Explicit Econometric Models
Spatially-explicit econometric models were developed by economists for the purpose of characterizing decisions of agents converting land between uses. The spatially explicit economic models are known by conceptualization of the conversion decision as an economic transaction where expected payoff must exceed costs. The advantage of these types of models is that its ability to share explanatory variables with other types of models developed by other disciplines (Irwin and Geoghegan, 2001). However, these models have limitations of detailed data of regionally consistent formats and also unable to model conditions that deviate from historic norms.
Suarez-Rubio et al (2012) reported that such models provide information by projecting spatial distribution of land use conversion by using transaction data. This enables to determine the maximum profits by considering factors that affect the expected result. Understanding how likely land development is changing with different policy scenarios is one of the expected importance of spatially-explicit econometric models.
As mentioned in previous topics, the availability of infrastructure and better developments as well as recreational areas allowed urban growth is towards to urban-rural fringe driven by increase of population. Suarez-Rubio et al (2012) showed that urban-rural fringe
23
development in metropolitan areas has showed a growth of more than twice as fast as development in metropolitan urban areas. Their study also emphasized that urban-rural fringe development by the year 2000 covered about 25% of the contiguous United Sates. Modeling the trend of urban-rural fringe areas therefore important for better management and mitigate the consequences. Thus, spatially explicit models become a good choice to predict land use changes since they consider social and environmental causes and consequences ( Cabral and Zamyatin, 2009).
2.10.2. Spatial Allocation Models
Spatial allocation models have been developed for the purpose of identifying neighborhood conditions that have connections with land conversion specifically for residential and commercial development. They can also used for generating future land use changes. A transition rule is required for modeling the drivers of changes of new land use. Verburg et al (1999) also noted that the spatial pattern of land use through time can be determined by the components of landscape such as: human factors (population, technology and economic conditions) and biophysical constraints (soil, climate and topography). In order to describe the relationships between these factors, a decision rule is used. These models have the capability of generating a diffusion of growth near the areas of existing urban centers. Thus, there should be sufficient growth rules which help to generate new urban centers by limiting the diffusion otherwise variables that recognize patterns of land use must be considered (Wainger et al, 2007).
2.10.3. Agent-Based Models
Agent-based models comprises of simulation models where much attention has been given by the land use research community. They characterize systems in terms of independent but interconnected “agents” that have the ability to make “decisions” based on changing conditions. For most of the agent based models which used for land use modeling, higher temporal complexity could be taken as an accurate criteria to be chosen (Parker et al, 2002). The majority of these models are referred to as cellular models which includes
24
spatial modeling techniques such as cellular automata and Markov models. However, Parker et al (2003) showed they have different applications as cellular models focused on landscapes and transitions, where as agent-based models focused on human actions.
Agent based models have a wide range of applications such as archaeological reconstruction of ancient civilizations, modeling of infectious diseases as well as modeling of economic processes. Matthews et al (2007) have identified the five purposes of agent based models in the land use modeling community. These are policy analysis and planning, participatory modeling, explaining spatial patterns of land use, examining social science concepts and demonstrating land use functions.
Cellular Automata (CA) is a discrete dynamic system in which space is divided into regular spatial cells and time progresses in discrete steps. CA models can generate complex global patterns based on transition rules for simulation processes. The transition rules determine how a cell will evolve under certain conditions. These models have been widely used for simulating urban sprawl and land use dynamics (Cao et al, 2013). This study has integrated Markov chain model and Land Change Modeler. The descriptions and approaches of these models are discussed below.
2.11. Markov Chain Models
Markov chain models are relatively simple and more powerful to model complex processes and changes in land use for planning purposes. They provide better information for analyzing time series of system evolution (Levinson and Chen, 2005). A Markovian process is one in which the state of a system at time t2 can be predicted by the state of the system at time t1given a matrix of transition probabilities from each cover class to every other cover class.
A stationary property is one of the importance of these models since it integrates a transition probability matrix. This property is critical to Markov chain model especially for future predictions of land use. The stationarity of the transition matrix in turn helps to
25
inspect the validity of the model (Iacono et al, 2012). The MARKOV module in IDRISI can be used to create such a transition probability matrix (Eastman, 2012).
Markov Chain model to be considered as a system, it has to satisfy the following properties:
The sum of the rows of the probability matrix must be one
The probabilities of the transition matrix must be the same for any two periods Probabilities have no memory, that is, the state tomorrow depends only on the state
today (the Markov condition)
Time periods must be uniform in length or duration.
Markov chain model has a good quality of simplicity. It can also describe complex and long-term process of land use conversion in terms of simple transition probabilities.
2.12. Land Change Modeler
Land Change Modeler (LCM) for Ecological Sustainability is an integrated software environment within IDRISI oriented to the pressing problem of accelerated land conversion and the very specific analytical needs of biodiversity conservation. It was developed by Clark Labs for the purpose of assessing a variety of land change scenarios and contexts. This model adopts the Markov Chains analysis for time prediction, but with an automatic Multi-Layer Perceptron for a spatial allocation of simulated land cover scores
(Eastman, 2012).
In LCM, according to Eastman (2012), tools for the assessment and prediction of land cover change and its implications are organized around major task areas: change analysis, change prediction, habitat and biodiversity impact assessment and planning interventions. Also, there is a facility in LCM to support projects aimed at Reducing Emissions from Deforestation and Forest Degradation (REDD). The REDD facility uses the land change scenarios produced by LCM to evaluate future emissions scenarios. Because of its ability
26
to integrate various transitions involving same explanatory variables in to a single sub model, LCM is applied in this study.
From the reviewed literatures, Haregeweyn et al (2012) have investigated urban expansion in the urban fringe of Bahir Dar area, Ethiopia. Zeleke and Hurni (2001) also found a significant impacts of dynamic land use and land cover changes in the northwestern Ethiopian Highlands. Both studies applied remote sensing and GIS techniques to quantify land use and land cover changes. Moreover, Haregeweyn et al (2012) have tried to project urban expansion by applying a relationship between total population and urban area with time. However, none of these studies did apply any land use change model to integrate factors that influence (explain) urban expansion other than population. Thus, this study has a great contribution in applying LCM for simulating as well as projecting changes in land use and land cover in Bahir Dar area, Ethiopia as a result of driving variables. It also considered some factors that are assumed to explain changes in the growth of urban areas.
27
CHAPTER THREE
3. DATA AND METHODOLOGY
3.1. Description of the Study AreaBahir Dar is located in the north western part of Ethiopia with a total area of about 625 km2. Geographically it is located at 11⁰ 36' N and 37⁰ 23' E. It incorporates the core city of Bahir Dar with three small urban centers as (satellite towns); namely Zegie, Tis Abay and meshenti with their rural vicinities as the council of Amhara National Regional State (ANRS) has named under the revised proclamation No. 91/2003. In relative terms, Bahir Dar is found at a distance of 567 km from the capital city of Ethiopia, Addis Ababa along the road Addis Ababa - Debre Markos. It is one of the leading tourist destinations in Ethiopia, with a variety of attractions in the nearby Lake Tana and Blue Nile river (Haimanot, 2009).
28 3.1.1. Population
The first national population and housing census was conducted in 1984 and the population of Bahir Dar was 54,800. After 10 years in 1994, the second census has also been conducted and the total population was 96,140 with an increase of about 75% from 1984. In 2007, the total population has become 180,174. The value increased by about 87% of the population of 1994 according to the CSA.
Year Total Population
1984 54,800
1994 96,140
2007 180, 174
Table 3.1: Total Population of Bahir Dar 1984-2007 (Source: CSA, 2008).
3.1.2. Physiographic Nature of the Study Area
The city stretches over a predominantly flat land with hardly noticeable slope change. The elevation variation in the area ranges from 1,786 m.a.s.l near the lakeshore to 1,886 m.a.s.l at Bezawit. The general slope orientation of the town is slightly towards Abay River, which crosses the city proper from north west to south east and serves as the only out let for surface water runoff from the town. Although there is no well- defined course of surface water, the direction of drainage in dominantly towards Abay river except for some areas, which drain in to Lake Tana. Because of its extreme flatness, the town has been affected by flood problem (Haimanot, 2009).
3.1.2.1. Topography
Bahir Dar metropolitan area is mostly characterized by flat plain topographic landscape although there have been some pockets of land with hills, rugged and undulating features. The elevation of the metropolitan area fails in between the range of 1650 m.a.s.l (around Tis Abay Fall) and 2100 m.a.s.l (around Meshenti). When it is viewed specifically, the
29
average elevation of Bahir Dar is estimated in between as low as 1786 m.a.s.l (near the lake shore) and as high as 1886 m.a.s.l (near Bezawit hill).
In general, the predominance of flat landscape and plain topography in this area has a promising opportunity to undertake various urban development activities in the centers and their vicinities in particular and in the whole metropolitan area in general notwithstanding the adverse flooding and water pounding problems. On the other hand, the hilly and rugged (undulated) land features in and around these urban centers are identified as one of the major problem areas for any development activities calling for metropolitan intervention (Bahir Dar City Administration, 2013).
3.1.2.2. Geology
The rocks exposed in Bahir Dar area mainly include basaltic lava flows (lava outpourings and dames) and related spatter cones. The basaltic lava flows basically comprise periphrastic and aphanites basalts. And the overall exposed thicknesses of the flows vary from few meters to more than 100 meters at Bezawit. They seem to occur as alternate flow layers in some places and are often highly weathered and fractured particularly at depth, as bore hole log date reveals (Bahir Dar City Administration, 2013). Generally, the rocks out cropping in Bahir Dar regional administration can be categorized based on lithology variation as Aphetic Basalt, Vesicular Basalt and Scoria cereous Basalts.
3.1.2.3. Climate
Because of the complexity of climate in the region, several classification systems have been applied to the Ethiopian situation. Some of these are: Traditional, Koppen’s, Throthwaite’s, Rainfall regimes and Agro-climatic zone classification systems. Among these classification systems, the traditional system is most commonly used, based on altitude and temperature. Thus, the country is divided into five climate zones such as: Bereha (dry hot climate with < 500m altitude), kola (hot and arid type with an altitude of 500 -1500m), weina dega (dry warm climate having 1500 - 2500m altitude), dega (cold
30
with 2500 - 3500m altitude) and wurch (very cold or alpine with altitude > 3500m) (Walker et al, 2003).
The mean annual precipitation depth recorded at Bahir Dar Station in 37 years period from 1962 to 1999 is about 1437mm. There is a significant seasonal variation in the amount of rainfall. Almost 60.3% of the mean annual rainfall occurs in two raining months of July and August with maximum mean value of more than 432mm (Haimanot, 2009).
The monthly mean maximum and minimum temperature records of Bahir Dar in the year between 1961 and 2000 showed that the highest mean monthly maximum temperature occurs in April (29.7⁰c) and lowest in July and August (23.3 ⁰c). While the mean monthly minimum temperature ranges for the lowest from 7.1⁰c in January to the highest 14.2⁰c in the months of May (Haimanot, 2009).
3.1.2.4. Hydrology
In the study area there is one major international river called "Abay" which is originating
at Lake Tana in Ethiopia and crosses Sudan and Egypt. It has a total length of 1,450
kilometers of which 800 km are inside Ethiopia. The discharge data from 1960 to 2001 at Bahir Dar gauging station indicates the mean annual flow of the river Abay is about 123.07m3/s (Bahir Dar City Administration, 2013).
Lake Tana is the source of Blue Nile covering an area of more than 3000 km². Thus, Lake Tana and river Abay made Bahir Dar as one of the leading tourist destinations in Ethiopia, by having a variety of attractions (Bahir Dar City Administration, 2013).