www.atmos-meas-tech.net/5/3077/2012/ doi:10.5194/amt-5-3077-2012
© Author(s) 2012. CC Attribution 3.0 License.
Measurement
Techniques
Single Particle Soot Photometer
intercomparison at the AIDA chamber
M. Laborde1,*, M. Schnaiter2, C. Linke2, H. Saathoff2, K.-H. Naumann2, O. M¨ohler2, S. Berlenz3, U. Wagner3, J. W. Taylor4, D. Liu4, M. Flynn4, J. D. Allan4,5, H. Coe4, K. Heimerl6, F. Dahlk¨otter6, B. Weinzierl6, A. G. Wollny7,**, M. Zanatta8, J. Cozic8, P. Laj8, R. Hitzenberger9, J. P. Schwarz10, and M. Gysel1
1Laboratory of Atmospheric Chemistry, Paul Scherrer Institute, 5232 Villigen PSI, Switzerland
2Institute for Meteorology and Climate Research, Atmospheric Aerosol Research, Karlsruhe Institute of Technology, Karlsruhe, Germany
3Institut f¨ur Kolbenmaschinen, Karlsruhe Institute of Technology, Karlsruhe, Germany
4School of Earth, Atmospheric and Environmental Sciences, The University of Manchester, Manchester, UK 5National Centre for Atmospheric Science, The University of Manchester, Manchester, UK
6Deutsches Zentrum f¨ur Luft- und Raumfahrt, Institut f¨ur Physik der Atmosph¨are, Oberpfaffenhofen, Germany 7Biogeochemistry Department, Max Planck Institute for Chemistry, Mainz, Germany
8Laboratoire de Glaciologie et G´eophysique de l’Environnement, Saint-Martin d’H`eres, France 9Fakult¨at f¨ur Physik, Universit¨at Wien, Austria
10Earth System Research Laboratory, NOAA, Boulder, CO, USA *now at: AerosolConsultingML GmbH, Switzerland
**now at: Deutscher Wetterdienst, Offenbach, Germany
Correspondence to:M. Gysel ([email protected])
Received: 25 April 2012 – Published in Atmos. Meas. Tech. Discuss.: 14 May 2012
Revised: 9 November 2012 – Accepted: 15 November 2012 – Published: 20 December 2012
Abstract. Soot particles, consisting of black carbon (BC), organic carbon (OC), inorganic salts, and trace elements, are emitted into the atmosphere during incomplete combus-tion. Accurate measurements of atmospheric BC are impor-tant as BC particles cause adverse health effects and impact the climate.
Unfortunately, the accurate measurement of the properties and mass concentrations of BC particles remains difficult. The Single Particle Soot Photometer (SP2) can contribute to improving this situation by measuring the mass of refractory BC in individual particles as well as its mixing state.
Here, the results of the first detailed SP2 intercompari-son, involving 6 SP2s from 6 different research groups, are presented, including the most evolved data products that can presently be calculated from SP2 measurements.
It was shown that a detection efficiency of almost 100 % down to 1 fg BC per particle can readily be achieved, and that this limit can be pushed down to∼0.2 fg BC with optimal SP2 setup. Number and mass size distributions of BC cores
agreed within±5 % and±10 %, respectively, in between the SP2s, with larger deviations in the range below 1 fg BC.
The number size distribution of purely scattering parti-cles optically measured by the 6 SP2s also agreed within 15 %. Measurements of the thickness of non-refractory coat-ings (i.e. product fromα-pinene ozonolysis) on the BC par-ticles, relying on BC mass optical size and on an additional particle position measurement, also compared well (within ±17 %). The estimated coating thickness values were con-sistent with thermo-optical analysis of OC and elemental car-bon (EC) content, though absolutely accurate values cannot be expected given all the assumptions that have to be made regarding refractive index, particle morphology, etc.
This study showed that the SP2 provides accurate and reproducible data, but also that high data quality is only achieved if the SP2 is carefully tuned and calibrated. It has to be noted that the agreement observed here does not ac-count for additional variability in output data that could result from the differences in the potentially subjective assumptions made by different SP2 users in the data processing.
1 Motivation
Soot particles are emitted into the atmosphere during incom-plete combustion. They contain, depending on the source, variable amounts of black carbon (BC; sometimes also re-ferred to as EC (elemental carbon) when measured with ther-mal methods), organic carbon (OC), inorganic salts, and trace elements. BC is of particular interest as it is the most signif-icant aerosol that directly affects the climate by strongly ab-sorbing solar and infra-red radiation in the atmosphere (Bond et al., 2007; Shindell et al., 2012). With time, BC can gain additional coatings through the condensation of low volatile compounds, through coagulation processes, or through cloud processing. This ageing affects the optical, cloud condensa-tion nuclei, and ice nuclei properties of BC containing parti-cles, as well as their lifetime (Schnaiter et al., 2005; McFig-gans et al., 2006; Koch et al., 2011; Crawford et al., 2011). It is therefore important to accurately measure BC mass con-centration and mixing state to understand and model its cli-mate impact.
Unfortunately, exact measurement of BC remains diffi-cult, although consistent results can be achieved with differ-ent methods (Slowik et al., 2007; Kondo et al., 2011). The Single Particle Soot Photometer (SP2; Stephens et al., 2003) can contribute to addressing the need for BC characterisa-tion by directly measuring the mass of refractory black car-bon (rBC; hereafter referred to as BC) in individual parti-cles. This observation can provide the mass and number size distributions of BC cores in the SP2’s size range. Addition-ally, the SP2 provides optical sizing of particles. A secondary data product of the SP2 is a semi-quantitative measure of the coating thickness of non-refractory material on individual BC cores.
Several studies have previously characterized the detec-tion efficiency of the SP2 (Schwarz et al., 2010), the coat-ing effect on the mass measurement (Moteki and Kondo, 2007; Slowik et al., 2007; Cross et al., 2011), the consis-tency of the mass measurement compared to other methods to measure BC (Slowik et al., 2007; Kondo et al., 2011; Cross et al., 2011), and the influence of calibration materials on the mass measurement (Moteki and Kondo, 2010; Laborde et al., 2012). In addition, several methods have been used to treat the scattering signal in order to calculate the coating thick-ness of the particles (Gao et al., 2007; Moteki and Kondo, 2008; Schwarz et al., 2008). However, the reproducibility and the accuracy of these data products delivered by the SP2 have only been partly characterised.
We present here results from the SOOT11 campaign (per-formed at the AIDA chamber, Karlsruhe) that aimed at com-paring 6 SP2s from 6 different institutes in order to compre-hensively assess the reproducibility and the accuracy of most of the data products that can presently be calculated from SP2 measurements.
2 Experimental methods
2.1 Single Particle Soot Photometer (SP2)
2.1.1 Description
used in this study to compare the performance of different SP2 instruments.
The SP2 detects the light elastically scattered by the par-ticles using an avalanche photo diode (APD) in order to de-termine the optical size of the particles. Additionally, a two-element APD (TEAPD; Gao et al., 2007) is used to deter-mine the particle’s position in the laser beam. This is required for reliable optical sizing of BC-containing particles, which evaporate as they cross the laser beam. Comparing the opti-cal size with BC mass provides information on the mixing state of BC. A detailed description of the data analysis as-sumptions and methodology can be found in Sect. 3.
2.1.2 SP2 version of involved institutes
Six SP2s from six different research groups took part in the intercomparison. The following acronyms will be used to designate the respective SP2s:
– DLR: Deutsches Zentrum f¨ur Luft- und Raumfahrt
– KIT: Karlsruhe Institute of Technology
– LGGE: Laboratoire de Glaciologie et G´eophysique de l’Environnement
– MPI: Max Planck Institute for Chemistry
– PSI: Paul Scherrer Institute
– UMN: The University of Manchester.
This study covers a range of different SP2 revisions. The most relevant specifications of all the compared SP2s are pro-vided in Table 1. In all SP2s, the detector signals are ampli-fied with two gains, hereafter referred as high- and low-gain. Both amplification gains can be varied while the high-to-low ratio remains constant. Adjusting the amplification gain in-fluences the detection range of the SP2 in terms of BC mass per particle.
In the earlier versions of the SP2 (A–C), only the high-gain signals are acquired, while in the newer version C∗,
both low-gain and high-gain channels are acquired. Within the SP2 community, all the instruments use the same com-bination of optical filters and PMT for the broadband chan-nel, while different approaches are used for the narrowband channel (see Sect. 2.1.1). The broadband channel is therefore used here for the comparison of the BC measurements by all SP2s. The high-gain output is used for the comparison of all the SP2s apart from LGGE’s SP2, which is the only version C∗instrument used here. The low-gain output was used for
the latter SP2 due to its better overlap in detection range with the other SP2s.
2.1.3 Recommended SP2 adjustments
The following list contains the main adjustments and calibra-tion steps that are required, in our opinion, to achieve opti-mum performance of an SP2:
– Laser alignment: the laser’s output coupler position should be checked, following the manufacturer’s in-structions (SP2 operator manual, Droplet Measurement Technologies, 2012), and aligned to achieve a laser beam in TEM00 mode, which implies a Gaussian radial intensity distribution.
– Mode aperture alignment: the mode aperture (used to constrain the spatial mode of the laser) should be aligned (SP2 operator manual, 2012) such that a TEM00 mode is obtained without attenuating the laser beam.
– Detector block horizontal alignment: the detector block, also holding the nozzle creating the particle beam, should be aligned horizontally, following the manufac-turer’s instructions (SP2 operator manual, 2012), such that the particle beam crosses the centre of the laser beam. This adjustment should be performed using non-absorbing spherical particles such as polystyrene latex spheres (PSL).
– Scattering detector alignment: the position of the APD should be adjusted (by moving the detector board in and out) to a position near to the focal plane of the optical lens in order to almost maximize the scattering signal amplitude. Note that the maximum should not, however, be reached in order to avoid local saturation of the APD for larger particles.
– Two-element APD detector alignment: the vertical posi-tion of the TEAPD should be adjusted such that the split point (the point where the signal crosses the baseline) is detectable for pure BC particles with a mass of∼6.7 fg. In addition, the TEAPD should be adjusted (as for the scattering detector) such that the signal amplitude is al-most maximized.
– Laser power adjustment: the intracavity laser power should be adjusted (by varying the power of the pump laser) until the color ratio (defined as the ratio between broadband and narrowband incandescence peak height) becomes independent of laser power. The procedure de-scribed in Schwarz et al. (2010) with a polydisperse pure BC sample such as fullerene soot should be used. This procedure guarantees that the calibration of the in-candescence detector is independent of laser power. It is also necessary for maximal detection efficiency of the small BC particles as they might not reach their boil-ing point otherwise. However, this condition is not suf-ficient for unit detection efficiency of small BC parti-cles, as they can remain undetected for other reasons (see Sect. 4.1.3).
Table 1.SP2 specifications.
Institute Revision Acquisition card type
Deutsches Zentrum f¨ur Luft- und Raumfahrt (DLR) B 12 bits – 5 MHz – 4 channels Karlsruhe Institute of Technology (KIT) C 12 bits – 5 MHz – 4 channels Laboratoire de Glaciologie (LGGE) C∗ 14 bitsa– 2.5 MHz – 8 channels et G´eophysique de l’Environnement
Max Planck Institute for Chemistry (MPI) C 12 bits – 5 MHz – 4 channels
Paul Scherrer Institute (PSI) B 12 bits – 5 MHz – 4 channels
The University of Manchester (UMN) A 12 bits – 5 MHz – 4 channels
aLabelled as 16 bits but 14 bits resolution in reality.
– Calibration: the incandescence detectors should be cali-brated using fullerene soot and/or Aquadag (Baumgard-ner et al., 2012). The scattering detector should be cali-brated using non-refractory spherical particles of a cer-tified size such as PSL size standards. More details on the calibration materials and procedures can be found in Sect. 2.2.
Most of the above adjustment and calibration steps were ap-plied to all the SP2s in this study. It has to be noted that the KIT’s SP2 mode aperture was misaligned during part of the campaign (before 29 November 2010), resulting in a laser power lower than required for stable incandescence calibra-tion and optimal counting efficiency at the lower deteccalibra-tion limit.
The sample flow rates were measured using a bubble flow meter and were 0.12 L min−1for all SP2s, except for the MPI instrument with 0.08 L min−1. The sheath air flow rate was set to 1 L min−1for all SP2s.
2.2 The SOOT11 campaign
The SP2’s response to different types of aerosol was tested during the SOOT11 campaign, lasting for 3 weeks, at the AIDA facility using the following experimental setup and aerosol samples.
2.2.1 AIDA chamber and sampling manifold
The large aerosol and cloud simulation facility AIDA (Aerosols Interaction and Dynamics in the Atmosphere) in Karlsruhe, described in more details elsewhere (Wagner et al., 2009), is a tool for investigating physical and chemi-cal aerosol processes. The AIDA facility comprises a 84.5 m3 aluminium chamber that can be operated at variable pressure, temperature, and humidity conditions.
The AIDA facility is equipped with an extensive suite of state of the art instruments. During the SOOT11 campaign, the AIDA chamber was used as a reservoir into which parti-cles were introduced and from where samples were taken. Additionally, the AIDA was used to simulate ageing pro-cesses such as coagulation and condensation of secondary organic aerosol (SOA).
Filter samples were taken in order to determine the parti-cle’s total carbon (TC), elemental carbon (EC) and organic carbon (OC) content, offline, using a Sunset analyzer (Birch and Cary, 1996). The NIOSH 5040 protocol, defining the sample preparation protocol, the temperature set points, the residence times at each temperature step, and the gas to be used, was applied. The transmitted laser light was used for the charring correction. Particle number size distribu-tions were measured using a scanning mobility particle sizer (SMPS). Light absorption by the particles was measured us-ing photoacoustic spectrometry (PAS). The PAS instrument used in this study is described in detail elsewhere (Schmid et al., 2006). Briefly, it uses a power-modulated, frequency-doubled Nd:YAG laser (λ= 532 nm), in an optical resonator equipped with a microphone, for a direct airborne measure-ment of the aerosol absorption coefficient. This method is unaffected by light scattering from the filter matrix and the collected aerosol as would occur with a filter-based measure-ment.
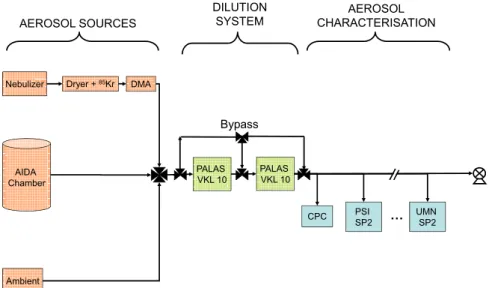
The experimental setup of this study is shown in Fig. 1. A common 6 mm stainless steel sampling line was connected to the AIDA chamber through which six SP2s and a condensa-tion particle counter (CPC) sampled. The sample concentra-tion was adjusted using one or two diluconcentra-tion stages (PALAS VKL-10; 1:10 dilution each), when necessary, to avoid coin-cident particles in the SP2’s laser beam.
The common SP2/CPC sampling line was sometimes dis-connected from the AIDA chamber and dis-connected to the cali-bration system (details in Sect. 2.2.2) and ambient air (details in Sect. 2.2.6).
2.2.2 Calibration aerosols
PSI SP2 CPC DMA
AIDA Chamber
Nebulizer Dryer + 85Kr
Ambient
PALAS VKL 10
AEROSOL SOURCES
UMN SP2
…
DILUTION SYSTEM
PALAS VKL 10
AEROSOL CHARACTERISATION
Bypass
Fig. 1.Experimental setup used during the SOOT11 campaign.
was previously characterized by Gysel et al. (2011), allow-ing for the particle mass to be calculated from the mobility diameter. The CPC measured in parallel in order to deter-mine the mass-resolved counting efficiency of the SP2 (see Sect. 4.1.3).
The same setup was also used to calibrate the scattering detector with 150, 220, 269, 350 and 600 nm diameter PSL size standard particles (Thermo Scientific, formerly Duke Scientific). Only the results using the 269 nm PSL particles (220 nm for the LGGE’s SP2) will be presented here as the calibrations using the other sizes are similar.
2.2.3 Secondary organic aerosol production
Secondary organic aerosol (SOA) was produced by ozonol-ysis ofα-pinene.α-pinene and ozone were sometimes intro-duced into the empty AIDA chamber, resulting in the for-mation of a polydisperse SOA aerosol consisting of spheri-cal purely scattering particles. At other timesα-pinene and ozone were introduced into the chamber previously filled with soot particles resulting in condensation of the SOA onto the BC particles, thereby increasing the coating thickness. Typicalα-pinene and ozone concentrations ranged between 8–98 ppb and 230–340 ppb, respectively. Details about the generation of SOA and the coating of soot in the AIDA cham-ber can be found elsewhere (Saathoff et al., 2003, 2009).
2.2.4 CAST soot
Combustion aerosol standard (CAST soot) was produced using a mini-CAST propane burner (Jing-CAST Technolo-gies). Particles with various OC/EC ratios were investigated by varying the burning conditions (C/O ratio). We will, how-ever, only report here the results of the experiment using
CAST soot with an C/O setting of 0.29 corresponding to a measured OC to TC ratio of∼60 % (Sect. 4.5).
2.2.5 Diesel car exhaust
A diesel engine test bench, holding a EURO-5 with a 2.0 L series Volkswagen diesel engine (http://www.motor-talk.de/ forum/aktion/Attachment.html?attachmentId=714834) with bypassed diesel particle filter, was used to produce diesel ex-haust particles. The engine was operated with standard diesel fuel at 2000 revolutions/min and a torque of 81 and 195 Nm. Water vapour, volatile hydrocarbons, and NOxwere removed from the diesel exhaust by a series of denuders (Saathoff et al., 2003) before injecting it into the AIDA chamber.
2.2.6 Ambient sample
The SP2 is typically used to measure outdoor aerosol. It is therefore important to compare the SP2’s response and agree-ment using outdoor samples. An extension to the sampling line was setup in order to sample outdoor air from the top of the roof.
3 Data analysis procedures
3.1 Data analysis software
calibration curves as well as BC mass and number size dis-tributions from the same set of raw data (see Supplement, Fig. S1). PSI’s toolkit was used to analyse all data from the intercomparison as the lead author is familiar with this one and as it also provides more advanced data products. The sta-tistical parameters obtained in this study (Table 2) therefore reflect only the difference between instruments, and it has to be noted that additional variability in output data from other studies could result from the differences in the potentially subjective assumptions made by different SP2 users in the data processing.
3.2 BC mass determination
The BC mass in single particles is indirectly determined by measuring the intensity (peak height) of the light emitted at the incandescence of BC particles, as previously men-tioned. However, an empirical calibration is needed to link the measured incandescence signal to the BC mass. Aquadag and fullerene soot are two common calibration materials that have good stability and cover particle mass ranges appropri-ate for the SP2. The SP2’s sensitivity to fullerene soot has been found to be the closest to that of ambient and diesel BC (Moteki and Kondo, 2010; Laborde et al., 2012). The fullerene soot calibration was therefore applied to determine BC mass for all data presented in this study, unless stated otherwise. The mass of the fullerene soot and Aquadag cali-bration particles was inferred from the selected mobility di-ameter using the effective density values provided in Gysel et al. (2011). The data from the CAST soot experiment was also treated using the fullerene soot calibration, due to lack of better knowledge on the SP2’s sensitivity to BC from the CAST burner. The Aquadag calibration curves will be used in Sect. 5 to discuss the influence of calibration curve choice on the measured BC mass.
Number and mass size distributions of BC cores are com-monly shown as a function of BC core mass equivalent di-ameter,DMEV, which is calculated from the particle mass assuming a void-free BC material density of 1800 kg m−3 (Moteki and Kondo, 2010).
3.3 Optical diameter and coating thickness determination
The differential scattering cross section and optical diameter of single particles is determined by measuring the intensity of the laser light elastically scattered by the particles into the solid angle covered by the detector (cone with a full opening angle of 60◦ collecting light between 15◦–75◦ and 105◦–
165◦; Gao et al., 2007). Absolute calibration of the
scatter-ing measurement, i.e. the factor between the calculated dif-ferential scattering cross section of a particle and the cor-responding measured scattering signal amplitude, was done using PSL sphere size standards with a diameter of 269 nm (220 nm for the LGGE’s instrument). The term differential
denotes the fact that the scattering detector measures the scat-tered light only in a certain solid angle, corresponding to a portion of the total scattered light. For conciseness, we will hereafter refer to the differential scattering cross section sim-ply as the scattering cross section.
The scattering cross section of the PSL sphere was calcu-lated using Mie theory for spherical particles (Bohren and Huffman, 1983) with a refractive index (RI) ofn= 1.59 + 0i, and using the known SP2 solid angle. A single size calibra-tion of the scattering detector is sufficient as the ratio be-tween scattering cross section and scattering signal ampli-tude is independent of particle size. The validity of this as-sumption was confirmed for all SP2s by measuring several PSL sizes.
Non-absorbing, purely scattering particles will cross the laser beam unaltered, and thus the scattering cross section corresponding to the maximum scattering peak height ob-served at the centre of the laser beam represents the whole particle. The optical diameter of the particle is then obtained by comparing the calibrated scattering cross section mea-surement with the calculated size dependence of the scat-tering cross section of spherical particles with a certain re-fractive index. The choice made for the rere-fractive index in the case of non-absorbing SOA particles will be discussed in Sect. 4.4. The measured scattering amplitude is propor-tional to the intensity of the laser beam, which is assumed to be constant between scattering detector calibrations (four in total) for the analysis in this paper. Shortcomings of this assumption will be discussed in Sect. 4.1.2.
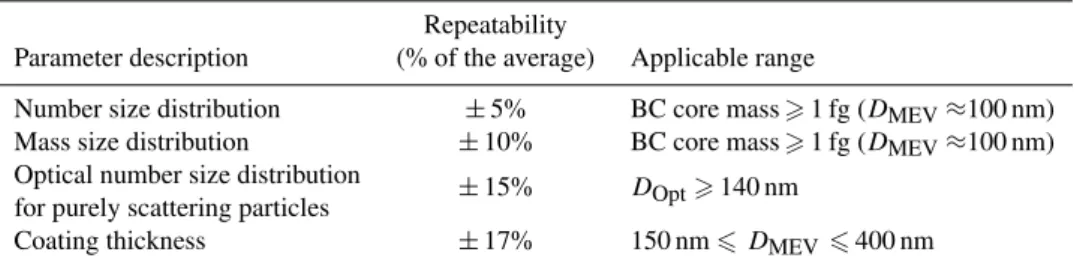
Table 2.Summary of the SP2 repeatability obtained during this study, for different parameters. “Repeatability” refers to the range between minimum and maximum values observed by 6 SP2 instruments for a certain quantity.
Repeatability
Parameter description (% of the average) Applicable range
Number size distribution ±5% BC core mass>1 fg (DMEV≈100 nm) Mass size distribution ±10% BC core mass>1 fg (DMEV≈100 nm) Optical number size distribution ±15% D
Opt>140 nm for purely scattering particles
Coating thickness ±17% 150 nm6DMEV 6400 nm
mass equivalent diameter of the BC core, corresponding to the BC mass determined by the incandescence measurement, while the overall particle diameter is varied until the calcu-lated scattering cross section matches the measurement. The coating thickness is then calculated as the difference between the radii of the total particle and the BC core.
However, the LEO-fit method only provides accurate re-sults if it is performed before the coating starts evaporating. To ensure this is the case, the LEO-fit was performed up to 2 µs before the earliest incandescence observed for the entire sample (equivalent to a scattering signal amplitude ranging from 2 to 8 % of the maximum amplitude, for the different SP2s). Careful tests with more restrictive LEO-fit limits have been done to ensure that the above choice of LEO-fit limits is appropriate for all SP2s.
The coating thickness provided by the core–shell Mie model is only accurate if the RIs assumed for the BC core and the non-refractory matter are, and to the extent that Mie theory is able to replicate the scattering behaviour for the complex particle morphology, under study. For this study, the RI of the BC core was chosen such that the optical diameter of the bare BC core (just determined before incandescence) agreed with the BC core mass equivalent diameter as cal-culated from the incandescence signal. Consistency between BC mass measurement and optical sizing of the BC core was achieved for the CAST soot by using an RI ofn= 1.9 + 0.8i. This value is within the likely RI range of light absorbing carbon reported by Bond and Bergstrom (2006). Using an RI of n= 2.26 + 1.26i resulted in consistent results for the ambient BC particles, which is in agreement with literature for ambient BC (Moteki et al., 2010). In both cases, an RI of n= 1.5 was used for the coating matter. This RI (at the SP2’s wavelength) has previously been used for similar coat-ing thickness analyses of ambient particles (Schwarz et al., 2008), and it is also representative of aliphatic hydrocar-bons and polycyclic aromatic hydrocarhydrocar-bons (PAHs; Suther-land et al., 1994), which are major components of the OC in fresh CAST soot (Slowik et al., 2007). The composition of the organic coatings of CAST soot changes during the addition of SOA coatings. The quantitative comparison be-tween the coating thickness measurement and the indepen-dent OC volume fraction measurement by the Sunset
in-strument (Sect. 4.5 and Table 5) is done for fresh CAST soot. Therefore, we use the RI representing the OC coat-ing of fresh CAST soot for the coatcoat-ing thickness analysis of this experiment.
4 Results
4.1 Calibration: stability and detection limit
4.1.1 BC mass calibration
Accurate BC mass concentration measurements are only pos-sible if calibrations of the incandescence detector are repro-ducible. For this reason we compare in Fig. 2 the results from two fullerene soot calibrations performed on 16 Novem-ber 2010 and 1 DecemNovem-ber 2010. Size-selected fullerene soot particles with mass between 0.2 fg (DMEV= 60 nm) and 60 fg (DMEV= 352 nm) were fed into the common sampling man-ifold for this purpose (Sect. 2.2). The comparison of the calibration curves highlights the wide range of sensitivities within the available SP2s, resulting from different signal am-plification gains. The sensitivity to an 8.9 fg fullerene soot particle indeed varies by a factor of ∼3.5 (from 2.6 V to 9.3 V; Table 3), excluding LGGE’s SP2. This difference in gain causes the A/D converter to saturate at different BC masses ranging from 18 fg to 74 fg BC. This result is con-sistent with a previous study where differences were found in the calibration slope (Cross et al., 2011). Particles with BC mass above saturation are still detected, but their BC mass cannot be quantified. Note that the LGGE SP2 has a higher A/D converter resolution. It can therefore be operated at a lower gain, resulting in a higher upper detection limit while retaining the lower detection limit. The differences in gain can potentially influence the lower detection limit for BC mass too and will be discussed in Sect. 4.1.3.
80
60
40
20
0
Particle mass [fg]
(high gain calibration curves)
20 18 16 14 12 10 8 6 4 2 0
Signal amplitude of broadband incandescence detector [V]
140
120
100
80
60
40
20
0
Particle mass [fg]
(low gain calibration curves)
Fullerene soot calibrations:
16.11.2010 01.12.2010
LGGE (low gain) LGGE (low gain) LGGE (high gain)
DLR DLR
PSI PSI
KIT KIT
UMN UMN
MPI MPI
-9%
-7%
+9%
-4%
-7%
-20%
Fig. 2.Comparison of the fullerene soot calibrations of the broadband incandescence detector performed for all the SP2s on 16 Novem-ber 2010 (dashed lines) and 1 DecemNovem-ber 2010 (solid lines). The shadings indicate the drift between these two calibrations, while the numNovem-bers in the boxes indicate the maximal difference in the 0.2–60 fg BC range. This reflects the drift of the entire setup, including the variability of calibration material, DMA and SP2s. Calibration curves are shown for the high-gain output of the broadband incandescence channel of all SP2s and additionally for the low-gain output of LGGE’s SP2.
Table 3.Aquadag (AQ) and fullerene soot (FS) calibration results for all SP2s (see also Fig. 2) for the broadband incandescence (BB) channel. The fullerene soot calibration reported was performed on 16 November 2010 (dashed lines in Fig. 2). The calibration drift represents the biggest ratio between this calibration and that performed on 24 November 2010. The Aquadag calibration reported here was performed on 24 November 2010. The Aquadag to fullerene soot ratio was calculated using the calibrations both performed on 24 November 2010.
SP2 Mass at saturation BB cal. drifta BB volt. [V], BB volt. [V], AQ to FS signal (FS cal.) [fg] (FS cal.) [%] FS, 8.9 fg AQ, 8.9 fg ratio at 8.9 fg
DLR 74 +9 2.9 3.9 1.37
MPI 18 +4 9.8 12.4 1.26
PSI 47 +7 3.7 4.8 1.28
KIT 33 +20b 5.2 7 1.35
UMN 23 −9 6.8 9.6 1.42
LGGE 205 −7 0.9 1.2 1.32
aMaximal difference in the mass range 0.2–60 fg BC. This drift includes potential drifts of the SP2 and the DMA, as well as small variability of the fullerene soot’s effective density.bThis larger drift is due a strong increase of laser power between the two calibrations from an insufficient level to a sufficient level.
The BC calibration is independent of the laser power only if the laser power is sufficiently high. The KIT SP2’s laser power increased from an insufficient level to a sufficiently high level in between the two calibrations, as a result of the mode aperture alignment. This caused a higher calibration drift of 20 %, which is not representative of typical SP2 cali-bration stability.
4.1.2 Scattering detector calibration
The scattering measurement of the SP2 can be used to infer the absolute intracavity laser intensity (Schwarz et al., 2010), but its main purpose is to determine the optical size of the
scattering signal is also proportional to the laser intensity. Changes of the relevant laser intensity, i.e. the peak intensity seen by the particles crossing the laser beam, are thus a ma-jor reason for drifts of the scattering calibration factor. This is in contrast to the incandescence detector calibration, which is independent of laser power. The most common causes for drifts of the relevant laser intensity are degrading integrated intensity of the laser beam due to a contamination of the laser optics, changing laser beam shape due to shifting of laser op-tic alignment, or changes of the position where the parop-ticles cross the laser beam, exposing the particles to a less intense part of the laser beam.
An independent measure of the intracavity laser power is required in order to determine how much the drift of the inte-grated laser power can account for the scattering calibration drift. The SP2’s YAG power monitor reading provides a mea-sure of the intracavity laser power by monitoring the light leakage through the high reflectivity output coupler mirror of the laser cavity. However, the ratio between intracavity laser power and YAG power monitor reading is temperature de-pendent (Schwarz et al., 2010) and the laser power can only be reliably estimated from this measurement by following the temporal evolution of the YAG power monitor at a fixed temperature (see Supplement, Fig. S2). The temperature cor-rected YAG power monitor readings, obtained by interpo-lating readings taken at a fixed temperature, are shown in Fig. 3b for all scattering detector calibrations. The integrated laser power was almost stable for the SP2s from MPI, UMN, LGGE and PSI, with drifts of 6.3 %, 0.8 %, 1.6 % and 4.3 %, respectively. KIT’s SP2 laser power increased dramatically after the mode aperture realignment (done on 29 Novem-ber 2010). DLR’s SP2 laser power gradually dropped (with a drift of 27 %) between 17 and 24 November, probably due to abnormally shifting laser optics, causing a partial attenua-tion of the laser by the mode aperture (see also Supplement, Fig. S2). DLR’s SP2 laser power recovered and became sta-ble (no drift observed) after the realignment of the output coupler on 26 November.
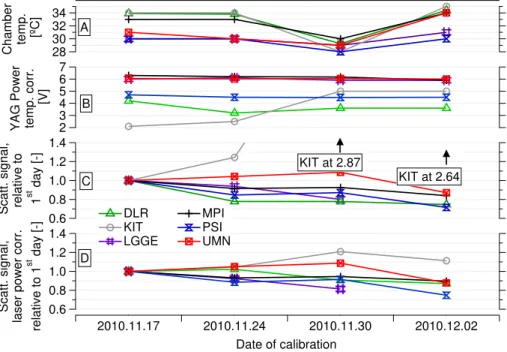
During this study, scattering calibrations were performed 4 times. The sensitivity of the scattering measurement differed by a factor of ∼3 between the SP2s (Table 4). Figure 3c shows the measured scattering signal amplitudes for 269 nm PSL particles (220 nm for LGGE’s SP2) of all calibrations normalized by that of the first calibration. This normalisa-tion was done in order to identify calibranormalisa-tion drifts. Figure 3d shows the ratio of the measured scattering signal amplitude to the temperature corrected YAG power monitor reading for all calibrations, again relative to that of the first day. The di-vision by laser power was done to determine the contribution of changing integrated laser power to the observed calibra-tion drifts.
It can be seen that the KIT SP2 shows a major scattering signal increase between the second and the third calibrations (Fig. 3c), for the most part caused by the increase of inte-grated laser power (Fig. 3b). This is confirmed by the fact
Table 4. High-gain scattering channel calibration results for all SP2s (see also Fig. 3) using 269 nm (220 nm for LGGE) PSL par-ticles. The calibration performed on 17 November 2010 for most of the instruments and in addition that performed on 30 Novem-ber 2010 are reported for those instruments that experienced a laser power drift.
SP2 Scattering signal [V]a
calibration date for PSL spheres
KIT 17 November 2010 3.5b
KIT 30 November 2010 10.1b
MPI 17 November 2010 3.8
UMN 17 November 2010 4
PSI 17 November 2010 5.8
PSI 30 November 2010 5.1
DLR 17 November 2010 7.8
DLR 30 November 2010 6
LGGE 30 November 2010 11.8
aFor a PSL of a diameter of 269 nm or 220 nm for LGGE.bThis larger difference is due a strong increase of laser power between the two calibrations from an insufficient level to a sufficient level.
that the laser power corrected calibrations after the power in-crease differ by less than 20 % from those before (Fig. 3d).
For the UMN SP2, the difference between the highest scat-tering signal and the lowest is around 20 % both with and without dividing by laser power (Fig. 3c and d). This indi-cates that the integrated laser power is not responsible for this drift and that a 20 % calibration drift in 3 weeks is there-fore possible even at stable integrated laser power.
In a similar way, the MPI SP2 shows only a very small in-tegrated laser power drift. Its scattering signal shows a 20 % drift without laser power correction (Fig. 3c), reducing to 10 % after dividing by the laser power (Fig. 3d).
The PSI’s SP2 shows a scattering signal drift of 30 % that is hardly reduced by dividing by the laser power. This larger drift compared to other instruments can likely be explained by a movement of the laser position. The SP2’s optics were cleaned shortly before the campaign and the YAG crystal was likely not totally settled. The position of the laser beam maximum shifts when the YAG crystal or the output coupler moves a little. The laser power can remain stable as long as the mode aperture does not attenuate it. However, the par-ticles will not hit the centre of the laser beam anymore, re-sulting in a lower scattering signal (Fig. 3c–d) despite almost stable integrated laser power (Fig. 3b). This interpretation is consistent with a degrading detection efficiency for small BC cores, as discussed in Sect. 4.1.3.
1.4 1.2 1.0 0.8 0.6
Scatt. signal, relative to 1 st day [-]
2010.11.17 2010.11.24 2010.11.30 2010.12.02
Date of calibration 1.4
1.2 1.0 0.8 0.6
Scatt. signal,
laser power corr.
relative to 1
st day [-]
7 6 5 4 3 2
YAG Power temp. corr.
[V]
34 32 30 28
Chamber temp.
[ºC] A
B
C
DLR MPI
KIT PSI
LGGE UMN
D
KIT at 2.87
KIT at 2.64
Fig. 3.Scattering detector calibration results, using PSL particles with a diameter of 269 nm (220 nm for LGGE).(A)Chamber temperature during calibration.(B)YAG power (laser power monitor) corrected for temperature variations (Sect. 4.1.2).(C)Relative drift of the scattering detector signal to the first calibration day (not accounting for laser power change).(D)Relative drift of the scattering detector signal to the first calibration day, divided by laser power, hence accounting for laser power change.
causing a decrease of the laser power to which the particles are exposed.
The LGGE SP2 also experienced a calibration drift of ∼20 % during the first three calibrations (fourth calibration is missing) without a parallel integrated laser power drift. Part of this rather fast drift can possibly be caused by a laser position shift.
In summary, it can be said that drifts of the scattering cal-ibration of up to∼20 % within 16 days must be expected also for “stable” SP2s, while even larger drifts can occur for various reasons. This highlights the importance of a frequent scattering detector calibration in order to ensure data quality and to identify alignment problems. It has to be added that light scattering is strongly diameter dependent, such that an uncertainty of 20 % in scattering amplitude still provides de-cently accurate optical sizing.
4.1.3 Counting efficiency
BC mass concentration measurements using the SP2 rely on quantitative measurement of BC mass in single particles and 100 % detection efficiency of sampled particles within the practical size range of the instrument. The former condition is assured by calibrating the incandescence signal amplitude with “BC mass standards” (Sects. 3.2 and 4.1.1); the latter can be verified by comparing the particle number concentra-tion measured by the SP2 against a CPC.
Various phenomena can lower the counting efficiency and have been studied in Schwarz et al. (2010). Briefly, the first
limitation to the SP2 detection of BC number and/or mass arises from the physical process inherent in the SP2 detec-tion technique – namely at small BC mass or low laser in-tensities, particles fail to heat to vaporization, a requirement for proper detection. Once the particle has reached incandes-cence, the incandescence peak height still has to be resolved in order for the particle to be counted. The detection of the peak height depends on the baseline noise, the electronic sig-nal amplification and the A/D converter’s resolution. In ad-dition, the SP2 data acquisition software can discard small BC mass particles if the user-defined signal threshold, above which the SP2 triggers the signal of a particle, is set to a value much higher than the baseline noise.
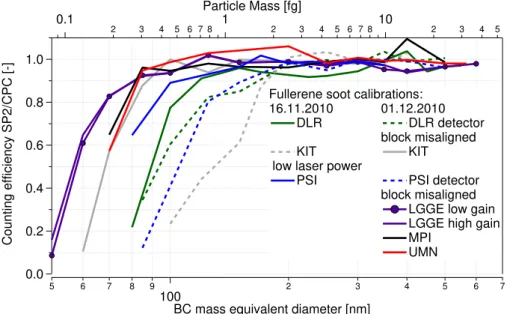
Figure 4 presents the counting efficiency of the SP2s for the fullerene soot calibration aerosol, calculated relative to the number concentration measured by the CPC. The influ-ence of multiply charged particles, which can easily be dis-tinguished from singly charged particles by the SP2, is cor-rected by subtracting the number concentration of multiply charged particles from both the SP2 and CPC measurement (i.e. assuming unit counting efficiency for multiply charged particles as they are bigger).
1.0
0.8
0.6
0.4
0.2
0.0
Counting efficiency SP2/CPC [-]
5 6 7 8 9
100 2 3 4 5 6 7
BC mass equivalent diameter [nm] 0.1
2 3 4 5 6 7 8 1 2 3 4 5 6 7 8 10 2 3 4 5
Particle Mass [fg]
Fullerene soot calibrations:
16.11.2010 01.12.2010
DLR DLR detector
block misaligned
KIT KIT
low laser power
PSI PSI detector
block misaligned LGGE low gain LGGE high gain MPI
UMN
Fig. 4.Counting efficiency of the SP2s for fullerene soot measured on 16 November 2010 and 1 December 2010. The counting efficiency is here defined as the number of singly charged particles measured by the SP2 over that measured by the CPC as a function of the particle mass equivalent diameter (Sect. 4.1.3). The dashed-line style indicates that the counting efficiency is affected by a misalignment.
(D50) at which the detection efficiency is 50 % was deter-mined for all SP2s by fitting a sigmoid curve to the data points (note: these diameter values represent mass equivalent diameters which are calculated from the BC mass, assum-ing a bulk material density of 1800 kg m−3). LGGE’s SP2 gets the lowest lower detection limit (LDL) with aD50of∼ 57 nm (0.2 fg). This can be considered as an upper limit of the physical incandescence threshold mentioned above (at this laser power). Schwarz et al. (2010) reported a higher LDL of 0.7 fg. This discrepancy may be the result of the superior laser power of the LGGE SP2 to that achieved by Schwarz et al. (2010). The similitude between low- (Fig. 4; purple line and markers) and high-gain (Fig. 4; purple line, no markers) counting efficiencies can be either the result of the physical incandescence threshold or a too high baseline noise limiting the detection of smaller BC particles. However, we cannot exclude that the nebulizer also produces a small fraction of purely scattering particles of this size which would not be de-tected by the SP2, but would contribute to the total number concentration detected by the CPC.
Considering only the well aligned instruments (Fig. 4; solid lines), MPI, UMN and KIT SP2s have similar counting efficiency (D50∼67 nm), while PSI’s SP2 is a little less efficient (D50∼80 nm) followed by DLR’s instrument (D50∼90 nm). PSI and DLR’s SP2s might be on the low side as they have the most unfortunate ratio between gain and A/D converter resolution (in favour of a higher upper detection limit). The dashed lines in Fig. 4 are affected by misalignment between laser beam and particle beam or insufficient laser power. The counting efficiencies in these cases drop down significantly for small BC cores.
This result highlights the importance of having a careful instrument tuning and of sufficient laser power when it comes to detection of small BC cores. In general, the counting ef-ficiency check is important to identify the LDL and poten-tial alignment issues, as well as to optimize the amplification gain for the intended measurement use. However, such count-ing efficiency curves should not be used to correct measure-ments in the cut off range (other than for sensitivity analy-ses), as the exact shape may, for example, depend on particle morphology, mixing state, or ambient pressure (i.e. during aircraft measurements).
4.2 BC core number concentration determination
One of the advantages of the SP2 is its capability to quantify the BC mass content of each single particle sampled, thereby obtaining the number and mass size distributions of the BC cores independently of their mixing state.
240
220
200
180
160
140
120
100
80
60
40
20
0
Number size distribution of BC cores
dN/dlogD
MEV
[1/cm³]
5 6 7 8 9
100 2 3 4
BC core mass equivalent diameter DMEV [nm] Ambient BC number size distribution (02.12.2010):
DLR KIT MPI PSI UMN LGGE Average +/- 5%
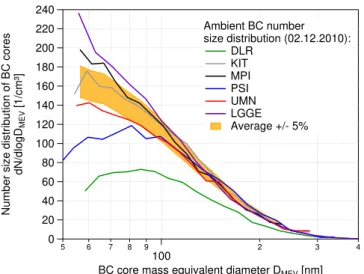
Fig. 5.Comparison of BC core number size distributions of an am-bient air sample as measured by the SP2s. The reasons for the sys-tematic undercounting of DLR’s SP2 during this experiment could not be definitely identified. However, DLR’s SP2 was measuring correctly during most other experiments.
be definitely identified. However, DLR’s SP2 was measuring correctly during most other experiments, as shown later.
The accuracy of the BC core number concentration deter-mination was also investigated using CAST soot (Fig. 6). The CAST soot experiment ran from 23 November until 24 November. The soot particles were introduced into the empty AIDA chamber and let coagulate overnight. The co-agulation led to a decrease in particle number concentration and an increase of the particle diameters (the modal mobility diameter shifted from 70 to 250 nm, according to the SMPS). Part of the decrease in number concentration is due to wall losses and the constant dilution of the AIDA chamber air in order to keep a constant pressure. The large and sudden de-crease in number concentration observed in the early morn-ing of the 24th was due to a failure of the dilution stages in the sampling line.α-pinene and ozone were introduced on 24 November at 01:34 p.m. and at 03:05 p.m. to form SOA which condensed on the particles. The SP2 number con-centration was tested against the CPC’s number concentra-tion (Fig. 6). Initially, all the SP2s measured lower than the CPC because a substantial fraction of the CAST soot par-ticles (still uncoated) was smaller than the SP2’s lower de-tection limit. The discrepancy between CPC and SP2s then decreased as the particles grew. Once the particles were big enough to be detected by all the SP2s, the average num-ber concentration agreed with the CPC numnum-ber concentra-tion within±7 % (Fig. 6b), excluding DLR’s SP2 which re-mained a little lower (by 10 %) probably due to the lower laser power (Sect. 4.1.2).
As a conclusion, we can say that accurate number con-centration (±7 %) and reproducible number size distribution (±5 %) measurements can be achieved for BC cores bigger
thanDMEV= 100 nm (∼1 fg), independently of the type of particles sampled, with the caveats that the SP2 is properly adjusted and operated and that it has sufficient laser inten-sity. However, uncertainties increase below this diameter and depend a lot on careful instrument adjustment.
4.3 BC mass concentration determination
The reproducibility of the BC mass determination was tested using diesel car exhaust particles. Figure 7 shows that the BC mass size distributions of diesel soot measured by all SP2s agree within±10 % aboveDMEV= 90 nm.
Below this diameter, the difference increases to∼20 % at 70 nm. This increased uncertainty can again be explained by counting efficiency effects, but is probably also due to a higher calibration uncertainty at small BC mass. As an ex-ample, MPI and UMN’s SP2s measure an equal number con-centration (Fig. 6) but different mass concon-centration for CAST soot (Fig. 9). This discrepancy can only be explained by a difference in accuracy of the BC mass calibration.
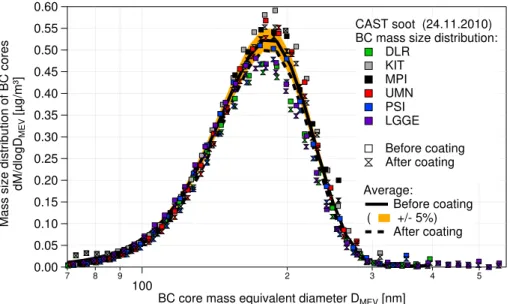
The effect of additional SOA coating on the BC core mass size distribution measurement was investigated with the CAST soot experiment also discussed in Sects. 4.2 and 4.5, as well as Figs. 6, 9 and 12. Figure 8 shows the BC core mass size distributions measured just before (01:30 p.m.) and just after the first coating step (02:00 p.m.). This coating step was estimated (from the SP2 data, Sect. 4.5) to increase the coat-ing thickness of the BC cores with diameters between 200– 250 nm from ∼25 nm to∼50 nm (Fig. 12). The BC core mass size distributions measured for the CAST soot agree be-tween the SP2s, as shown above for the diesel soot (Fig. 7). The difference of the averaged distribution before and after the coating step is as small as 5 %. Furthermore, this 5 % decrease can for the most part be explained by the contin-uous dilution of the AIDA chamber during the 30 min be-tween the two measurements. Absence of influence of the coating steps on counting efficiency and BC mass quantifica-tion during this experiment is further confirmed with Figs. 6 and 9. These results confirm that the SP2 is able to detect the BC core mass size distribution with high reproducibility and without interference from non-refractory coatings. The lat-ter has been shown in previous studies (Moteki and Kondo, 2007; Slowik et al., 2007; Cross et al., 2011).
4 5 6 104
2 3 4 5
Number conc. [#/cm
3 ]
12:00 PM 23/11/2010
6:00 PM 12:00 AM
24/11/2010
6:00 AM 12:00 PM
Date/time 120
100
80
60
Relative SP2 number conc.
SP2/CPC [%]
CAST soot: Color code:
DLR MPI
KIT PSI
UMN LGGE
CPC number concentration: CPC
CPC+/- 7%
Coating step A: BC number concentration
B: SP2/CPC number concentration
Fig. 6. (A)Particle number concentration time series of CAST soot as measured by the SP2s (lines) and the CPC (yellow circular markers). The shading corresponds to±7 % of the CPC number concentration.(B)Ratio of SP2 to CPC number concentration measurements.
0.24
0.20
0.16
0.12
0.08
0.04
0.00
Mass size distribution of BC cores
dM/dlogD
MEV
[µg/m³]
5 6 7 8 9
100 2 3 4
BC core mass equivalent diameter DMEV [nm]
Diesel BC mass size distribution (02.12.2010):
DLR KIT LGGE MPI PSI UMN
Average distribution +/-10%
Fig. 7.Comparison of BC core mass size distributions of diesel car exhaust as measured by the SP2s.
uncertainties of the two methods. This gives clear evidence that the fullerene soot calibration of the SP2, which has been shown to be suitable for ambient and diesel soot (Moteki and Kondo, 2010; Laborde et al., 2012), can also be applied for CAST soot. However, a similar experimental setup as in Moteki and Kondo (2010) or Laborde et al. (2012), using an aerosol particle mass analyser should be used to measure the SP2’s sensitivity to BC in CAST soot in order to confirm this result.
The comparison of the photoacoustic spectrometry (PAS) measurements with independent BC mass concentration measurements is commonly used to determine the mass
0.60
0.55
0.50
0.45
0.40
0.35
0.30
0.25
0.20
0.15
0.10
0.05
0.00
Mass size distribution of BC cores
dM/dlogD
MEV
[µg/m³]
7 8 9
100 2 3 4 5
BC core mass equivalent diameter DMEV [nm]
CAST soot (24.11.2010) BC mass size distribution:
DLR KIT MPI UMN PSI LGGE
Before coating After coating
Average:
Before coating
( +/- 5%)
After coating
Fig. 8.Coating effect on the SP2 mass measurement: CAST soot mass size distribution before (square markers) and after (butterfly markers) the first coating step. This coating step was estimated to increase the coating thickness of the BC cores with diameters between 200–250 nm from∼25 nm to∼50 nm.
55
50
45
40
35
30
25
20
15
10
5
0
BC (EC) Mass concentration [
µ
g/m
3 ]
12:00 PM 23/11/2010
12:00 AM 24/11/2010
12:00 PM
Date/time CAST soot:
SP2 (BC):
DLR PSI
MPI UMN
KIT LGGE
Average +/- 15%
Coating steps 1 2 Other:
Sunset (EC; thermo-optical)
Photoacoustic (BC; MAC = 12.5m2/g @ 532nm)
Fig. 9.BC (EC) mass concentration time series of CAST soot as measured by the SP2s (lines) and the Sunset analyser (square markers), and as inferred from the photoacoustic sensor (PAS; circular markers, assuming a mass absorption coefficient (MAC) of 12.5 m2g−1BC at the PAS wavelength of 532 nm). The shading corresponds to±15 % of the SP2s average concentration.
the MAC value in Schnaiter et al. (2006) was calculated us-ing TC values while BC (EC) values were used for this study. The comparison of the SP2 BC mass with the Sunset thermo-optical EC and the calculated MAC values should not be affected by the limited detection range of the SP2, as the mass size distribution of the CAST soot used for this comparison was well within the detection range of the SP2. The results presented in this section indicate the accuracy of the SP2’s BC measurement. However, the choice of
calibra-tion material influences the measured BC mass concentracalibra-tion value and thus determines the accuracy of the SP2 measure-ment. The influence of the calibration material on the result-ing BC mass measured by the SP2 will be discussed in detail in Sect. 5.
4.4 Optical sizing of purely scattering particles
of spherical and purely scattering SOA particles. The SOA aerosol was generated by ozonolysis ofα-pinene precursor gas in the AIDA chamber as explained in Sect. 2.2.3. The comparison of the SOA particle number size distributions measured by the SP2s, shown in Fig. 10, reveals good agree-ment (±15 %).
The lower detection limit for optical sizing differed quite a bit between the different instruments. This is mainly caused by different detector sensitivity and laser power, as well as different baseline noise and trigger levels for data recording. Identifying the exact detection limits for a certain data set requires careful consideration of all these parameters.
As explained in Sect. 3.3, the SP2’s scattering measure-ment is calibrated at a single particle size using a PSL size standard. The validity of this data analysis approach can be verified by comparing the SP2 measurements against the number size distribution measured by an SMPS. The SMPS sizes particles by their mobility diameter, which is equal to the volume equivalent diameter for spherical SOA particles. Optical diameters derived from the SP2’s scattering measure-ment are also volume equivalent diameters; however, abso-lute values will depend on the refractive index assumed to translate the measured scattering cross section to a corre-sponding optical diameter. This fact can actually be used to estimate the refractive index of the SOA particles by fitting the refractive index to achieve best match with the SMPS measurement. Moteki et al. (2010) previously applied a sim-ilar method to the SP2 data to infer optical properties of BC particles. Good agreement between SMPS and SP2 across the whole size distribution was found for a RI ofn= 1.35−0i at a wavelength of 1064 nm. This value is consistent with values reported by Nakayama et al. (2010) (n= 1.41−0iat λ= 532 nm andn= 1.458−0iatλ= 355 nm) but is lower than the one reported by Schnaiter et al. (2005), both for SOA fromα-pinene ozonolysis. In summary, the reproducibility of SP2 measurements of the number size distribution of purely scattering particles is ±15 %, and a SOA RI close to liter-ature value was found, indicating absolute accuracy of the optical sizing too.
4.5 Thickness of non-refractory coatings on BC particles
Accurate BC mass measurement (Sect. 4.3) and optical siz-ing (Sect. 4.4) are prerequisites for estimatsiz-ing the thickness of non-refractory coatings on BC particles by combining the calculated optical diameter of the whole particle and the mass equivalent diameter of the BC core with a concentric coated sphere Mie model. The optical sizing of BC containing parti-cles is more complicated than for purely scattering partiparti-cles, as it can only be done from the leading edge (as described in Sect. 3.3) of the scattering signal due to evaporation of absorbing particles in the laser beam.
A first comparison of coating thickness measurements is reported in Fig. 11 for an ambient air sample taken during
10 min on 2 December 2010. The normalized histograms of coating thickness for individual BC particles agree well be-tween the SP2s (solid lines). The minimum (150 nm) and maximum (400 nm) mass equivalent diameters of the BC cores included in this comparison were chosen such that the optical diameters of the whole coated particles were in be-tween the lower and upper LEO-fit detection limits of the least and most sensitive instruments, respectively. The aver-aged coating thickness (Fig. 11; dashed lines) agrees within ±17 % between the SP2s.
A second comparison of observed coating thickness is done for the long CAST soot experiment performed on 23– 24 November 2010. The temporal evolution of the median coating thickness is reported in Fig. 12 for BC particles with a core diameter in between 200 nm and 250 nm as measured by 5 SP2s. The measured coating thickness 1coat remains essentially constant at1coat∼20 nm during the initial phase of the experiment, where only coagulation occurs, and it in-creases substantially during the two coating steps, eventually reaching1coat∼120–150 nm. The agreement between SP2s is found to be within±15 % (excluding KIT’s SP2) for a coating between∼20 nm and∼150 nm. The TEAPD of the LGGE SP2 was misaligned on this day, preventing reliable coating thickness measurements. However, the coating thick-ness measured by the LGGE SP2 was reliable when the split point was resolved, e.g. for the ambient sample discussed above (Fig. 11). The KIT’s SP2 coating thickness is consis-tently lower than the other values. The BC core size distribu-tion and the optical sizing of the purely scattering particles measured by KIT’s SP2 agree with the results obtained from the other SP2s. Consequently, the coating thickness measure-ments should also agree. However, we speculate here that the coating thickness bias of KIT’s SP2 is due to the low laser power on this day (Sect. 4.1.2), also considering the fact that the KIT SP2 agrees with all the other instruments when the laser power was sufficiently high (i.e. during the first com-parison, Fig. 11).
Absolute verification of the coating thickness values is generally difficult and not possible with the data set available in this study. However, a basic comparison with the EC/TC value from the thermo-optical measurement can be done. The BC mass fractionεBC of each particle was calculated from the SP2 measurement performed on 24 November, using the following equation:
εBC=
DMEV3 ρBC
D3MEVρBC+(DMEV+21coat)3−DMEV3 ρOC
. (1)
2000
1800
1600
1400
1200
1000
800
600
400
200
0
Number size distribution
dN/dlogD [cm
-3 ]
2x10² 3
Optical diameter Dopt or mobility diameter Dmob [nm]
Pure SOA number size distribution: SP2; against Dopt:
(RI: n= 1.35+0i @ 1064nm)
DLR UMN
KIT PSI
MPI LGGE
Average nb size distribution +/-15%
Other; against Dmob: SMPS
Fig. 10.Number size distribution of pure SOA particles as measured by the SP2s (markers; plotted against optical diameter) and the SMPS (line; plotted against mobility diameter). The shading represents the SP2s’ average number size distribution±15 %. A refractive index of n= 1.35 + 0i at the laser’s wavelength of 1064 nm was used to calculate the optical diameter of the SOA particles from the differential scattering cross section measured by the SP2s.
12x10-3
10
8
6
4
2
0
Frequency of occurrence [-]
400 300
200 100
0
Coating thickness [nm]
Ambient BC core coating thickness (02.12.2010):
(BC core diameter limited to 150-400nm)
DLR: histogram average
KIT: histogram average
PSI: histogram average
MPI: histogram average
UMN: histogram average
LGGE: histogram average
+/- 17%
Fig. 11.Normalised histogram of coating thickness of ambient BC cores (sampled on 2 December) by non-refractory matter for particles with a BC core mass equivalent diameter in between 150 nm and 400 nm. A refractive index ofn= 2.26 + 1.26i, at the laser’s wavelength of 1064 nm, for the BC core was used, while a refractive index ofn= 1.5 was used for the non-refractory coating to calculate the coating thickness (see Sect. 3.3 for more details).
organic coating. The EC mass fraction,εEC, is approximately equal to the thermo-optical EC/TC measurement (Sunset) as the mass of the organic matter is almost equal to the mass of organic carbon.
εBC from the SP2 can then be directly compared to the εEC value from the Sunset instrument. The two methods agree within∼15 % (Table 5). This shows that the coating thickness measurement is also meaningful in absolute terms. However, it will always remain of semi-quantitative nature as
assumptions on the morphology and refractive indices of BC core and non-refractory coating have to be made in the Mie calculations (see Sect. 3.3).
5 Calibration material influence
200
180
160
140
120
100
80
60
40
20
0
Coating thickness [nm]
12:00 PM 12:00 AM
24/11/2010
Date / time 12:00 PM 24/11/2010
2:00 PM 4:00 PM 6:00 PM
CAST SOOT
Median coating thickness of BC cores with a diameter between 200 and 250nm:
DLR UMN
KIT PSI
MPI
Average +/- 15%
Coating steps 2 1
Fig. 12.Coating thickness of non-refractory matter on CAST soot BC cores. Time series of the coating thickness average for 5 SP2s±15 %. A refractive index ofn= 1.9 + 0.8i, at the laser’s wavelength of 1064 nm, for the BC core was used, while a refractive index ofn= 1.5 was used for the non-refractory coating to calculate the coating thickness (see Sect. 3.3 for more details). LGGE’s SP2 is not included in this graph as the LEO-fit could not be performed (detection of the particle’s position was unreliable as the TEAPD was not well adjusted).
Table 5.Composition of the CAST soot from the experiment con-ducted on 23–24 November 2010. Total carbon (TC), organic car-bon (OC) and elemental carcar-bon (EC) were measured by thermo-optical analysis (Sunset). The mass fraction of EC (εEC) is approx-imately equal to EC/TC as the mass of the organic matter is almost equal to the mass of organic carbon. The mass fraction of BC (εBC) is calculated from the SP2’s coating thickness measurement using Eq. (1).εECfrom the Sunset andεBCfrom the SP2 should be com-parable.
Date/time OC/TC εEC≈EC/TC εBC
Sunset Sunset SP2
23 Nov. 2010 10:19 0.62 0.38 Not available
23 Nov. 2010 16:50 0.64 0.36 0.3
24 Nov. 2010 09:01 0.61 0.39 0.35
(Moteki and Kondo, 2010; Laborde et al., 2012). It was shown that the SP2 is more sensitive to Aquadag than to fullerene soot and that the fullerene soot calibration agrees better with the SP2’s sensitivity to BC from (thermally de-nuded) diesel car exhaust, log-wood burner exhaust and am-bient particles (in locations with a dominant contribution of fossil fuel burning to BC mass). As a result, it was de-cided within the SP2 community, during a recent workshop, that fullerene soot should be the primary calibration standard for SP2 measurements (Baumgardner et al., 2012). However, many previous SP2 measurements rely on Aquadag calibra-tions. Therefore, it was also decided at the same workshop that Aquadag calibrations can be recalculated to a fullerene soot equivalent calibration using the approach proposed in
Baumgardner et al. (2012):
SFSeq(mBC)=
SAQ(mAQ)
mAQ
rFS2AQmBC. (2)
SFSeq is the fullerene soot equivalent SP2 signal amplitude as a function of BC mass (mBC), i.e. the fullerene soot equivalent calibration curve. SAQ is the measured SP2 in-candescence signal amplitude for Aquadag as a function of Aquadag mass (mAQ), i.e. the Aquadag calibration curve, andrFS2AQis the ratio between the SP2’s signal amplitudes for fullerene soot and Aquadag particles of equal mass.
2.0
1.8
1.6
1.4
1.2
1.0
0.8
0.6
Peak height ratio:
Aquadag / fullerene soot [-]
2 3 4 5 6 7 8 9
1 2 3 4 5 6 7 8 910 2 3 4 5
Particle mass [fg]
Aquadag=fullerene soot Ratio = 1.34
Aquadag to fullerene soot ratio:
DLR LGGE NOOA1
MPI PSI NOOA2
KIT UMN NOOA3
Fig. 13.SP2’s sensitivity difference between Aquadag and fullerene soot, shown as a ratio of the broadband incandescence signals for particles of equal mass. Three additional SP2s from NOAA are included in this comparison (Sect. 5).
ratio of all 9 SP2s was found to be∼1.34, which translates to an inverse sensitivity ratio of the SP2 sensitivity to fullerene soot and Aquadag ofrFS2AQ≈0.75 at a mass of 8.9 fg. This value of rFS2AQ is used in the recommendation by Baum-gardner et al. (2012) for recalculating Aquadag calibrations to fullerene soot equivalent calibrations. This specific value ofrFS2AQ is only valid for SP2s, using the same PMT and optical filter as detailed in Sect. 2.1.
The influence of the choice of calibration curve is clearly seen in Fig. 14a. The BC mass size distributions presented in Fig. 8 are repeated here by applying both the fullerene soot and the Aquadag calibration curves in the data analysis. Fig-ure 14a clearly illustrates that consistent results are achieved with all SP2s, if the same calibration material is used. How-ever, using the Aquadag calibration decreases the total mass concentration (area) by∼30 % and the modal diameter, in-ferred from BC mass per particle, shifts fromDMEV≈184 toDMEV≈165 nm compared to using the fullerene soot cal-ibration.
Figure 14b repeats the fullerene soot calibrated BC mass size distributions from Fig. 14a and compares them with the results obtained by applying the fullerene soot equivalent Aquadag calibration, recalculated from the Aquadag calibra-tion point at 8.9 fg (300 nm mobility diameter) according to Eq. (2) and usingrFS2AQ= 0.75 from above. The results from the two calibration approaches differ by less than 5 % for all SP2s (considering one instrument at a time in Fig. 14b). The agreement between SP2s remains within the reproducibil-ity (±10 % ) of the mass size distribution measurement al-ready reported in Sect. 4.3. The scaled Aquadag calibration performs well down to small diameters (DMEV≈100 nm), which is not self-evident given the simple scaling approach (Eq. 2). As a consequence, the method of applying a recalcu-lated fullerene soot equivalent Aquadag calibration curve is a valid and reproducible calibration approach.
This raises the question about the accuracy and compa-rability of previous BC data reported from SP2s calibrated with Aquadag. The effective density of the calibration ma-terial has also to be considered in this context, as most SP2 calibrations were done by selecting the calibration particles by their mobility diameter, rather than their mass, with a constant assumed effective density. Factory calibrations of the SP2 used to be based on size selected Aquadag assum-ing a constant effective density of 1000 kg m−3. However, the effective density of an Aquadag particle with a mobil-ity diameter of 300 nm is∼633 kg m−3. Using a density of 1000 kg m−3instead of 633 kg m−3has the effect of scaling the Aquadag calibration curve with a factor 0.63, which is a little smaller than the valuerFS2AQ= 0.75 promoted above, and thus brings the resulting calibration curve to∼15 % be-low the fullerene soot calibration. In conclusion, the original factory calibration of the SP2 is serendipitously close to the fullerene soot calibration now recommended by Baumgard-ner et al. (2012).
6 Conclusions
This study generally showed that all quantities measured by the SP2 are reproducible and quantitative (semi-quantitative for the coating thickness).
0.7
0.6
0.5
0.4
0.3
0.2
0.1
0.0
Mass size distribution of BC cores
dM/dlogD
MEV
[µg/m³]
9
100 2 3
BC core mass equivalent diameter [nm]
9
100 2 3
BC core mass equivalent diameter [nm]
Aquadag
Fullerene soot
A: CAST Soot size distribution analysed using:
Fullerene soot calibration Aquadag calibration
B: CAST Soot size distribution analysed using:
Fullerene soot calibration Aquadag calibration / 0.75
Color Code: LGGE KIT
MPI UMN
DLR PSI
Average distribution +/- 10% Average distribution +/- 10%
165 184
Fig. 14.BC core mass size distribution of CAST soot (24 November 2010) obtained from the SP2 measurements by applying the(A)fullerene soot calibration (square markers) and Aquadag calibration (circular markers) and(B)fullerene soot calibration (square markers) and fullerene soot equivalent calibration (dashed lines). The fullerene soot equivalent calibration was derived from the Aquadag calibration using Eq. (2).
was found to be reproducible within±15 %. However, fre-quent calibrations of the optical sizing are required in order to account for drifts of the relevant laser intensity.
The accuracy of the BC mass concentration depends on the selected calibration material. Previous studies showed that the SP2 is more sensitive to fullerene soot than to Aquadag and that fullerene soot should be used to calibrate the SP2 for atmospheric applications. A constant sensitivity ratio of 0.75 at 8.9 fg was found in this study, for all 9 SP2s compared, between the SP2 sensitivity to fullerene soot and Aquadag. This allows calculating a fullerene soot equivalent calibration from a measured Aquadag calibration. This method of re-calculating an Aquadag calibration produced results in good agreement (within±5 %) with those obtained by directly ap-plying a fullerene soot calibration.
The measured coating thickness was found to be repro-ducible (within±17 %). This result proves the robustness of the LEO-fit method used for the data analysis and could only be achieved due to the good agreement of the BC mass and optical size measurements. The estimated coating thickness was found to be consistent with thermo-optical EC/TC mea-surements. However, the coating thickness values are only considered to be semi-quantitative due to the need of numer-ous assumptions.
Generally the SP2 can really help in characterizing at-mospheric BC due to its high reproducibility and accuracy. However, great care has to be taken in preparing the SP2 instrument as both accuracy and reproducibility are tightly linked to proper SP2 calibration and tuning.
Supplementary material related to this article is available online at: http://www.atmos-meas-tech.net/5/ 3077/2012/amt-5-3077-2012-supplement.pdf.
Acknowledgements. Funding was received from the EU through EUROCHAMP-2 program and the Swiss National Science Foun-dation. A. W. and the MPIC Mainz acknowledge funding from the German Research Foundation (DFG, SPP-1294 HALO, PO 1013/2-2). We thank E. Traxler (University of Vienna) for analyzing the filters with the Sunset analyzer. B. W. and DLR Oberpfaffenhofen acknowledge funding by the Helmholtz Association under grant number VH-NG-606 (Helmholtz-University Young Investigators Group AerCARE). The University of Manchester would like to acknowledge support from the UK Natural Environment Research Council through the MC4 project [Grant ref: NE/H008136/1]. O. M. acknowledges funding from the Deutsche Forschungsge-meinschaft (DFG, SPP1294 HALO project MO 668/1-2) received to operate the AIDA facility for instrument intercomparison. Setup and operation of the mobile diesel engine at the AIDA facility was funded by the Karlsruhe Institute of Technology (KIT) startup funds (STUB 2011).