AMTD
7, 3075–3111, 2014Optimized method for BC analysis
I. A. Wendl et al.
Title Page
Abstract Introduction
Conclusions References
Tables Figures
◭ ◮
◭ ◮
Back Close
Full Screen / Esc
Printer-friendly Version Interactive Discussion
Discussion
P
a
per
|
D
iscussion
P
a
per
|
Discussion
P
a
per
|
Discuss
ion
P
a
per
|
Atmos. Meas. Tech. Discuss., 7, 3075–3111, 2014 www.atmos-meas-tech-discuss.net/7/3075/2014/ doi:10.5194/amtd-7-3075-2014
© Author(s) 2014. CC Attribution 3.0 License.
Atmospheric Measurement
Techniques
Open Access
Discussions
This discussion paper is/has been under review for the journal Atmospheric Measurement Techniques (AMT). Please refer to the corresponding final paper in AMT if available.
Optimized method for black carbon
analysis in ice and snow using the Single
Particle Soot Photometer
I. A. Wendl1,2,3,*, J. A. Menking4,*, R. Färber5, M. Gysel5, S. D. Kaspari4, M. J. G. Laborde5, and M. Schwikowski1,2,3
1
Laboratory of Radiochemistry and Environmental Chemistry, Paul Scherrer Institut, 5232 Villigen PSI, Switzerland
2
Oeschger Centre for Climate Change Research, University of Bern, Bern, Switzerland
3
Department of Chemistry and Biochemistry, University of Bern, Bern, Switzerland
4
Department of Geological Sciences, Central Washington University, Ellensburg, WA, USA
5
Laboratory of Atmospheric Chemistry, Paul Scherrer Institut, 5232 Villigen PSI, Switzerland
*
These authors contributed equally to this work.
Received: 11 February 2014 – Accepted: 14 March 2014 – Published: 28 March 2014
Correspondence to: M. Schwikowski ([email protected])
AMTD
7, 3075–3111, 2014Optimized method for BC analysis
I. A. Wendl et al.
Title Page
Abstract Introduction
Conclusions References
Tables Figures
◭ ◮
◭ ◮
Back Close
Full Screen / Esc
Printer-friendly Version Interactive Discussion
Discussion
P
a
per
|
D
iscussion
P
a
per
|
Discussion
P
a
per
|
Discuss
ion
P
a
per
|
Abstract
In this study we attempt to optimize the method for measuring black carbon (BC) in snow and ice using a single particle soot photometer (SP2). Beside the previously applied ultrasonic (CETAC) and Collison-type nebulizers we introduce a jet (APEX-Q) nebulizer to aerosolize the aqueous sample for SP2 analysis. Both CETAC and
APEX-5
Q require small sample volumes (few milliliters) which makes them suitable for ice core analysis. The APEX-Q shows the least size-dependent nebulizing efficiency in the BC particle diameter range of 100–1000 nm. The CETAC has the advantage that air and liquid flows can be monitored continuously. All nebulizer-types require a calibration with BC standards for the determination of the BC mass concentration in unknown
10
aqueous samples. We found Aquadag to be a suitable material for preparing calibration standards. Further, we studied the influence of different treatments for fresh discrete snow and ice samples as well as the effect of storage. The results show that samples are best kept frozen until analysis. Once melted, they should be sonicated for 25 min, immediately analyzed while being stirred and not be refrozen.
15
1 Introduction
Light-absorbing impurities in snow and ice play an important role in the Earth’s radia-tive balance and thus climate change. The main absorbers of visible solar radiation are atmospheric black carbon (BC) particles, emitted by incomplete combustion of biomass and fossil fuels. When deposited on snow or ice, BC lowers the albedo of the surface,
20
leading to accelerated melt. Recently, Bond et al. (2013) reported a radiative forcing between 0.01 and 0.09 W m−2 for the snow albedo effect of BC. Furthermore, the effi -cacy of this forcing was found to be up to three times greater than the forcing by CO2
(Flanner et al., 2007).
Traditionally, BC concentration in snow and ice has been analyzed by filter-based
25
AMTD
7, 3075–3111, 2014Optimized method for BC analysis
I. A. Wendl et al.
Title Page
Abstract Introduction
Conclusions References
Tables Figures
◭ ◮
◭ ◮
Back Close
Full Screen / Esc
Printer-friendly Version Interactive Discussion
Discussion
P
a
per
|
D
iscussion
P
a
per
|
Discussion
P
a
per
|
Discuss
ion
P
a
per
|
et al., 2012; Lavanchy et al., 1999). These methods require large sample volumes usually not available from ice cores. Ice cores offer a unique medium to study the variability of BC concentrations over long time periods, but analyses that require large sample volumes result in low time (or depth) resolution. Furthermore, the filter-based methods have the potential to over- or underestimate the BC mass concentration due
5
to analytical artifacts, such as charring of organic carbon (Soto-Garcia et al., 2011), dust interference (Wang et al., 2012), or filter efficiency (Torres et al., 2014).
The Single Particle Soot Photometer (SP2, Droplet Measurement Technology, Inc., Boulder, CO, USA, Schwarz et al., 2006) has been used in snow and ice research in a variety of studies (Bisiaux et al., 2012a, b; Kaspari et al., 2011; McConnell et al.,
10
2007; Sterle et al., 2013). The SP2 does not require a filtration step, which makes it less time-consuming than the traditional methods and enables its use in a continuous flow analysis system. The SP2 analysis requires very little sample volume, which al-lows obtaining highly time-resolved data series, even from ice cores. However, the SP2 requires an aerosolization step because it analyzes only airborne samples. This step
15
can be incorporated in a continuous flow system (McConnell et al., 2007) or in batch analysis (Ohata et al., 2011). The SP2 response is BC-specific and not affected by particle morphology or coatings (Cross et al., 2010; Laborde et al., 2012; Moteki and Kondo, 2007; Slowik et al., 2007), though there is a small positive artifact caused by high dust loadings (Schwarz et al., 2012), which are rarely found in ice cores.
Further-20
more, the SP2 returns the size distribution of BC particles in addition to their mass concentration.
Mainly continuous flow systems have been used for measuring BC in ice, but the importance of discrete samples must not be underestimated because (1) poor ice core quality might make it impossible to cut undisturbed ice columns needed for continuous
25
AMTD
7, 3075–3111, 2014Optimized method for BC analysis
I. A. Wendl et al.
Title Page
Abstract Introduction
Conclusions References
Tables Figures
◭ ◮
◭ ◮
Back Close
Full Screen / Esc
Printer-friendly Version Interactive Discussion
Discussion
P
a
per
|
D
iscussion
P
a
per
|
Discussion
P
a
per
|
Discuss
ion
P
a
per
|
This study aims to provide SP2 users with a method for analyzing discrete liquid snow and ice samples. This includes the discussion of (1) the aerosolization of the aqueous samples focusing on (a) differences between the three nebulizer systems tested (ultrasonic (CETAC), jet (APEX-Q), and Collison-type), and (b) the quantification of the nebulizer efficiency and BC losses in the system using aqueous BC reference
5
standards, (2) the calibration of the SP2 for aqueous sample analysis, and (3) the best methods of sample treatment and sample storage.
Different terms are found in the literature for the most refractory and light-absorbing component of carbonaceous aerosols depending on the applied experimental method (e.g., black carbon, BC, or elemental carbon, EC). In this study we applied a SP2, which
10
utilizes laser-induced incandescence for quantitative measurements of refractory black carbon (rBC) in single particles, which we denote BC throughout this manuscript.
2 Experimental
In this section we describe the SP2-setup for analysis of aqueous samples (particularly snow and ice) with emphasis on the use of a nebulizer to transform BC particles from
15
an aqueous sample into a dry aerosol and transport them to the SP2. Furthermore, we describe the internal calibration of the SP2 and the basic principle for determining the BC mass concentration of an unknown aqueous sample.
2.1 Nebulizer/SP2-setup
The SP2 is an instrument widely applied in aerosol science that uses the principle of
20
laser-induced incandescence to measure the mass concentration and size distribution of BC on a particle-by-particle basis. Individual BC particles are heated to their boiling point (∼4200 K) by a continuous-wave Nd:YAG-laser. The peak intensity of the thermal
radiation is proportional to the BC mass in the particle (Schwarz et al., 2006). The ther-mal radiation is detected with two photomultiplier tubes covering different wavelength
AMTD
7, 3075–3111, 2014Optimized method for BC analysis
I. A. Wendl et al.
Title Page
Abstract Introduction
Conclusions References
Tables Figures
◭ ◮
◭ ◮
Back Close
Full Screen / Esc
Printer-friendly Version Interactive Discussion
Discussion
P
a
per
|
D
iscussion
P
a
per
|
Discussion
P
a
per
|
Discuss
ion
P
a
per
|
ranges (broadband: ∼350–800 nm; narrowband: ∼630–800 nm). Each detector has
two different electronic signal amplification gains (high and low). We run the broad-band and narrowbroad-band detectors with staggered gains and combine the signals from the high gain broadband output with the low gain narrowband output in order to maxi-mize the detectable BC mass (per particle) range. The band ratio, calculated from the
5
ratio of the broadband to narrowband signals, depends on the boiling point temperature and the spectral emissivity of the incandescent material, thus providing information to distinguish BC particles from e.g. metal particles (Stephens et al., 2003).
The BC analysis of aqueous samples with the SP2 requires a nebulizer to aerosolize and dry the liquid before it can be measured. Primarily Collison-type and ultrasonic
10
nebulizers have been used with the SP2. Here, we also discuss a jet nebulizer system, the APEX-Q (High Sensitivity Sample Introduction System, Elemental Scientific Inc., Omaha, NE, USA). The three systems not only vary in their nebulizing principle but also in their efficiencies, i.e. the fraction of water-insoluble particles of the injected liquid sample that is successfully nebulized and ends up in the aerosol provided at
15
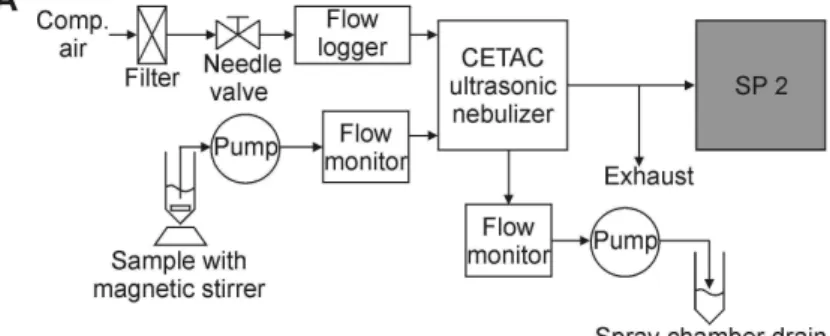
the outlet of the nebulizer. In the following we describe the three nebulizer/SP2-setups (Fig. A1).
2.1.1 Ultrasonic nebulizer (CETAC)
The ultrasonic nebulizer (U5000 AT, CETAC Technologies, Omaha, NE, USA), charac-terized by a high efficiency and a low sample consumption, has been used in several
20
previous SP2 studies of BC in aqueous samples (Bisiaux et al., 2012a, b; Kaspari et al., 2011; McConnell et al., 2007; Ohata et al., 2011, 2013; Sterle et al., 2013). In the CETAC/SP2-setup (Fig. A1a), the aqueous sample is pumped (peristaltic pump, polyfluoralkoxy-polymer (PFA) tubing) to a glass spray chamber where contact with an ultrasonic transducer causes the liquid containing the solid BC particles to become
25
AMTD
7, 3075–3111, 2014Optimized method for BC analysis
I. A. Wendl et al.
Title Page
Abstract Introduction
Conclusions References
Tables Figures
◭ ◮
◭ ◮
Back Close
Full Screen / Esc
Printer-friendly Version Interactive Discussion
Discussion
P
a
per
|
D
iscussion
P
a
per
|
Discussion
P
a
per
|
Discuss
ion
P
a
per
|
The primary benefit of the CETAC is that it allows the continuous monitoring of the maximal possible nebulizer efficiency (ηmax, Eq. S12). This is accomplished by using
flow monitors to measure the rate at which the sample is introduced to the nebulizer and the rate at which that sample drains from the aerosol chamber. This drainage includes sample that was not nebulized as well as sample that impacted on the glass
5
walls of the aerosol chamber before reaching the drying chamber. Characterizing the nebulizer efficiency is necessary because the performance of the ultrasonic transducer may vary during use. However, potential particle losses (εloss(D), Eq. S13) cannot be
quantified. Thus the CETAC has to be calibrated with a standard (hereafter referred to as external calibration as in Bisiaux et al. (2012b).
10
Experiments performed on the CETAC at Central Washington University (CWU), WA, USA, indicate that the optimal settings for BC analysis of snow and ice samples are 0.75 L min−1purge airflow and 0.5 mL min−1liquid sample inflow. The aerosol is heated to 140◦C and cooled to 3◦C to remove the water. The operating temperatures are based on recommendations from the manufacturer and are restricted because of the
15
need to fully dry the aerosol before introducing it into the SP2. Minor temperature ad-justments (140–160◦C heating, 1–3◦C cooling) did not result in significant changes in the BC concentrations (CSP2, lowη , Eq. S32) derived from SP2 measurements. Alter-ing the airflow to higher and lower values resulted in 10–33 % lower BC concentrations compared to normal flow. Similarly, sample inflows of 0.55 mL min−1and higher caused
20
steadily decreasing BC concentrations with up to 34 % reduction. Changing these pa-rameters may lead to inefficient nebulization of BC particles or to inefficient transport of BC particles to the SP2.
Repeated measurements of the same sample showed a standard deviation within 10 % of the mean over time periods from days to weeks, though changes in the
per-25
AMTD
7, 3075–3111, 2014Optimized method for BC analysis
I. A. Wendl et al.
Title Page
Abstract Introduction
Conclusions References
Tables Figures
◭ ◮
◭ ◮
Back Close
Full Screen / Esc
Printer-friendly Version Interactive Discussion
Discussion
P
a
per
|
D
iscussion
P
a
per
|
Discussion
P
a
per
|
Discuss
ion
P
a
per
|
2.1.2 Jet nebulizer (APEX-Q)
The APEX-Q can be operated in self-aspirating mode, where the flow of the carrier gas (particle-free compressed air), the diameter and length of the capillary and the geometry of the nebulizer nozzle define the liquid sample flow. The aqueous sample is aerosolized into a heated (100◦C) glass cyclonic spray chamber with a jet nebulizer.
5
The aerosol is then cooled (2◦C) in a Peltier-cooled multipass condenser to remove the remaining water vapor before being introduced into the SP2 (Elemental Scientific Inc., 2013).
The APEX-Q as applied at the Paul Scherrer Institut (PSI), Switzerland, can be run with liquid sample flows between 10 and 700 µL min−1, requiring small sample volumes
10
(see Sect. 3.1.2). The maximal nebulizer efficiency (ηmax, Eq. S12) is unknown for the
APEX-Q because most of the liquid not nebulized is evaporated from the heated spray chamber walls. Thus an external calibration is indispensable for quantitative liquid BC mass concentration determinations.
The optimal APEX-Q/SP2-setup (Fig. A1b) includes an APEX-Q PFA-ST MicroFlow
15
nebulizer (ES-2040-7000) and a 1.5 m long PFA capillary with an inner diameter of 0.25 mm (ES-2042; both Elemental Scientific Inc., Omaha, NE, USA). The optimal purge airflow is 1 L min−1, which for our MicroFlow nebulizer (serial no. APEX-Q PFA-ST 1322) results in a liquid sample inflow of 0.13 mL min−1 to the APEX-Q, but may vary with time and nebulizer. Other settings and options e.g., higher air inflow, use of
20
a glass nebulizer, and different diameters of tubing, did not result in higher BC concen-trations and/or shorter measuring time even with higher sample consumption. The flow parameters of the APEX-Q/SP2-setup are monitored manually and adjusted if neces-sary.
Repeated measurements of the same sample varied within 15 % standard deviation
25
AMTD
7, 3075–3111, 2014Optimized method for BC analysis
I. A. Wendl et al.
Title Page
Abstract Introduction
Conclusions References
Tables Figures
◭ ◮
◭ ◮
Back Close
Full Screen / Esc
Printer-friendly Version Interactive Discussion
Discussion
P
a
per
|
D
iscussion
P
a
per
|
Discussion
P
a
per
|
Discuss
ion
P
a
per
|
2.1.3 Collison-type nebulizer
In the PSI in-house built Collison-type nebulizer a pressurized air stream that expands through a critical orifice causes the aqueous sample to be aspirated through a tube. The aqueous sample hits the air stream orthogonally and is sheared into droplets that are subsequently dried in a diffusion dryer and transported to the SP2 (Fig. A1c).
5
Collison-type systems can be built in-house which makes them inexpensive com-pared to other nebulizers. However, they have a high percentage of drain and thus, if no recirculation of the sample is performed, require relatively large sample volumes (>50 mL). Additionally, in the current design at PSI there is no control on how much sample is used because the sample is moved passively.
10
The Collison-type nebulizer built at PSI is run with an air pressure of 2.5 bar. The sample flow was not determined.
2.2 Internal calibration
The SP2 needs empirical calibration to assign a BC mass to a given SP2 response, hereafter referred to as internal calibration. Unfortunately, the sensitivity of the SP2
dif-15
fers substantially between different BC-types (Laborde et al., 2012; Moteki and Kondo, 2010). For atmospheric applications the SP2 is calibrated according to its sensitivity to BC that is typically found in ambient and diesel engine exhaust particles. This is commonly done with a mass-selected Fullerene Soot or Aquadag (AQ) particles and applying appropriate scaling factors as recommended in Baumgardner et al. (2012).
20
Two aspects are important for accurate quantification of BC mass in liquid samples. First, the SP2 must be calibrated according to its sensitivity to the BC-type under in-vestigation. It may be necessary to choose different SP2 calibration for the aqueous BC standard and e.g. an ice core sample. Second, it is important to account for potential non-BC matter in the SP2 calibration material in a consistent manner (see next section
25
AMTD
7, 3075–3111, 2014Optimized method for BC analysis
I. A. Wendl et al.
Title Page
Abstract Introduction
Conclusions References
Tables Figures
◭ ◮
◭ ◮
Back Close
Full Screen / Esc
Printer-friendly Version Interactive Discussion
Discussion
P
a
per
|
D
iscussion
P
a
per
|
Discussion
P
a
per
|
Discuss
ion
P
a
per
|
2.3 Approaches to determine the BC mass concentration of an aqueous sample
The nebulizer efficiency must be accounted for when determining the BC mass con-centration in an aqueous sample via SP2 measurement of the nebulized aerosol. This can be done in two ways: (1) by determining the nebulizer efficiency, or (2) by relat-ing the measurement of the unknown sample to the measurement of an aqueous BC
5
standard with known concentration (external calibration).
2.3.1 Using known nebulizer efficiency
If the overall nebulizer efficiency is known for all BC particle sizes, it is possible to directly infer the BC mass concentration in a liquid sample from the BC mass size distribution measured by the SP2 for the nebulized sample by using Eq. (S27) in the
10
Supplement. The only errors introduced with this approach arise from a potential SP2 calibration bias and missing BC mass from particles with a BC mass outside the de-tection range of the SP2 (Eq. S28). However, this approach has to our knowledge not been used so far as the nebulizer efficiency is typically not exactly known.
The overall nebulizer efficiency depends on the fraction of nebulized sample, the
15
liquid and air flow rates as well as the BC particle losses in the system. An upper limit for the nebulizer efficiency ηmax can be calculated from the relevant flow rates
(Eq. S12), with the assumption that no BC particle losses occur. A lower limit for the BC mass concentration in the aqueous sampleCηSP2, lowis then obtained with (Eq. S32):
CSP2, lowη = 1 ηmax
cSP2 (1)
20
wherecSP2 is the BC mass concentration of the nebulized sample measured by the
SP2. This approach has previously been applied by Kaspari et al. (2011). Based on analysis of aqueous BC standards,CηSP2, low determined using the CETAC/SP2-setup at CWU underestimates BC concentration by at least 50 % (see also Sect. S.3.2). Using
25
AMTD
7, 3075–3111, 2014Optimized method for BC analysis
I. A. Wendl et al.
Title Page
Abstract Introduction
Conclusions References
Tables Figures
◭ ◮
◭ ◮
Back Close
Full Screen / Esc
Printer-friendly Version Interactive Discussion
Discussion
P
a
per
|
D
iscussion
P
a
per
|
Discussion
P
a
per
|
Discuss
ion
P
a
per
|
2.3.2 Using external calibration
Commonly (Bisiaux et al., 2012a, b; Sterle et al., 2013), the nebulizer efficiency is im-plicitly accounted for with relating the SP2 measurement of a nebulized sample to that of an aqueous BC standard of known concentration. Two slightly different approaches can be chosen.
5
Approach 1
The nebulizer efficiency is assumed to remain stable between measurement of the sample and the standard. With this approach, the BC mass concentration in the aque-ous sample under investigationCSP2S1 is calculated as (Eq. S35 in the Supplement):
CSP2S1 :=cSP2
C∗
liq
c∗
SP2
(2)
10
wherecSP2 and c
∗
SP2 are the BC mass concentrations measured by the SP2 for the
aerosols from the nebulized aqueous sample and aqueous standard, respectively, and
Cliq∗ is the BC mass concentration of the aqueous standard.
This approach can be applied for any nebulizer with a stable efficiency, e.g. the
15
APEX-Q and the Collison-type. The inferred, CS1SP2, and true, Cliq, BC mass
concen-trations of the aqueous sample relate as follows (Eq. S42 in the Supplement):
CSP2S1 =Cliq
fbias
f∗
bias
kS1 (3)
The result is biased if the sensitivity of the SP2 to the BC-types in the sample and/or
20
standard is unknown, thus the respective SP2 calibration bias factorsfbias and/orf∗
bias
will be different from unity (see Eq. S16 in the Supplement for definition offbias). This
AMTD
7, 3075–3111, 2014Optimized method for BC analysis
I. A. Wendl et al.
Title Page
Abstract Introduction
Conclusions References
Tables Figures
◭ ◮
◭ ◮
Back Close
Full Screen / Esc
Printer-friendly Version Interactive Discussion
Discussion
P
a
per
|
D
iscussion
P
a
per
|
Discussion
P
a
per
|
Discuss
ion
P
a
per
|
known, whereas it is not necessary that the SP2 sensitivity is equal for the sample and the standard.
The factor kS1 in Eq. (3) is given in Eq. (S43) in the Supplement. It shows that
additional errors can potentially be introduced due to the following two reasons: (1) if a substantial portion of the BC mass size distribution of the sample and/or the standard
5
falls outside the detection range of the SP2, or (2) if the nebulizer efficiency depends on the size of the BC particles. The bias introduced by the latter only disappears if the nebulizer efficiency is independent of size or if the BC size distributions of the sample and standard have equal shape. The stronger the size-dependence of the nebulizer efficiency and the more different the size distribution shapes, the larger the bias
intro-10
duced by the second reason (see Sect. S.2 for details).
This approach is applied for the APEX-Q/SP2- and the Collison-type/SP2-setups at PSI.
Approach 2
Drifts of the liquid sample and/or air flow rates between the measurement of the
stan-15
dard and the sample will result in a drift of the nebulizer efficiency. If these flows are monitored this can be accounted for by using the following equation to infer the BC mass concentrationCSP2S2 of the liquid sample (Eq. S37).
CSP2S2 :=CSP2, lowη C
∗
liq
CSP2, lowη,∗ (4)
20
whereCηSP2, low and CSP2, lowη,∗ are the lower limit of the BC mass concentration in the aqueous sample and standard, respectively, as inferred with Eq. (1).
This approach is applied for the CETAC/SP2-setups at CWU and PSI.
The approaches 1 and 2 are identical if the flow rates do not drift, and the caveats made for approach 1 regarding biases introduced with using an external calibration
AMTD
7, 3075–3111, 2014Optimized method for BC analysis
I. A. Wendl et al.
Title Page
Abstract Introduction
Conclusions References
Tables Figures
◭ ◮
◭ ◮
Back Close
Full Screen / Esc
Printer-friendly Version Interactive Discussion
Discussion
P
a
per
|
D
iscussion
P
a
per
|
Discussion
P
a
per
|
Discuss
ion
P
a
per
|
also apply for approach 2 (see also Eqs. S44 and S45). The external calibration fac-torCliq∗ /CSP2, lowη,∗ for approach 2 (orC∗liq/c∗SP2 for approach 1) can be determined with a single measurement of a suitable standard. We determined this ratio from a series of measurements of different standards with concentrations in the range C∗
liq=0.5 to
∼14 µg L−1 (for details on the preparation see Sect. 2.4.1). The results are given in
5
Table 1, where the values correspond to the slope of the linear regression through the correlation ofC∗
liq withC
η,∗
SP2, low for each standard and with using the internal SP2
calibration as indicated in the column header.
2.4 Standard preparation
2.4.1 BC standards 10
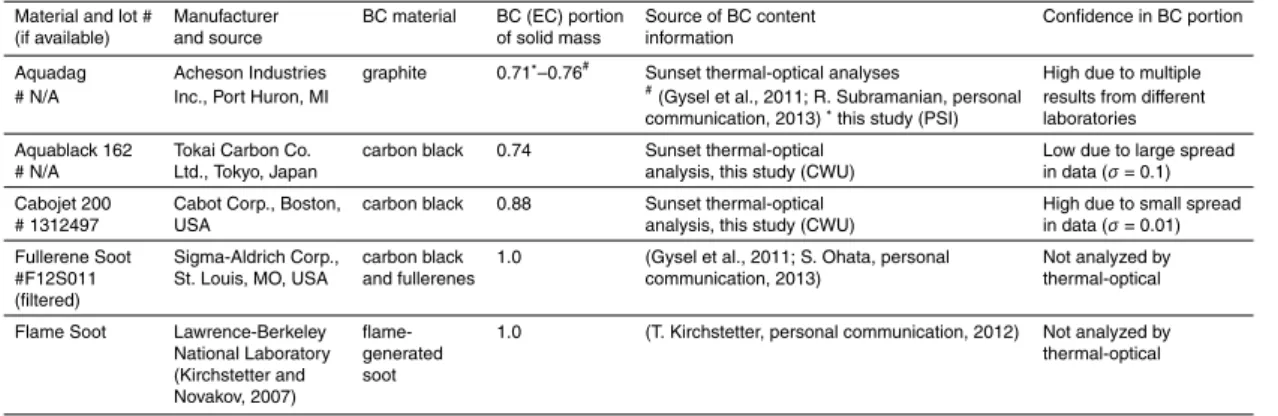
In order to determine uncertainties associated with using the external calibration ap-proach and to identify the suitable materials as standard for external calibration we prepared standards withCliq∗ ranging from 0.5 to 14 µg L−1 using different BC-like ma-terials (AQ, Aquablack 162, Cabojet 200, Flame Soot and Fullerene Soot), similar to the procedure described below for AQ. The actual BC content of each material was
15
considered in the calculation of the concentration:∼71 % for AQ, 74 % for Aquablack,
88 % for Cabojet, and 100 % for Fullerene (Gysel et al., 2011; S. Ohata, personal com-munication, 2013) and Flame Soot (T. Kirchstetter, personal comcom-munication, 2012) (Table B1).
AQ is an industrial lubricant consisting of a colloidal suspension of aggregates of
20
graphitic carbon in water with∼70.5±1.0 % (1σ) BC content of the dry mass (76 % in Gysel et al., 2011). The dry mass needs to be determined for each batch because the moisture content may vary between batches, and AQ can dry over time.
We prepared a stock with a BC mass concentration of 2500 µg L−1 in a 1 L glass volumetric flask. The standards were diluted by mass from this stock immediately prior
25
AMTD
7, 3075–3111, 2014Optimized method for BC analysis
I. A. Wendl et al.
Title Page
Abstract Introduction
Conclusions References
Tables Figures
◭ ◮
◭ ◮
Back Close
Full Screen / Esc
Printer-friendly Version Interactive Discussion
Discussion
P
a
per
|
D
iscussion
P
a
per
|
Discussion
P
a
per
|
Discuss
ion
P
a
per
|
stock in a 50 mL polypropylene (PP) vial. Then we created standards of 0.5–14 µg L−1 BC in individual 50 mL PP vials (≥5 µg L−1standard diluted from the 2500 µg L−1stock; ≤2 µg L−1standard diluted from the 100 µg L−1stock).
2.4.2 Polystyrene latex sphere (PSL) standards
In order to investigate the size-dependence of the nebulizer efficiency (Sect. 3.1) we
5
prepared standards of polystyrene latex spheres (PSL). We used PSLs with diameters of 100, 150, 269, 350, 450, 600, 800 and 1000 nm (Duke Scientific Corp., CA, USA) at PSI, and diameters of 220, 356, 505, 771 and 1025 nm (Polyscience Inc., Warring-ton, PA, USA) at CWU. For a known PSL number concentration in water we used the solid weight percentage determined by drying (on average 1.2±0.2 % for the Duke
10
PSLs) and provided by the manufacturer (7 % for the Polyscience PSLs; Schwarz et al., 2012), respectively, and calculated the number concentrations according to Eq. (1) in Schwarz et al. (2012). These ranged from 2.65×10⁶ to 2.48×10⁹particles cm−3 for
the Duke PSL standards, which were diluted further (at least 1 : 5) for analysis with the CETAC/and APEX-Q/SP2-setups. The Polyscience PSLs ranged from 1.5×10⁵to
15
7.9×10⁵particles cm−3.
3 Results and discussion
First, we compare the three different nebulizers tested regarding their nebulizer ef-ficiency which was previously indicated to be size-dependent (Ohata et al., 2013; Schwarz et al., 2012), followed by the differences in sample consumption. Second, we
20
AMTD
7, 3075–3111, 2014Optimized method for BC analysis
I. A. Wendl et al.
Title Page
Abstract Introduction
Conclusions References
Tables Figures
◭ ◮
◭ ◮
Back Close
Full Screen / Esc
Printer-friendly Version Interactive Discussion
Discussion
P
a
per
|
D
iscussion
P
a
per
|
Discussion
P
a
per
|
Discuss
ion
P
a
per
|
3.1 Nebulizer comparison
3.1.1 Size-dependence of the nebulizer efficiency
The nebulizer efficiencies for different particle sizes were determined by measuring the PSL standards of known number concentration described in Sect. 2.4.2 with the three nebulizer/SP2-setups (Eq. S5 in the Supplement). We extend previous studies (Ohata
5
et al., 2013; Schwarz et al., 2012) by introducing a jet nebulizer and analyzing BC standards. At PSI all three nebulizer-types were tested, whereas only a CETAC was tested at CWU.
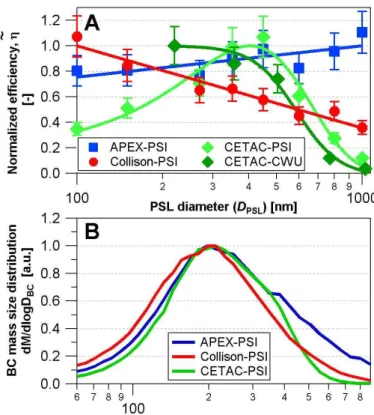
As illustrated in Fig. 1a the CETAC has a decreased efficiency not only in the large (>500 nm) (Schwarz et al., 2012) but also in the small size range (<200–250 nm),
sim-10
ilar to findings by Ohata et al. (2013). The Collison-type nebulizer shows a decreased efficiency in the large size range, whereas the APEX-Q gives a size-independent effi -ciency for the tested size range from 100 to 1000 nm within the variability of the whole setup (15 %).
We further tested the three nebulizers in terms of behavior to a commercially
avail-15
able BC standard, namely AQ. The BC mass size distribution of polydisperse AQ, nor-malized to the maximum, as measured with the three setups (Fig. 1b), shows that the Collison-type nebulizer skews the BC mass concentration towards smaller sizes, com-pared to the APEX-Q with a size-independent efficiency, and the CETAC reduces the tails of the size distribution at either end. This indicates that the size-dependence of the
20
nebulizer efficiencies determined for PSLs (Fig. 1a) also applies to AQ particles, at least qualitatively. Relating the shape of the AQ size distribution measured by the Collison-type nebulizer to that measured by the APEX-Q allows estimating the nebulizer effi -ciency of the Collison-type nebulizer for AQ as a function of BC mass-equivalent diam-eter (Eq. S67 in the Supplement) and mobility diamdiam-eter (Eq. S72), making use of the
25
AMTD
7, 3075–3111, 2014Optimized method for BC analysis
I. A. Wendl et al.
Title Page
Abstract Introduction
Conclusions References
Tables Figures
◭ ◮
◭ ◮
Back Close
Full Screen / Esc
Printer-friendly Version Interactive Discussion
Discussion
P
a
per
|
D
iscussion
P
a
per
|
Discussion
P
a
per
|
Discuss
ion
P
a
per
|
of this approach, whereas the relevant particle diameter that determines the losses for the BC particles is likely somewhere between the mass-equivalent and the mobility diameter. Based on this finding it would be justified to use the nebulizer efficiency in-ferred from PSL measurements to quantify the BC mass concentration of an unknown sample with using the approach of Sect. 2.3.1.
5
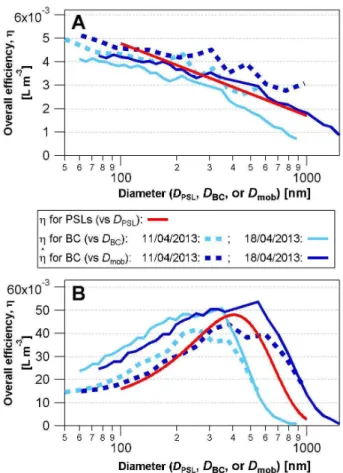
The efficiency of the PSI-CETAC for BC was determined in the same manner. Fig-ure 2b reveals that the nebulizer efficiency has the same shape and magnitude for BC and PSLs. However, there is a substantial and size-dependent shift in diameter both when using the mass-equivalent or the mobility diameter for BC particles. This makes it difficult to impossible to accurately infer the efficiency for BC from that for PSLs. Thus
10
applying Eq. (S27, Supplement) to quantify the BC mass concentration of an unknown sample would be associated with considerable uncertainty when using a nebulizer with a very strongly size-dependent efficiency such as the CETAC.
3.1.2 Sample consumption
Sample consumption is crucial, especially when working with ice cores of limited
vol-15
ume. The Collison-type nebulizer at PSI requires sample volumes>50 mL, whereas both the CETAC and APEX-Q need relatively small sample volumes. In the case of our AQ standards this was<3 mL, which can be used as a guide value, although it may vary depending on whether the particle size distribution of the sample differs strongly from that of AQ.
20
Generally, the amount of sample volume required is determined by the recommen-dation to record ∼10 000 BC-containing particles (Schwarz et al., 2012) to ensure statistical precision of the measurement. We can only support this recommendation although it may take more than an hour to record 10 000 particles with the APEX-Q. If this is not feasible with one sample in terms of available sample volume and measuring
25
AMTD
7, 3075–3111, 2014Optimized method for BC analysis
I. A. Wendl et al.
Title Page
Abstract Introduction
Conclusions References
Tables Figures
◭ ◮
◭ ◮
Back Close
Full Screen / Esc
Printer-friendly Version Interactive Discussion
Discussion
P
a
per
|
D
iscussion
P
a
per
|
Discussion
P
a
per
|
Discuss
ion
P
a
per
|
analysis of snow and ice samples using a nebulizer/SP2-setup. However, the nebulizing efficiency of the APEX-Q has to be assumed as constant, whereas with the CETAC it can be continuously monitored.
Onwards in the paper, we exclude the Collison-type nebulizer from the discussion because its high sample consumption makes it unsuitable for the analysis of snow and
5
ice samples.
3.2 Uncertainty of external calibration approach and choice of BC standard material
The standards of different BC-like materials (AQ, Aquablack 162, Cabojet 200, Flame Soot and Fullerene Soot; see Sect. 2.4.1 for preparation procedure) were analyzed with
10
the CETAC/SP2-setup at CWU to determine the external calibration factorCliq∗ /CηSP2, low,∗
for the second approach of external calibration (Sect. 2.3, Eq. 4), which accounts for flow rate drifts.
The sensitivity of the SP2 to the BC-type in Aquablack, Cabojet and Flame Soot is not known, thereforecSP2 was determined with both AQ and Fullerene Soot internal
15
calibration data (Sects. 2.2 and S.5 in the Supplement). Thus two columns with different
C∗
liq/C
η,∗
SP2, low are given in Table 1. In the cases of AQ and Fullerene Soot only the AQ
and Fullerene Soot internal calibration were applied, respectively. The BC content of AQ (71 % BC) was accounted for in the AQ internal calibration applied to obtain the values in the first data column of Table 1. The BC content was also accounted for the
20
calculation ofC∗liq for the AQ standards in order to treat it consistently (see Sect. S.4). Fullerene Soot standards were analyzed one year after the AQ, Aquablack, Cabojet, and Flame Soot standards. AQ standards analyzed at the same time as Fullerene Soot indicated a shift with time in the losses (εloss(D), Eq. S9) occurring in the CETAC
nebulizer. TheCliq∗ /CηSP2, low,∗ reported for Fullerene Soot in Table 1 is adjusted based
25
AMTD
7, 3075–3111, 2014Optimized method for BC analysis
I. A. Wendl et al.
Title Page
Abstract Introduction
Conclusions References
Tables Figures
◭ ◮
◭ ◮
Back Close
Full Screen / Esc
Printer-friendly Version Interactive Discussion
Discussion
P
a
per
|
D
iscussion
P
a
per
|
Discussion
P
a
per
|
Discuss
ion
P
a
per
|
The values reported in Table 1 reveal that the external calibration factor of the CETAC determined with different standards spans a range of more than a factor of two. Conse-quently, the BC mass concentrations determined for an unknown aqueous BC sample with using the nebulizer/SP2-setup and the external calibration approach are potentially associated with large uncertainties. The reasons for this spread arise e.g. from SP2
cal-5
ibration uncertainties, detection range limitations of the SP2 and the size-dependence of nebulizer losses (quantified bykS2/f∗
bias in Eq. S44 in the Supplement which is
es-sentially equal to Eq. 3). Uncertainties in standard preparation, i.e. inC∗liq, also con-tribute though the exact share remains unknown lacking a method to independently determine the trueC∗
liq.
10
The sensitivity of the SP2 to the BC-type in Aquablack, Cabojet and Flame Soot is unknown, introducing a difference of a factor of ∼1.8 between possible external cali-bration values, assuming the extremes of SP2 sensitivity are represented by Fullerene Soot and AQ accounted for the non-BC fraction. Therefore, Aquablack, Cabojet and Flame Soot are not recommended as calibration standard.
15
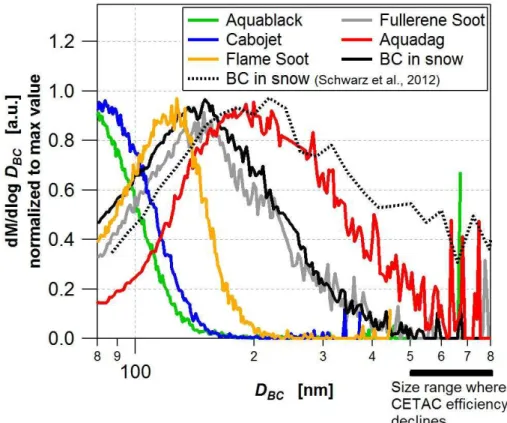
Even if the SP2 sensitivity was known, Aquablack and Cabojet remain unsuitable for external calibration as∼50 % or more of the BC mass is associated with BC core
sizes below the lower detection limit of the SP2 (Fig. 3). This results in underestima-tion ofCηSP2, low,∗ , overestimation of the external calibration factor and thus also the BC concentration that would be inferred for an unknown sample by using Eq. (4).
20
For both AQ and Fullerene Soot the SP2 sensitivity is known and the dominant frac-tion of their mass size distribufrac-tions lies between the upper and lower detecfrac-tion limit of the SP2 in terms of BC core size. Despite that, the external calibration factor deter-mined for the CETAC is∼70 % smaller for the Fullerene Soot compared to the AQ stan-dard. This difference is mainly caused by the strong size-dependence of the CETAC
25
nebulizer efficiency with a sharp drop above∼500 nm. AQ has a larger contribution of
AMTD
7, 3075–3111, 2014Optimized method for BC analysis
I. A. Wendl et al.
Title Page
Abstract Introduction
Conclusions References
Tables Figures
◭ ◮
◭ ◮
Back Close
Full Screen / Esc
Printer-friendly Version Interactive Discussion
Discussion
P
a
per
|
D
iscussion
P
a
per
|
Discussion
P
a
per
|
Discuss
ion
P
a
per
|
distribution of the standard as a weighting function (see Eq. S74), becomes larger for AQ. This influence of the shape of the BC mass size distribution of the standard disap-pears for a nebulizer with a size-independent efficiency such as the APEX-Q, thereby strongly reducing the uncertainties associated with the external calibration approach. If a nebulizer with a strongly size-dependent efficiency such as the CETAC is used, it
5
is important to choose a standard which best matches the shape of the BC mass size distribution of the sample, in order to minimize the uncertainties associated with size effects. This can be sometimes AQ and sometimes Fullerene Soot (Fig. 3). One advan-tage of AQ is that it does not exhibit any batch-to-batch variability of the corresponding internal SP2 calibration curves like Fullerene Soot (Gysel et al., 2011; Laborde et al.,
10
2012).
We chose AQ to prepare the aqueous BC standards because (1) its mass equivalent diameter distribution falls almost entirely into the detection range of the SP2 (∼70–
700 nm), (2) besides Fullerene Soot, AQ is the only standard which extends to BC diameters above∼200 nm as is expected in snow and ice samples (Fig. 3), and (3) it
15
is easy to weigh, suspend and dilute.
3.3 Repeatability of external calibration
The external calibration of the nebulizer efficiency is crucial when quantifying the BC mass concentration in a liquid sample by measurement of BC in the nebulized aerosol. We determined the repeatability of the external calibration by analyzing freshly
pre-20
pared AQ standards from two different concentrated 2500 µg L−1 stocks over a period of two months with using both the CETAC/SP2- and APEX-Q/SP2-setups. The repro-ducibility was within∼19 %. This includes the uncertainty in concentrations of the stock
and the diluted standards, and the uncertainty of the whole nebulizer/SP2-setup. These tests also revealed that the 2500 µg L−1 stocks remained stable over the whole two
25
AMTD
7, 3075–3111, 2014Optimized method for BC analysis
I. A. Wendl et al.
Title Page
Abstract Introduction
Conclusions References
Tables Figures
◭ ◮
◭ ◮
Back Close
Full Screen / Esc
Printer-friendly Version Interactive Discussion
Discussion
P
a
per
|
D
iscussion
P
a
per
|
Discussion
P
a
per
|
Discuss
ion
P
a
per
|
Importantly, the SP2 response to AQ scaled linearly with concentration for both systems. The external calibration factorC∗liq/CSP2, lowη,∗ for approach 2 applied with the CETAC, was determined from the slope of the regression line throughCliq∗ vs.CηSP2, low,∗
each time a dilution series was measured (and likewiseC∗
liq/c
∗
SP2 for approach 1 with
the APEX-Q). These “averaged” external calibration factors of each dilution series
var-5
ied in the two months by∼22 % for the CETAC and by∼8 % for the APEX-Q. Addition-ally, environmental snow samples from Blewett Pass, WA, USA, and Ewigschneefeld, Switzerland, were used to track the stability of the CETAC/SP2-setup at CWU to iden-tify whether variations in the AQ external calibration factors from day to day were due to changes in nebulizer efficiency and/or SP2 response or errors in gravimetric AQ
stan-10
dard preparation. It is not known why the variability of AQ calibration curve slopes is higher for the CETAC than the APEX-Q, but the liquid BC mass concentration of the en-vironmental snow samples varied less than the AQ standards (<9 %, 2.56±0.21 µg L−1 for Blewett snow and 1.03±0.09 µg L−1for Ewigschneefeld snow), indicating that some
portion of the 22 % calibration variability may be due to errors in AQ standard
produc-15
tion rather than variability in the CETAC/SP2-setup. SP2 users are therefore advised to use a combination of AQ and environmental snow standards and perform a calibra-tion at least once per week. For the APEX-Q/SP2-setup a weekly calibracalibra-tion with AQ seems sufficient.
Blank values for the CETAC/SP2-setup are 0.01±0.01 µg L−1 for ultrapure
wa-20
ter and 0.03±0.01 µg L−1 for ultrapure ice, prepared with the same cutting process as the ice core samples. The corresponding blanks for the APEX-Q/SP2-setup are 0.07±0.07 µg L−1and 0.10±0.01 µg L−1for ultrapure ice, respectively.
The calibration factors discussed in this section are unique to each nebulizer/SP2-setup, and may shift over time due to changes in the nebulizer efficiency. As such, the
25
relationship betweenCηSP2, loworcSP2andC∗
liqmust be monitored regularly. For
AMTD
7, 3075–3111, 2014Optimized method for BC analysis
I. A. Wendl et al.
Title Page
Abstract Introduction
Conclusions References
Tables Figures
◭ ◮
◭ ◮
Back Close
Full Screen / Esc
Printer-friendly Version Interactive Discussion
Discussion
P
a
per
|
D
iscussion
P
a
per
|
Discussion
P
a
per
|
Discuss
ion
P
a
per
|
3.4 Sample treatment
3.4.1 Treatment of fresh samples
In order to optimize the BC analysis with the SP2 several methods of sample treatment were tested, keeping all other parameters, e.g. liquid and air flows as well as pressure, stable. The results shown are applicable to freshly melted or prepared discrete samples
5
and may not be relevant for continuous flow systems. The gains or losses in signal reported below are always relative to the signal without treatment.
First, we tested different vial materials including glass, PFA, PP, Nalgene®-PP and high density polyethylene (PE-HD). Dilution series of the AQ standard were created in each type of material using the same material from the high concentration stock to the
10
lowest AQ standard (0.5 µg L−1). Each stock was sonicated for 20 min before dilution. The diluted AQ standards were then sonicated again for 25 min directly prior to anal-ysis. Both standard creation and analysis was done within one day. The different vial materials resulted in <10 % variability. The CETAC did not nebulize liquids that had been sonicated in PFA vials. So far, we do not understand this effect. Maybe a change
15
of surface tension of the sample in the PFA vial hinders the sample from being nebu-lized with the ultrasonic membrane.
Second, we investigated the effect of stirring AQ standards as well as snow and ice core samples during the measurement with a magnetic stir bar. Stirring is assumed to result in more representative sampling because it hampers settling. The ice core
20
samples originate from Svalbard and Mongolia, and each location provided a sample with a high (92.9 and 425.9 µg L−1) and a low (24.5 and 157 µg L−1) calcium concentra-tion, representing two extremes of mineral dust content. Nevertheless, the dust was not visible by eye in any sample. The results of agitating the samples were inconclusive, although previous results recommended the use of a stir bar, especially for samples
25
AMTD
7, 3075–3111, 2014Optimized method for BC analysis
I. A. Wendl et al.
Title Page
Abstract Introduction
Conclusions References
Tables Figures
◭ ◮
◭ ◮
Back Close
Full Screen / Esc
Printer-friendly Version Interactive Discussion
Discussion
P
a
per
|
D
iscussion
P
a
per
|
Discussion
P
a
per
|
Discuss
ion
P
a
per
|
Third, we tested the same samples for the effect of sonication prior to analysis by varying the sonication time from 0 to 50 min. Sonication can break down agglomerates which might cause interferences in the SP2. The results showed that 25 min sonication increases the BC mass concentration insignificantly (∼5±22 %), and that sonication
for different amounts of time gave inconclusive results.
5
Fourth, we examined the effect of a combination of stirring and sonication with the same samples as above. A∼15±21 % increase in the measured BC mass
concentra-tion indicates the optimal treatment to be the combinaconcentra-tion of sonicaconcentra-tion for 25 min and stirring.
Fifth, we investigated the effect of acidification of the samples to 0.5 M with
10
65 % suprapur nitric acid (HNO3) as proposed by Kaspari et al. (2011). This effect may depend on the sample composition, as indicated by varying results with AQ stan-dards and snow and ice samples. Since precise sample composition is not known for snow or ice samples and acidification causes∼22±14 % lower measured BC mass
concentrations, we do not advise acidification.
15
These results indicate that the vial material used for fresh samples may be chosen by practicability. We use PP vials that are (1) easy to handle in the cold room, (2) large enough to hold the obtained ice samples, (3) lighter and safer in the field than glass, and (4) at low cost, which is important especially if sampling at high resolution. Since all tests beside that of the sonication for different time periods include 25 min sonication
20
(Kaspari et al., 2011, suggested 15 min), we recommend sonicating the samples for 25 min plus stirring of the samples with a magnetic stir bar during sample analysis.
3.4.2 Sample storage
Repeated measurements of previously melted snow samples indicate that the BC con-centration of samples stored in the liquid phase are not stable over time. We assessed
25
AMTD
7, 3075–3111, 2014Optimized method for BC analysis
I. A. Wendl et al.
Title Page
Abstract Introduction
Conclusions References
Tables Figures
◭ ◮
◭ ◮
Back Close
Full Screen / Esc
Printer-friendly Version Interactive Discussion
Discussion
P
a
per
|
D
iscussion
P
a
per
|
Discussion
P
a
per
|
Discuss
ion
P
a
per
|
samples or samples from remote locations that melted during retrieval. Furthermore, it is preferable to store BC standards created in the liquid phase for repeat use if they remain stable.
Liquid suspensions of the BC-like materials AQ, Aquablack, Cabojet and Flame Soot as well as environmental snow samples were stored in PP and glass vials at 25◦C and
5
2◦C. The liquid BC mass concentration of the samples was measured immediately after standard creation or melting the snow, respectively, using the CETAC/SP2-setup. The concentrations were monitored for 18 days. Samples stored in glass vials at 2◦C showed no significant losses, whereas samples stored in PP vials at 25◦C showed the highest losses of 30–80 %. Samples stored in glass vials at 25◦C and PP vials at
10
2◦C experienced variable BC losses (0–20 %). These results were consistent for all BC reference materials as well as the snow samples (see Appendix C for data and details). We assume that BC losses in aqueous samples are due to particles adhering to vial walls or agglomerating to larger sizes outside of the SP2 detection range.
Melted ice core samples are often refrozen for preservation after the first
measure-15
ment. Aqueous samples of snow were refrozen to see if this procedure affects BC stability during storage. Refreezing and thawing snow samples after the first melt re-sulted in BC losses up to 60 %. A second freeze–thaw cycle rere-sulted in further losses of the same magnitude. Losses from refreezing may be due to the agglomeration of BC particles to larger sizes not entering the system or not detectable by the SP2 when the
20
particles are rejected by the matrix of ice crystals (Schwarz et al., 2013). However, like Schwarz et al. (2012), we did not observe significant shifts in the mass size distribution of samples that underwent freeze–thaw cycles.
We also tested whether acidification affected sample stability during storage. We acidified snow samples and samples of AQ of∼4,∼10, and∼24 µg L−1BC to 0.5 M
25
AMTD
7, 3075–3111, 2014Optimized method for BC analysis
I. A. Wendl et al.
Title Page
Abstract Introduction
Conclusions References
Tables Figures
◭ ◮
◭ ◮
Back Close
Full Screen / Esc
Printer-friendly Version Interactive Discussion
Discussion
P
a
per
|
D
iscussion
P
a
per
|
Discussion
P
a
per
|
Discuss
ion
P
a
per
|
losses when those samples were stored in the liquid phase. Additionally, acidification caused immediate losses of up to∼35 % in all of our AQ samples.
Overall, we advise keeping snow and ice samples frozen until prior to BC analy-sis with the SP2. If this cannot be fulfilled, samples should be stored in glass vials at cold temperature (∼2◦C), though monitoring samples for longer than 18 days
(multi-5
ple months) suggests that losses might still occur under these conditions (results not shown). Thus measurements of samples stored in the liquid phase may underestimate the actual BC mass concentration. Samples should further not be refrozen or acidified since these procedures lead to BC losses.
3.4.3 Recovery of BC in stored samples 10
We tested whether the BC mass concentration of samples could be recovered after undergoing losses in storage. Samples that had experienced BC losses during storage were treated with (1) acid (HNO3) and (2) a dispersing agent (sodium pyrophosphate
decahydrate). Kaspari et al. (2011) suggested acidifying samples in order to recover BC lost during refreezing, but our results point against acidification. Sixteen samples
15
were acidified to 0.5 M with 65 % suprapur HNO3, of which six responded with between
10 to 100 % recovery of the lost BC, and ten samples showed no recovery or further losses of 10–40 %. We observed that all samples for which acidification caused some BC recovery were stored in PP vials, whereas samples stored in glass vials showed no recovery or even further losses. Since vial-type seems to affect the amount of BC that
20
could be recovered after acidification, we suspect that the addition of HNO3 helped to desorb BC from the walls of the PP vials. Schwarz et al. (2012) noted a shift to-wards smaller particle sizes after acidification, and surmised that acid helped to break up agglomerated particles. We did not observe any significant shift in the particle size distributions of samples after acidification. No distinct difference in BC recovery after
25
AMTD
7, 3075–3111, 2014Optimized method for BC analysis
I. A. Wendl et al.
Title Page
Abstract Introduction
Conclusions References
Tables Figures
◭ ◮
◭ ◮
Back Close
Full Screen / Esc
Printer-friendly Version Interactive Discussion
Discussion
P
a
per
|
D
iscussion
P
a
per
|
Discussion
P
a
per
|
Discuss
ion
P
a
per
|
As for fresh samples, we do not recommend acidification of stored samples or stan-dards prior to BC analysis due to the variable effects of acidification on BC concen-tration seen in this study and the shift in particle size distribution observed by others (Schwarz et al., 2012). Similar to acid, treatment with the dispersing agent yielded vary-ing results with BC recovery in some samples and further BC losses in others. Thus
5
we do not recommend the use of a dispersing agent to treat fresh or stored samples.
4 Summary
We compared three different nebulizer/SP2-setups to optimize the method for mea-suring BC in discrete aqueous, namely snow and ice, samples using a SP2. Both the jet (APEX-Q) and ultrasonic (CETAC) nebulizer were found to be suitable for ice
10
core analysis because they require small sample volumes of a few milliliters, whereas the Collison-type requires more than 50 mL sample. The nebulizing efficiency in the BC particle diameter range expected in snow and ice samples (100–1000 nm) is least size-dependent for the APEX-Q. However, the air and liquid flows can only be mon-itored continuously with the CETAC. For all nebulizer-types we recommend an
exter-15
nal calibration with BC standards for the determination of the BC mass concentration in unknown aqueous samples. The choice of the BC-like standard material is crucial since it was found to potentially introduce large uncertainties to the determination of the BC mass concentrations of an unknown aqueous BC sample. Aquablack, Cabo-jet and Flame Soot are not recommended as external calibration standards because
20
the sensitivity of the SP2 to their BC-type is not known, thus introducing a difference of a factor of∼1.8 between possible external calibration values. Furthermore, ∼50 %
or more of the BC mass in Aquablack and Cabojet is associated with BC core sizes below the lower detection limit of the SP2 which results in an overestimation of the BC concentration in the analyzed sample. The SP2 sensitivity to AQ and Fullerene Soot is
25
AMTD
7, 3075–3111, 2014Optimized method for BC analysis
I. A. Wendl et al.
Title Page
Abstract Introduction
Conclusions References
Tables Figures
◭ ◮
◭ ◮
Back Close
Full Screen / Esc
Printer-friendly Version Interactive Discussion
Discussion
P
a
per
|
D
iscussion
P
a
per
|
Discussion
P
a
per
|
Discuss
ion
P
a
per
|
Fullerene Soot can be used for external calibration. If a nebulizer with a strongly size-dependent efficiency such as the CETAC is used, it is in some cases better to use AQ and in other better to use Fullerene Soot, depending on which standard best matches the shape of the BC mass size distribution of the sample. We chose AQ to prepare the aqueous BC standards because (1) it does not exhibit any batch-to-batch variability
5
of the corresponding internal SP2 calibration curves like Fullerene Soot (Gysel et al., 2011; Laborde et al., 2012), and (2) it is easy to weigh, suspend and dilute.
We further investigated different treatments for fresh discrete snow and ice samples, the effect of sample storage and the best method to recover BC in stored samples. The samples can be kept in PP vials which are easy to handle and at low cost. Prior to
10
analysis the samples should be sonicated for 25 min and then immediately be analyzed while being stirred with a magnetic stir bar. Acidification is not recommended. The samples should best stay frozen until just prior to analysis. If this cannot be fulfilled, the samples are best kept in glass vials at cold temperature (∼2◦C), although this might
lead to BC losses. Refreezing or acidifying samples that need to be stored should be
15
avoided. Further, the recovery of BC in stored samples cannot be improved by the use of acid or a dispersing agent.
Appendix A
Instrumental setup
Figure A1 displays the instrumental setup of the three different nebulizer/SP2-systems.
20
Appendix B
BC standards
AMTD
7, 3075–3111, 2014Optimized method for BC analysis
I. A. Wendl et al.
Title Page
Abstract Introduction
Conclusions References
Tables Figures
◭ ◮
◭ ◮
Back Close
Full Screen / Esc
Printer-friendly Version Interactive Discussion
Discussion
P
a
per
|
D
iscussion
P
a
per
|
Discussion
P
a
per
|
Discuss
ion
P
a
per
|
Appendix C
Sample storage
Here we present in greater detail the results of the storage experiments discussed in the main text. Note that those storage tests were conducted with the CETAC/SP2-setup, so were subject to the nebulizer efficiency issues described in Sect. 3.1.1.
5
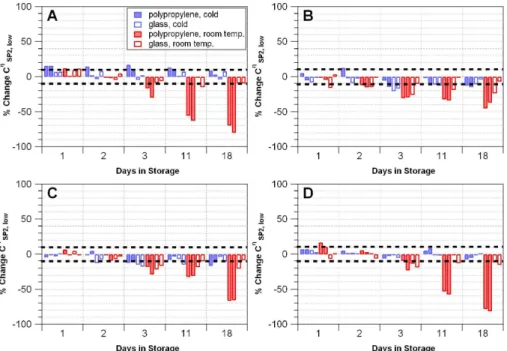
Samples were stored in polypropylene (PP) and glass vials at 25◦C and 2◦C and monitored over time. Teflon vials were not used in the experiment because samples stored in Teflon vials did not nebulize properly after sonication. Sample stability for AQ and environmental snow samples over an 18 day period suggests that storing samples at 25◦C in PP vials results in substantial BC losses compared to storage in glass
10
vials or storage at cold temperature (Fig. C1). Samples stored in glass vials at cold temperatures remained nearly stable for 18 days.
In addition, these experiments indicate that the magnitude of BC losses in stor-age may be related to sample concentration. After 18 days, AQ samples stored in PP vials at 25◦C showed 80 %, 65 %, and 40 % losses for low concentration (∼2 µg L−1),
15
medium concentration (∼8 µg L−1), and high concentration (∼14 µg L−1) samples, re-spectively (Fig. C1). This result would imply that the magnitude of losses is higher for low concentration samples compared to high concentration samples, but we cau-tion that the total BC mass lost in the low concentracau-tion samples (∼1 µg L−1 equiva-lent) is less than the mass of BC lost in the medium and high concentration samples
20
(∼3 µg L−1 equivalent). It seems that while BC losses may be proportionally higher for
low concentration samples, total BC mass lost in storage is greater in samples that are more concentrated. This would imply that relative differences between samples may appear smaller than they actually are if the samples have undergone BC losses in storage.
AMTD
7, 3075–3111, 2014Optimized method for BC analysis
I. A. Wendl et al.
Title Page
Abstract Introduction
Conclusions References
Tables Figures
◭ ◮
◭ ◮
Back Close
Full Screen / Esc
Printer-friendly Version Interactive Discussion
Discussion
P
a
per
|
D
iscussion
P
a
per
|
Discussion
P
a
per
|
Discuss
ion
P
a
per
|
Supplementary material related to this article is available online at http://www.atmos-meas-tech-discuss.net/7/3075/2014/
amtd-7-3075-2014-supplement.pdf.
Acknowledgements. The authors would like to thank J. P. Schwarz for providing a batch of Fullerene Soot and PSLs from Polyscience Inc., Warrington, PA, USA, and T. Kirchstetter for
5
providing a batch of Flame Soot.
References
Baumgardner, D., Popovicheva, O., Allan, J., Bernardoni, V., Cao, J., Cavalli, F., Cozic, J., Di-apouli, E., Eleftheriadis, K., Genberg, P. J., Gonzalez, C., Gysel, M., John, A., Kirchstet-ter, T. W., Kuhlbusch, T. A. J., Laborde, M., Lack, D., Müller, T., Niessner, R., Petzold, A.,
Piaz-10
zalunga, A., Putaud, J. P., Schwarz, J., Sheridan, P., Subramanian, R., Swietlicki, E., Valli, G., Vecchi, R., and Viana, M.: Soot reference materials for instrument calibration and intercom-parisons: a workshop summary with recommendations, Atmos. Meas. Tech., 5, 1869–1887, doi:10.5194/amt-5-1869-2012, 2012.
Bisiaux, M. M., Edwards, R., McConnell, J. R., Albert, M. R., Anschütz, H., Neumann, T. A.,
15
Isaksson, E., and Penner, J. E.: Variability of black carbon deposition to the East Antarctic Plateau, 1800–2000 AD, Atmos. Chem. Phys., 12, 3799–3808, doi:10.5194/acp-12-3799-2012, 2012a.
Bisiaux, M. M., Edwards, R., McConnell, J. R., Curran, M. A. J., Van Ommen, T. D., Smith, A. M., Neumann, T. A., Pasteris, D. R., Penner, J. E., and Taylor, K.: Changes in black carbon
20
deposition to Antarctica from two high-resolution ice core records, 1850–2000 AD, Atmos. Chem. Phys., 12, 4107–4115, doi:10.5194/acp-12-4107-2012, 2012b.
Bond, T. C., Doherty, S. J., Fahey, D. W., Forster, P. M., Berntsen, T., DeAngelo, B. J., Flan-ner, M. G., Ghan, S., Kärcher, B., Koch, D., Kinne, S., Kondo, Y., Quinn, P. K., Sarofim, M. C., Schultz, M. G., Schulz, M., Venkataraman, C., Zhang, H., Zhang, S., Bellouin, N.,
Gut-25
AMTD
7, 3075–3111, 2014Optimized method for BC analysis
I. A. Wendl et al.
Title Page
Abstract Introduction
Conclusions References
Tables Figures
◭ ◮
◭ ◮
Back Close
Full Screen / Esc
Printer-friendly Version Interactive Discussion
Discussion
P
a
per
|
D
iscussion
P
a
per
|
Discussion
P
a
per
|
Discuss
ion
P
a
per
|
role of black carbon in the climate system: a scientific assessment, J. Geophys. Res.-Atmos., 118, 5380–5552, doi:10.1002/jgrd.50171, 2013.
Clarke, A. D. and Noone, K. J.: Soot in the Arctic snowpack: a cause for perturbations in radia-tive transfer, Atmos. Environ., 19, 2045–2053, 1985.
Cross, E. S., Onasch, T. B., Ahern, A., Wrobel, W., Slowik, J. G., Olfert, J., Lack, D. A.,
Mas-5
soli, P., Cappa, C. D., Schwarz, J. P., Spackman, J. R., Fahey, D. W., Sedlacek, A., Trimborn, A., Jayne, J. T., Freedman, A., Williams, L. R., Ng, N. L., Mazzoleni, C., Dubey, M., Brem, B., Kok, G., Subramanian, R., Freitag, S., Clarke, A., Thornhill, D., Marr, L. C., Kolb, C. E., Worsnop, D. R., and Davidovits, P.: Soot particle studies – instrument inter-comparison – project overview, Aerosol Sci. Tech., 44, 592–611, 2010.
10
Dou, T., Xiao, C., Shindell, D. T., Liu, J., Eleftheriadis, K., Ming, J., and Qin, D.: The distribution of snow black carbon observed in the Arctic and compared to the GISS-PUCCINI model, Atmos. Chem. Phys., 12, 7995–8007, doi:10.5194/acp-12-7995-2012, 2012.
Elemental Scientific Inc.: Apex Q High Sensitivity Sample Introduction System, Product Overview, available at: http://www.icpms.com/pdf/ApexQ-ESI.pdf (last access: 10
Decem-15
ber 2013), 2013.
Flanner, M. G., Zender, C. S., Randerson, J. T., and Rasch, P. J.: Present-day climate forc-ing and response from black carbon in snow, J. Geophys. Res.-Atmos., 112, D11202, doi:10.1029/2006JD008003, 2007.
Gysel, M., Laborde, M., Olfert, J. S., Subramanian, R., and Gröhn, A. J.: Effective density
20
of Aquadag and fullerene soot black carbon reference materials used for SP2 calibration, Atmos. Meas. Tech., 4, 2851–2858, doi:10.5194/amt-4-2851-2011, 2011.
Kaspari, S. D., Schwikowski, M., Gysel, M., Flanner, M. G., Kang, S., Hou, S., and Mayewski, P. A.: Recent increase in black carbon concentrations from a Mt. Everest ice core spanning 1860–2000 AD, Geophys. Res. Lett., 38, L04703, doi:10.1029/2010GL046096,
25
2011.
Kirchstetter, T. W. and Novakov, T.: Controlled generation of black carbon particles from a dif-fusion flame and applications in evaluating black carbon measurement methods, Atmos. En-viron., 41, 1874–1888, 2007.
Laborde, M., Mertes, P., Zieger, P., Dommen, J., Baltensperger, U., and Gysel, M.: Sensitivity
30