SPATIAL VARIABILITY OF SOIL HYDRAULIC
PROPERTIES ON A STEEP SLOPE IN THE LOESS
PLATEAU OF CHINA
Wei Hu1,2,3; Ming An Shao2*; Quan Jiu Wang2; Jun Fan2 ; Klaus Reichardt4
1
Key Laboratory of Water Cycle and Related Surface Processes, Institute of Geographical Sciences and Natural resources Research, Chinese Academy of Sciences, Beijing 100101, China.
2
State Key Laboratory of Soil Erosion and Dryland Farming on the Loess Plateau, Institute of Soil and Water Conservation, Chinese Academy of Sciences & Ministry of Water Resource, Northwest A & F University, Yangling 712100, Shaanxi, China.
3
Graduate School of the Chinese Academy of Sciences, Beijing 100039, China. 4
USP/CENA - Lab. de Física do Solo, C.P. 96 - 13418-900, Piracicaba, SP - Brasil. *Corresponding author <mashao@ms.iswc.ac.cn>
ABSTRACT: The understanding of the structure of the spatial variability of soil surface hydraulic properties on steep slopes is important for modeling infiltration and runoff processes. The objective of this study was to investigate the spatial variability of these properties on a steep slope of the Loess Plateau in northwest China. A 9600 m2 area was systematically sampled in a grid of 106 points spaced 10 m × 10 m. Hydraulic properties were determined with a disc infiltrometer under multiple pressure heads (-15, -9, -6, -3, 0 cm) at each sample point. Classical and geo-statistical methods were used for data analysis. The results indicated that the variation of Gardner’s α and hydraulic conductivities at all applied pressure heads was moderate and the heterogeneity for hydraulic conductivities increased as the applied pressure head increased. Along the slope, hydraulic conductivities generally decreased downwards, while the Gardner’s α fluctuated slightly. The Gardner’s α of the shaded aspect of the slope was greater than that of the sunny aspect. The hydraulic conductivities of the shaded aspect were greater at higher pressure heads as compared to the sunny aspect, but lower than those of the sunny aspect at lower pressure heads. Correlation analysis showed a negative correlation between hydraulic conductivity and soil organic matter and clay (<0.01 mm) contents. Hydraulic conductivities at pressure heads of -3, -6, -9, -15 cm varied across the slope and their spatial dependence increased as the pressure head declined. The heterogeneity and spatial dependence of hydraulic properties were larger for the areas with shaded aspect as compared to the sunny aspect, however, as pressure decreased they showed a progressively increasing spatial structure, and their spatial structure behaved increasingly similar in both the shaded and sunny aspects.
Key words: disc infiltrometer, steep sloping land, pressure head, spatial structure
VARIABILIDADE ESPACIAL DE PROPRIEDADES HÍDRICAS
DO SOLO DE UMA ENCOSTA DO “LOESS PLATEAU” DA CHINA
hidráulicas sob cargas de -3, -6, -9, -15 cm variaram em toda encosta e suas dependências espaciais aumentaram à medida que a carga diminuía. A heterogeneidade e a dependência espacial das propriedades hídricas foram maiores para as áreas em encostas sombreadas em comparação com as encostas ensolaradas, entretanto, à medida que a carga hidráulica decrescia, elas apresentaram progressivamente uma estrutura especial mais intensa, e esta estrutura se comportou cada vez mais similar para as encostas sombreadas e ensolaradas.
Palavras-chave: infiltrômetro de disco, encosta íngreme, carga hidráulica, estrutura espacial
INTRODUCTION
Field measurements of soil hydraulic proper-ties such as soil hydraulic conductivity versus pres-sure head relationships and pore size distribution pa-rameters, such as Gardner’s α, are important for the characterization of many aspects of unsaturated soil water flow processes (Bagarello et al., 2005). Recently, several (Mohanty et al., 1994; Logsdon & Jaynes, 1996) have investigated the spatial variability of soil hydraulic properties, however, most studies have fo-cused on leveled or gently sloping land. Few, if any, studies have spatially analyzed hydraulic conductivity on steep slopes. Furthermore, previous studies have mainly focused on the influence of human activities, i.e. planting (Mohanty et al., 1994), and wheeling (Heddadj & Gascuel-Odoux, 1999) on the variation of hydraulic properties. In contrast, natural factors such as topography, vegetation, and soil texture may have a more significant effect on steep slopes where hu-man activity is relatively low.
The disc infiltrometer, for its suitability not only in saturated but also in unsaturated conditions as well as its water-saving and easiness to move, has been widely used to investigate the spatial variability of hy-draulic properties under near-saturated conditions (Mohanty et al., 1994; Logsdon & Jaynes, 1996). A large number of techniques are available for treating infiltration data collected from disc infiltrometers (White & Sully, 1987; Smettem & Clothier, 1989; Ankeny et al., 1991). Among those, multi-tensions with nonlinear regression gave fast and stable results, and did not give any negative values as verified by Logsdon et al. (1993)
Steeply sloping land is one of the main forms of land surface on the Loess Plateau in northwest China, on which soil erosion and nutrient loss can eas-ily take place as a result of the high energy level of the fast water flow on this steep surface.
In this study, a disc infiltrometer was used to validate its potential to characterize soil hydraulic prop-erties on a steep slope using the Loess Plateau as a sampling area. The spatial variability of hydraulic prop-erties, including hydraulic conductivities under various pressure heads and pore size distribution (Gardner’s α) on steeply sloping were analyzed, in particular three
aspects: (1) factors influencing hydraulic conductiv-ity, including soil organic matter and clay contents, (2) differences among pressure heads in terms of their magnitude and spatial structure in relation to the satu-rated hydraulic conductivity, and (3) differences in hydraulic conductivity between the shaded and sunny aspects in terms of their magnitude and spatial struc-ture.
MATERIAL AND METHODS
Field site description
The study was conducted at the Beigeba hillslope of the Liudaogou watershed located in the Shenmu County, Shaanxi Province, China (110º21' E to 110º23' E; 38º46' N to 38º51' N). The Ust-Sandiic Entisol is loess-derived and of easy erosion. As a re-sult, the region is characterized by steep gullies and hills (Tang et al., 1993). The slope used in this study had a length of 280 m and runs generally downward from east to west. Disc infiltration tests were carried out on the lower 160 m of the slope, over which purple medic (Medicago sativa L.) of 30 years of age is
be-ing converted to couch grass as the dominant vegeta-tion. More information about this area can be found in Hu et al. (2008).
Sampling and measurement
A total of 106 points was selected at the lower part of the slope, located at the intersections of seven sampling columns and seventeen sampling rows in two perpendicular directions, covering a total area of 60
m × 160 m. At each sampling location, a disc
infiltrometer (50 mm radius with a reservoir tube of radius of 1.7 cm) was used to determine the water infiltration rate under different pressure heads at soil surface, in the ascending sequence (-15, -9, -6, -3, 0 cm). Cumulative infiltration was recorded every minute until steady infiltration was nearly reached.
ana-lyzer produced by Malvern. Physical clay (<0.01 mm) content was calculated based on the result of particle size distribution.
Infiltration data analysis
Non-linear regression methods were used to determine the hydraulic properties of the soil at each location, for the used multiple pressure heads (Logsdon & Jaynes, 1993). The main advantage of the method of the infiltrometer is that the hydraulic parameters have to be acquired only under steady infiltration rate, and it does not need neither initial nor final soil water contents, and does also not need the relationship of the accumulative infiltration with time. This method is mainly based on Wooding’s analytical solution (Wood-ing, 1968) and Gardner’s exponential model (Gardner, 1958). Assuming that the hydraulic conductivity un-der initial conditions is small enough to satisfy the con-dition of Kwet >>Kdry, under a given applied pressure,
Wooding’s equation can be expressed as:
Q(hf ) = πR2 K(hf ) + 4R φ(hf ) (1)
where Q(hf) is the steady infiltration rate (L3 T-1), R is the radius of the disc infiltrometer (L), K(hf ) is the hy-draulic conductivity at the applied pressure head hf, and
φ(hf ) is the matrix flux potential (L2 T-1).
Gardner’ exponent function can be written as:
K(hf ) = K(h0 ) exp(αh) (2)
where α is a constant which characterizes the soil pore size distribution (L-1), and
K(h0 ) is the saturated hy-draulic conductivity (L T-1). Combining Equation (1)
with (2) gives
Q(hf ) / (πR2) = K(h0 ) exp(αh) + 4K(h0 ) exp(αh) /
(πRa) (3)
with two unknowns, α and K (h0).
According to Equation (3), with steady infil-tration rates under different applied pressure heads, α and K(h0) can be obtained by non-linear regression.
Therefore, a series of disk infiltration tests were con-ducted with an ascending sequence of pressure heads -15, -9, -6, -3, 0 cm. In this way, αand K(h0) can be
obtained fitting Q(hf) vs h infiltration data. After
remov-ing results which failed the statistical significance test, 99 results of α and K(h0) were available to be applied to Equation (2), which lead to hydraulic conductivi-ties at the pressure different heads. For the purposes of this presentation the hydraulic conductivities at pressure heads of -15, -9, -6, -3, 0 cm will be ex-pressed as K15, K9, K6, K3, Ks, respectively.
Spatial analysis approach
Classical and geo-statistical analyses were
com-bined in this study to characterize spatial variability of the hydraulic properties. The coefficient of variation (CV%) can be used to qualitatively ascertain the mag-nitude of the spatial variability as weak when CV% ≤
10%, moderate if 10% < CV% < 100%, and strong
for CV% ≥ 100%. When geo-statistical methods are
used, the magnitude of variation and spatial structure
can be better determined quantitatively.Based on the
regionalized variables theory and intrinsic hypothesis,
a semi-variogram, γ (h), of n spatial observations
z (xi ), i =1, n = 1, ...n can be expressed as
( )
2
1
( ) 1/(2 ( )) [ ( ) ( )]
N h
i i
i
h N h z x z x h
γ
=
=
∑
− + (4)where N(h) is the number of pairs of observations
separated by a distance h (Grego et al., 2006).
Theo-retical semi-variogram models were employed to fit the semi-variance and generate geo-statistical parameters, including nugget variance (C0), sill variance (C0 +C1),
and range (R).
The degree of spatial dependence (GD) was
calculated as:
GD = [C0 / (C0 +C1)] × 100 (5)
The GD represent the spatial randomness and
can be used to classify the spatial dependence as strong if GD < 25%, moderate for GD ranging from 26% to
75%, and weak if GD > 75% (Cambardella et al.,
1994).
RESULTS AND DISCUSSION
Classical statistical analysis
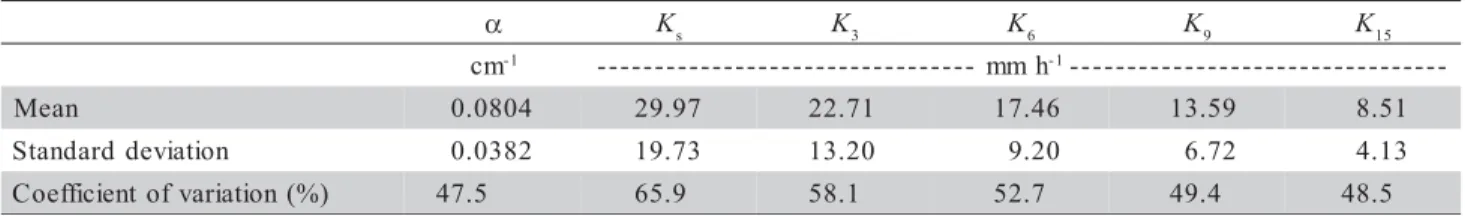
Summary statistics for the entire study area -Most filed measured hydraulic parameters have shown to be log-normally distributed (Sisson et al., 1981; Mallants et al., 1997). In this study, the statistical fre-quency distributions for all hydraulic parameters con-form either to normal or to log-normal distributions as judged by Q-Q plots (data not shown), in agreement with Gimenez et al. (1999). Therefore, no data trans-formation was performed before analysis. The classi-cal statisticlassi-cal properties of the hydraulic parameters (Table 1) show that α has moderate variability (CV%
of 47.5%) with a mean of 0.0804 cm-1. The means
of the hydraulic conductivities under pressure heads of 0; -3; -6; -9; -15 cm were 29.97; 22.71; 17.46; 13.59; 8.51 mm h-1, and
CV% of 65.9; 58.1; 52.7;
49.4; 48.5%, respectively, which demonstrates mod-erate variability as well.
The above results indicate that the variability
of α was weaker than that of the hydraulic
relatively homogeneous on the slope scale. After plot-ting the CV% of the hydraulic conductivity versus pres-sure heads (Figure 1), it was concluded that the hy-draulic conductivity variability decreased with decreas-ing pressure heads, indicatdecreas-ing that the distribution of smaller pore sizes would be more uniform than of larger ones since the dominant pore size governing water flow in soils decreases with decreasing pressure heads. However, Mohanty et al. (1994) found that the
CV% of the hydraulic conductivity between rows
com-pacted by wheel traffic was greater at -150 mm than at higher pressure heads. They attributed this to the relatively homogeneous larger pores as a result of de-struction by the wheels.
Organic matter content (OM) and clay (<0.01 mm) content are taken as the main factors influenc-ing soil hydraulic conductivity. The correlation analy-sis showed a significant negative correlation between the organic matter content and hydraulic conductivi-ties for all pressures (Table 2). As the supply pressure head decreased, organic matter played an increasingly important part in the water flow, as indicated by the increased correlation coefficient. Thus, in similar
re-gions, OM can be beneficial for the storage of soil wa-ter by limiting infiltration into deeper soil layers. This phenomenon is important for light textured soils in arid and semi-arid regions, where soil moisture tends to be the critical factor affecting vegetative growth. As for the relationship of clay content and hydraulic conduc-tivity, significant (P < 0.01) negative correlations were also found for all the pressure heads (Table 2), indi-cating that clay particles do not facilitate infiltration near saturated conditions. Therefore, clay can also contribute to the storage of soil water by decreasing downward water flow in the form of redistribution and upward flow in the form of evaporation. The correla-tion increased as the applied pressure head decreased. This indicates that water flow is more likely to be af-fected by soil clay content as the soil becomes drier. Variability of hydraulic parameters along the slope - Seven estimates for hydraulic parameters were ob-tained for each row averaging the values per row. The Gardner’s α index generally presented a fluctuant varia-tion in the direcvaria-tion of the slope, and the hydraulic con-ductivities under all pressure heads decreased in gen-eral (Figure 2). As the applied pressure head decreased, the difference in the hydraulic conductivities of up and down-slope positions decreased but the distribution trend remained the same. For a better understanding of this tendency, organic matter content and clay (<0.01 mm) content were also scattered along the toposequence in Figure 3. Both organic matter and clay (<0.01 mm) content tended to decrease from the top of the slope to the bottom, which may explain the de-cline in hydraulic conductivities, since both factors had negative effects on the hydraulic conductivities. In ad-dition, soil moisture tends to increase slope downward (Hu et al., 2006). This may also influence the
distri-α K
s K3 K6 K9 K15
m
c -1 ---------------------------------mmh-1--------------------------------
-n a e
M 0.0804 29.97 22.71 17.46 13.59 8.51
n o i t a i v e d d r a d n a t
S 0.0382 19.73 13.20 9.20 6.72 4.13
) % ( n o i t a i r a v f o t n e i c i f f e o
C 47.5 65.9 58.1 52.7 49.4 48.5
Table 1 - Summary of α and hydraulic conductivity (K) statistics for the entire study area.
Ks, K3, K6, K9, K15 are the hydraulic conductivities at pressure heads of 0, -3, -6, -9, -15 cm, respectively.
Table 2 - Soil organic matter (OM) and clay contents and their correlation coefficients with hydraulic conductivity.
n a e
M Standard n o i t a i v e d f o t n e i c i f f e o C ) % ( n o i t a i r a v t n e i c i f f e o c n o i t a l e r r o c n o s r a e P K
s K3 K6 K9 K15
) % ( M
O 0.722 0.241 33.8 -0.319** -0.346** -0.366** -0.377** -0.393**
) % ( y a l
C 17.649 4.560 25.8 -0.328** -0.363** -0.382** -0.384** -0.404**
** Significant (P < 0.01) K
s, K3, K6, K9, K15 are, respectively, the hydraulic conductivities at pressure heads of 0, -3, -6, -9, -15 cm
Figure 1 - Coefficient of variation of the hydraulic conductivity (K) under pressure heads.
40 45 50 55 60 65 70
0 5 10 15
C o e ff ici ent of var ia ti on (% )
bution pattern of the hydraulic conductivity through pore size changes resulting from the influence of soil moisture as a result of the shrinking and swelling (Lin et al., 1998). These results were also supported by Bagarello et al. (1999), who found a negative
correla-tion between lnKfs and water content. However,
Gardner’s α indexes did not present a monotonous dis-tribution along the slope transect as expected, a
pos-Ks, K3, K6, K9, K15 are, respectively, the hydraulic conductivities at pressure heads of 0, -3, -6, -9, -15 cm
α K
s K3 K6 K9 K15
m
c -1 ---------------------------mmh-1--------------------------
-n a e
M Shaded 0.0986 34.97 24.89 18.01 13.24 7.47 y
n n u
S 0.0667 28.48 22.95 18.58 15.11 10.12
n o i t a i v e d d r a d n a t
S Shaded 0.0455 25.27 16.67 11.39 8.04 4.40 y
n n u
S 0.025 13.47 9.72 7.18 5.49 3.63
% , n o i t a i r a v f o t n e i c i f f e o
C Shaded 46.1 72.3 67.0 63.3 60.7 59.0 y
n n u
S 32.3 47.3 42.3 38.6 36.3 35.8
e h t r o f l e v e l e c n a c i f i n g i S
s t c e p s a o w t n i n a e m f o e c n e r e f f i
d 0.000 0.073 0.513 0.393 0.017 0.000
Table 3 - Statistics of α and hydraulic conductivity (K) for shaded and sunny aspects.
sible reason for this being the fact that they were in-fluenced by many complicated factors. In addition, the error introduced in the fitting procedure may also en-hance the erratic pattern. Angulo-Jaramillo et al., 2000 also found that Gardner’s αfluctuated more than Kfs
at small scales, and they attributed this to the concept
that α is much more susceptible to capillary
macro-pores than to Kfs.
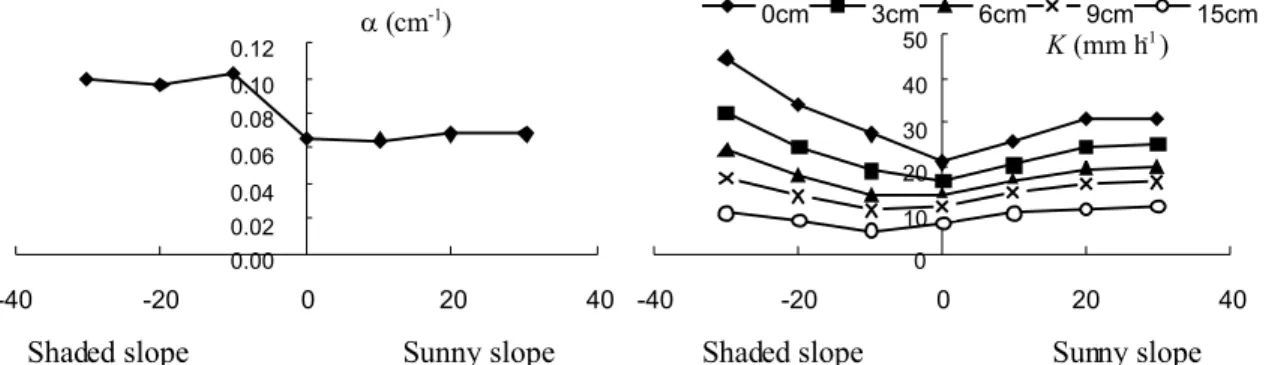
Variability of hydraulic parameters perpendicular
to slope (PS) direction - In order to present the
dis-tribution trend of the hydraulic parameters in the di-rection perpendicular to the slope, estimates derived from the same column were averaged to represent
each column (Figure 4). Gardner’s α of the shaded
aspect of the slope were greater in relation to those of the sunny aspect. The hydraulic conductivities at high pressure heads in the middle column were lower than on either side. The middle column is situated close to a road and it may be that the larger pores in this column were destroyed by compaction caused by hu-man traffic. Statistical analysis of α and hydraulic con-ductivity for the shaded and sunny aspects are also listed in Table 3. In order to quantify the differences in the hydraulic parameters of the two aspects, two-tailed and paired t-tests were carried out. Results show
that Gardner’s α of the shaded aspect were
signifi-cantly (P < 0.001) greater than those of the sunny as-pect. The hydraulic conductivities under pressure heads of 0 and -3 cm tended to be higher in the shaded aspect than in the sunny aspect, but the differences were not significant. For -6 cm pressure, the hydrau-lic conductivities of the shaded aspect were generally lower than those of the sunny aspect, and the differ-ence was also not significant. In contrast, the hydraulic conductivities of the shaded aspect were significantly lower than those of the sunny aspect at applied pres-sures of -9 cm (P < 0.05) and -15 cm (P < 0.001).
Hydraulic conductivities were mainly con-trolled by soil structure and texture, and other soil
Figure 3 - Distribution of soil organic matter (line with hollow squares) and clay (<0.01 mm) content (line with solid squares) along the toposequence.
chemical-physical properties. As the pressure head rises, macro-pores play a much more important role in the soil water flow and the contribution of micropores to water flow decreases. Macropores are dominated by soil structure and biopores, while mi-cro-pores are influenced by underlying physical and chemical properties related to soil texture. As analyzed above, the relative magnitude of the hydraulic conduc-tivities between the shaded and sunny aspects differed with the applied pressure head, with hydraulic conduc-tivities of the shaded aspect being greater than those of the sunny aspect at higher applied pressure heads and vice versa, when lower pressures were applied. In order to investigate this further, the organic matter and clay content of the sunny and shaded aspects of the slope were compared using paired t-tests (Table 4). Soil organic matter content of the shaded aspect was significantly greater than that for the sunny as-pect. The clay content of the shaded aspect was slightly lower as compared to the sunny aspect, but the difference was not significant.
These results suggest that soil hydraulic prop-erties may be affected by the variations in soil organic matter content at different positions along the slope. The higher hydraulic conductivities of the shaded as-pect at pressure heads of 0 and -3 cm may be affected by several factors. First, the soil in this portion of the slope had a higher number of biopores. This may fa-vor infiltration near saturation. In contrast, the higher organic content of the shaded aspect slope may ham-per infiltration near saturation. Obviously, the effects of biopores and organic matter content offset each other under higher pressure heads. At lower pressure heads, however, the influence of biopores is weakened.
Thus the reduced hydraulic conductivity of the shaded aspect of the slope may be due to its higher soil or-ganic matter content. The changes in the relative mag-nitude of the hydraulic conductivity between the shaded and sunny aspects agreed with our observation that
Gardner’s α of the shaded aspect were larger than
those of the sunny aspect.
The spatial distribution of hydraulic properties in a given area may be closely associated with spe-cific processes which have occurred in that area. Even for the same influencing factors, they may exert dif-ferent influences on difdif-ferent areas. The correlation between organic matter and clay content with hydrau-lic conductivity was generally greater for the sunny aspect than for the shaded aspect (Figure 5). This sug-gests that other factors, such as topographic proper-ties may contribute to the spatial variability of the hy-draulic conductivity of the shaded aspect, which led to a greater heterogeneity of Gardner’s α and
hydrau-n a e
M + Standarddeviation Std. errormean Levelofsignificance
M
O 0.187 0.258 0.044 0.000
y a l
C -0.658 4.967 0.840 0.438
Table 4 - Paired-samples t-test of soil organic matter (OM) and clay (<0.01 mm) content between the shaded and sunny aspects.
+Refers to the mean value for the shaded aspect minus the mean value for the sunny aspect.
Figure 4 - Distribution of α and hydraulic conductivity (K) along the direction perpendicular to the slope.
lic conductivity on the shaded aspect as compared to the sunny aspect (Table 3). Therefore, a different strat-egy should be taken for different slope aspects even at the same hill-slope. For example, due to the rela-tively high heterogeneity of the hydraulic parameters in the shaded aspect, more processes may need to be considered and more samples may be needed to de-termine these hydraulic parameters in order to increase the accuracy of hydrological models.
Geo-statistical analysis
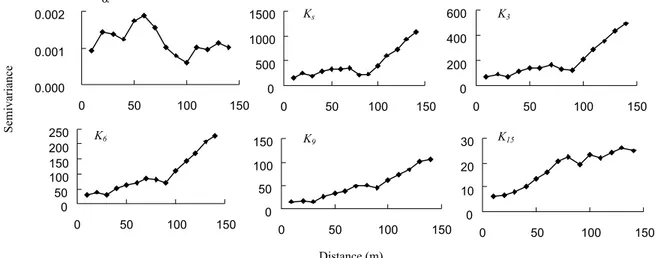
Semi-variograms of hydraulic parameters along
the slope - Due to the limited sampling made
perpen-dicular to the slope, semi-variograms of the hydraulic parameters were focused only along slope (Figure 6).
Gardner’s α showed an erratic distribution with no
spatial structure along the slope. As far as the hydraulic conductivity is concerned, the semi-variance increased with increasing distance, except for 80 and 90 m, where semi-variance values were unexpectedly low. The resulting concave line projected gradually as
pres-Table 5 - Semi-variogram parameters of αand hydraulic conductivity (K) in the direction along slope.
r e t e m a r a
P α+ K
s
+ K
3 K6 K9 K15
m
c -1 ----------------------------------------mmh-1--------------------------------------
-l e d o
M No No L L L S
C
0 - - 46.75 14.37 4.29 2.23
C
1 - - 342.01 172.56 97.41 55.06
D
G (%) - - 12.03 7.69 4.23 4.05
) m ( e g n a
R - - 110 110 120 140
F - - 42.52 67.82 110.17 87.78
R2 - - 0.8948 0.9313 0.9566 0.9461 +No appropriate model was found, “L” refers to the linear with sill model, “S” refers to the spherical model. C
0: nugget variance, C1:
structure variance, GD = (C0 /(C0 + C1)) × 100. Ks, K3, K6, K9, K15 are, respectively, the hydraulic conductivities at pressure heads of 0, -3, -6, -9, -15 cm.
sure head decreased. When fitting the semi-variograms to models (Table 5), it was found that there were no adequate models available for Ks. However, K3,K6, K9,
and K15 could be well fitted using a linear model with sill for pressure heads of -3, -6, and -9 cm and a spherical model for pressure head of -15 cm. Their
ranges and GD changed from 110 m to 140 m, and
from 12.03% to 4.05%. This indicates that they all showed strong spatial dependency.
Based on reports from the literature, Sobieraj et al. (2004) compared the spatial structure of satu-rated hydraulic conductivity data and showed that semi-variogram ranges were between 0 and 115 m and
values for GD ranged from 6% and 100%. Results
here obtained were comparable to theirs. However, it may be considered that the ranges are somewhat larger as compared to our sampling extent (160 m). This may be attributed to the relatively large sampling space (10 m), which could have a significant scaling effect (Blöschl & Sivapalan, 1995). However, in this study, more interest was placed in the relative spatial
ture rather than the exact values among different pres-sure heads. Therefore, it is concluded that as prespres-sure heads decrease, the correlation length and the spatial dependency is enhanced. This is due to the fact that as the applied pressure head drops, the corresponding flow is progressively governed by intrinsic soil prop-erties such as particle size distribution. This was re-flected by the increasing correlation between the hy-draulic conductivity and soil clay content (Table 2). Obviously, intrinsic soil properties tend to be more spa-tially dependent than other environmental factors.
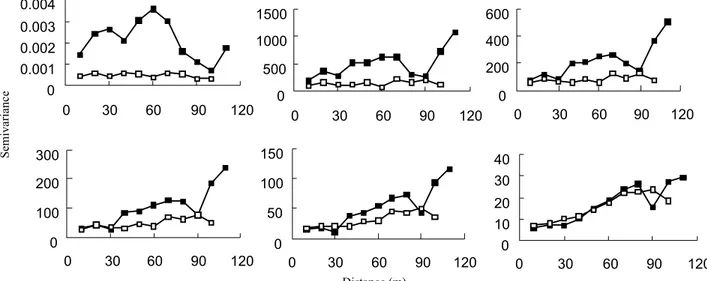
Comparison of the spatial structure of hydraulic parameters between the shaded and sunny
as-pects of the slope - The semi-variograms of
hydrau-lic parameters in the shaded and sunny aspects and their corresponding fitting results are presented in Figure 7 and Table 6, respectively. The structure vari-ance C1 of each hydraulic property in the shaded as-pect was greater than in the sunny asas-pect, which is in agreement with results from classical statistical analysis, showing that heterogeneity in the shaded aspect was greater than in the sunny aspect. The
dif-r e t e m a r a
P Aspect α+ K
s
+ K
3 K6 K9 K15
m
c -1 -----------------------------------mmh-1---------------------------------
-l e d o
M Shaded - - L L L S
y n n u
S - - L L L L
C 0
d e d a h
S - - 68.26 19.96 4.63 1.81
y n n u
S - - 65.87 30.55 14.39 4.24
C 1
d e d a h
S - - 437.41 189.45 99.70 22.32
y n n u
S - - 40.41 35.40 29.06 17.60
D
G (%) Shaded - - 13.5 9.5 4.4 3.86
y n n u
S - - 62.0 46.3 33.1 19.4
) m ( e g n a
R Shaded - - 100 90 90 100
y n n u
S - - 60 60 60 90
F Shaded - - 15.26 22.67 25.68 19.46 y
n n u
S - - 4.77 13.22 28.66 62.68
R2 Shaded - - 0.7923 0.8500 0.8652 0.8295
y n n u
S - - 0.5768 0.7907 0.8912 0.9471
Table 6 - Comparison of Semi-variogram parameters of α and hydraulic conductivity (K) between the shaded and sunny aspect.
+No appropriate model was found, “L” refers to the linear with sill model, “S” refers to the spheric model. C
0: nugget variance, C1:
structure variance, GD = (C0 /(C0 + C1)) × 100. Ks, K3, K6, K9, K15 are, respectively, the hydraulic conductivities at pressure heads of 0, -3, -6, -9, -15 cm.
ference of heterogeneity between the shaded and sunny aspects decreased as the applied pressure head decreased. Under a pressure head of -15 cm, the spa-tial structure of hydraulic conductivity behaved
simi-larly. As for the values for GD, they were lower on
the shaded aspect, which is comparable to the entire slope as expressed in Table 5, showing a high mag-nitude of spatial dependence. In contrast, the sunny aspect exhibited obviously higher values which showed a moderate spatial dependence for hydraulic conductivities at -3 cm, -6 cm, and -9 cm and a strong spatial dependence for -15 cm. However, re-gardless of whether it was the shaded or sunny, the
GD ratio decreased as the pressure head decreased
from -3 cm to -15 cm. Furthermore, the values for the shaded aspect remained consistently lower than those for the sunny aspect. This demonstrates that the spatial dependence became much stronger as pressure head decreased and the spatial structure of the shaded aspect was stronger than that of the sunny
aspect. Since the nugget, structure variance, and GD
values of the shaded aspect were similar to the val-ues for the whole slope, we assume that the spatial structure of the shaded aspect may dominate the en-tire slope.
Many studies have attempted to explain GD
with Ks semivarigrams and they attribute the variability
mainly to the human activity (Tsegaye & Hill, 1998; Mohanty & Mousli, 2000). The area of this study has
been deviated from farming activities for about 30 years and was therefore less influenced by human activity. This is likely to be the main reason for the lower nug-get variance and the strong spatial dependency on the whole slope scale, especially at low pressure heads.
ACKNOWLEDGMENTS
To the National Natural Sciences Foundation of China Grant numbers of 90502006 and 50479063 and the "Hundred Talents Program" of the Chinese Academy of Sciences for the financial support.
REFERENCES
ANGULO-JARAMILLO, R.; VANDERVAERE, J.P.; ROULIER, S.; THONY, J.L.; GAUDET, J.P.; VAUCLIN, M. Field measurement of soil surface hydraulic properties by disc and ring infiltrometers: a review and recent developments. Soil & Tillage Research, v.55, p.1-29, 2000.
ANKENY, M.D.; AHMED, M.; KASPAR, T.C.; HORTON, R. Simple field method for determining unsaturated hydraulic conductivity. Soil Science Society of America Journal, v.55, p.467-470, 1991.
BAGARELLO, V.; CASTELLINI, M.; IOVINO, M. Influence of the pressure head sequence on the soil hydraulic conductivity determined with tension infiltrometer. Applied Engineering in Agriculture, v.21, p.383-391, 2005.
BAGARELLO, V.; IOVINO, M.; REYNOLDS, W.D. Measuring hydraulic conductivity in a cracking clay soil using the Guelph Permeameter. Transactions of the ASAE, v.42, p.957-964, 1999. BLÖSCHL, G.; SIVAPALAN, M. Scale issues in hydrological modeling:
a review. Hydrological Process, v.9, p.251-290, 1995. CAMBARDELLA, C.; MOOMAN, T.B.; NOVAK, J.M.; PARKIN,
T.B.; KARLEM, D.L.; TURVO, R.F.; KONOPA, A.E. Field scale variability of soil properties in central Iowa soil. Soil Science Society of America Journal, v.47, p.1501-1511, 1994. GARDNER, W.R. Some steady state solutions of the unsaturated
flow equation with application to evaporation from a water table. Soil Science, v.85, p.228-232, 1958.
GIMENEZ, D.; RAWLS, W.J.; LAUREN, J.G. Scaling properties of saturated hydraulic conductivity in soil. Geoderma, v.88, p.205-220, 1999.
GREGO, C.R.; VIEIRA, S.R.; ANTONIO, A.M.; ROSA, S.C.D. Geostatistical analysis for soil moisture content under the no tillage cropping system. Scientia Agricola, v.63, p.341-350, 2006. HEDDADJ, D.; GASCUEL-ODOUX, C. Topographic and seasonal
variations of unsaturated hydraulic conductivity as measured by tension disc infiltrometers at the field scale. European Journal of Soil Science, v.50, p.275-283, 1999.
HU, W.; SHAO, M.A.; WANG, Q.J. Study on spatial variability of soil moisture on the recultivated slope-land on the Loess Plateau. Advances in Water Science, v.17, p.74-81, 2006.
HU, W.; SHAO, M.A.; WANG, Q.J.; REICHARDT, K. Soil water content temporal-spatial variability of the surface layer of a Loess Plateau hillside in China. Scientia Agricola, v.65, p.277-289, 2008.
LIN, H.S.; McLNNES, K.J.; WILDING, L.P.; HALLMARK, C.T. Macroporosity and initial moisture effects on infiltration rates in vertisols and vertic intergrades. Soil Science, v.163, p.2-8, 1998. LOGSDON, S.D.; JAYNES, D.B. Methodology for determing hydraulic conductivity with tension infiltrometers. Soil Science Society of America Journal, v.57, p.1426-1431, 1993. LOGSDON, S.D.; JAYNES, D.B. Spatial variability of hydraulic
conductivity in a cultivated field at different times. Soil Science Society of America Journal, v.60, p.703-709, 1996. MALLANTS, D.; MOHANTY, B.P.; VERVOORT, A.; FEYEN, J.
Spatial analysis of saturated hydraulic conductivity in a soil with macropores. Soil Technology, v.10, p.115-131, 1997. MOHANTY, B.P.; ANKENY, M.D.; HORTON, R.; KANWAR, R.S.
Spatial analysis of hydraulic conductivity measured using disc infiltrometers. Water Resources Research, v.30, p.2489-2498, 1994.
MOHANTY, B.P.; MOUSLI, Z. Saturated hydraulic conductivity and soil water retention properties across a soil-slope transition. Water Resources Research, v.36, p.3311-3324, 2000. SISSON, J.B.; WíERENGA, P.J. Spatial variability of steady-state
infiltration rates as a stochastic process. Soil Science Society of America Journal, v.45, p.699-704, 1981.
SMETTEM, K.R.J.; CLOTHIER, B.E. Measuring unsaturated sorptivity and hydraulic conductivity using multiple disc permeameters. Soil Science, v.40, p.563-568, 1989. SOBIERAJ, J.A.; ELSENBEER, H.; CAMERON, G. Scale
dependency in spatial patterns of saturated hydraulic conductivity. CATENA, v.55, p.49-77, 2004.
TANG, K.L.; HOU, Q.C.; WANG, B.K. The environment background and administration way of wind-water erosion crisscross region and Shenmu experimental area on the Loess Plateau. Memoir of NISWC, v.18, p.2-15, 1993.
TSEGAYE, T.; HILL, R.L. Intensive tillage effects on spatial variability of soil physical properties. Soil Science, v.163, p.143-154, 1998.
WHITE, I.; SULLY, M.J. Macroscopic and microscopic capillary length and time scales from field infiltration. Water Resources Research, v.23, p.1514-1522, 1987.
WOODING, R.A. Steady infiltration from a shallow circular pond. Water Resources Research, v.4, p.1259-1273, 1968.