FREE THEMES
1 Departamento de Engenharia Civil, Centro de Ciências Exatas e de Tecnologia, Universidade Federal de São Carlos. Rodovia Washington Luís km 235, Monjolinho. 13565-905 São Carlos SP Brasil. marcia_suriano@ yahoo.com.br 2 Departamento de Engenharia de Transportes, Universidade de São Paulo.
A decision-support tool for the control of urban noise pollution
Abstract Improving the quality of life is increas-ingly seen as an important urban planning goal. In order to reach it, various tools are being devel-oped to mitigate the negative impacts of human activities on society. This paper develops a meth-odology for quantifying the population’s exposure to noise, by proposing a classification of urban blocks. Taking into account the vehicular flow and traffic composition of the surroundings of urban blocks, we generated a noise map by applying a computational simulation. The urban blocks were classified according to their noise range and then the population was estimated for each urban block, by a process which was based on the census tract and the constructed area of the blocks. The acoustical classes of urban blocks and the num-ber of inhabitants per block were compared , so that the population exposed to noise levels above 65 dB(A) could be estimated, which is the high-est limit high-established by legislation . As a result, we developed a map of the study area, so that ur-ban blocks that should be priority targets for noise mitigation actions can be quickly identified.
Keywords Noise pollution, Population exposure,
Quality of life, Vehicular flow
Marcia Thais Suriano 1
Léa Cristina Lucas de Souza 1
S
ur
iano MT
Introduction
Nowadays, urban areas are experiencing a fast process of development, not only from the point of view of economics, but also from social as-pects.. Associated to this development, various types of problems and impacts arise, which affect the environmental integrity.
Although improving the quality of life of the population depends on acquiring and maintain-ing healthy habits1, cities often have environmen-tal features that affect the development of these urban activities. Noise pollution is one of these features. Urban noise results from the combina-tion of various noise sources, such as transpor-tation, industries, construction sites, recreational activities, schools and commercial areas.
Among these, due to the growth of vehi-cle fleets and the lack of territorial planning in urban centers, traffic noise is considered as the main source of noise pollution. . According to the World Health Organization2 (WHO), more than half of the world’s population occupies urban spaces. In addition, there are alarming estima-tions of demographic growth. For the quality of life and health, the WHO states that the average sound exposure should not exceed 55 dB(A), and this limit is even more restricted during sleeping periods, when the threshold should be 45 dB(A). Sound pressure levels over 65 dB(A) could cause negative effects such as interference in speech intelligibility, difficulties in sleeping or resting, disturbance and a drop in the quality of doing work and leisure activities. , The sound pressure level above 85 dB(A) may cause hearing loss for human beings.
Many studies report this evidence either by damage caused to hearing loss3 and sleep distur-bance4-6 , or cognitive performance in adults and children7, psychological diseases8 and cardiovas-cular and heart disease 9-11.
Improvement in the urban quality of life, therefore requires monitoring exposure condi-tions of the population, which is a fundamental step for planning and health intervention12. En-vironments that exceed noise levels determined by legislation require this monitoring so that control and acoustical attenuation solutions can be reached. Reducing traffic noise is a challenge for many countries. Worldwide, there are actions planned to combat noise pollution caused by ur-ban traffic noise. These actions could be specially exemplified by the case of the European Com-munity (EC), where the development of noise maps is a mitigation strategy which is widely
ap-plied. The noise map is a tool requested by the European Directive13 in order to detect levels of sound pollution and promote measures for its attenuation.
Noise maps are used as strategy tools for ur-ban planning, aiming at the local population´s quality of life, allowing noise quantification, eval-uation of population exposure, the development of future scenarios, the identification of conflict areas and the proposals for solutions14.
This strategy, however, is not yet a common tool applied in Brazil. There are some legal or standardized Brazilian instruments for noise con-siderations, such as: Federal Law no 10.257/2001, which is known as the City Statute15; the CONA-MA resolution 001/1990, which addresses noise emissions16; the CONAMA resolution 002/1990, which establishes the Silence Program17; the CONAMA resolution 020/1994, which establish-es the Noise Seal18, and the technical standards NBR 10.151:200019, NBR 10.152:198720 and NBR 7.731:198321. In this context, this paper proposes a Brazilian methodology that allows quick access to information, to optimize the establishment of priority actions and identify the community´s ex-posure to noise. For this purpose, we propose an adapted method for the acoustical classification of urban blocks22 in order to quantify the popu-lation exposed to noise during the peak hours of traffic flow. The proposed method is applied at several points in the city of São Carlos, SP, Brazil.
Method
The method of this research consists of the fol-lowing steps: delimitation and physical charac-terization of the study area; data collection; vali-dation and application of a prediction model for the acoustical mapping; acoustical classification of the urban blocks; evaluation of the communi-ty exposure to noise.
Delimitation and physical characterization of the study area
aúd
e C
ole
tiv
a,
20(7):2201-2210,
2015
The urban fraction for this study occupies a region that includes three important traffic corridors for the city (Av. São Carlos, Av. Dr. Carlos Botelho and R. XV de Novembro). Ac-cording to the Municipal Master Plan, this frac-tion presents a mixed use and occupafrac-tion, with residential buildings, schools, commercial areas and services.
For a physical characterization, the width of the roads and heights of the buildings were esti-mated for each urban block of the study area. In this estimation, we considered that each build-ing floor was 3 meters high, while the buildbuild-ings of single ground-floors or ground-floors of multi-floor buildings were considered to be 4.5 meters high. This data collection was supported by cadastral maps (available from the Munici-pal Government of São Carlos) and site visits, as well as Google Earth® images (online access).
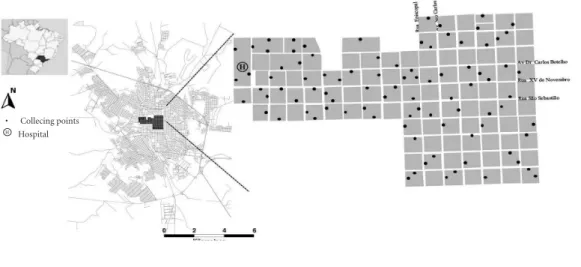
For the data collection, reference points were selected in the urban fraction in such a way that they were situated close to the middle point of the urban blocks that faces the streets, so that the road crossings were excluded from the samples. (Figure 1).
Data Collection
The traffic flow and fleet composition (light and heavy vehicles), were characterized and counted
from the reference points. These were the points also considered for the sound pressure level measurements. This data collection took place on week days (Tuesday, Wednesday and Thurs-day) at peak hours of traffic flow (from 7 to 8 a.m in the mornings, and from 5:30 to 6:30 p.m in the afternoons). Weekends and holidays were avoided due to atypical conditions.
The parameter taken as the identifier of the sound pressure level was the Equivalent Noise Level (LAeq), defined by equation 124.
(Equation 1) where,
T is the integration time; Pt is the instant sound pressure;
P0 is the sound pressure of reference 2,0 x 10⁻⁵ N/m²;
LAeq is the equivalent continuous noise level in dB(A).
For the LAeq data collection, we applied a Hand-Held Analyser 2270-L Brüel&Kjær, which was equipped with a device for wind protection attached to the microphone in order to reduce interferences. The equipment was configured to measurements of the outside environmental noise, considering the methodological specifica-tions suggested by NBR 10.15119 and ISO 199624, placed far from surfaces reflective to sounds, keeping a minimum distance of 2.0 meters from walls and 1.2 meters from the ground.
Figure 1. Location of the city of São Carlos, São Paulo state, Brazil, highlighting the study area and the points of
data collection. •Collecingpoints
H Hospital
LAeq = 10.log 1 ʃ dt T
T
0 P2 (t)
S
ur
iano MT
Validation and application
of a prediction model for noise mapping
The applied calculation model was the French model called “Nouvelle Méthode de Prevision du Bruits des Routes” (NMPB Routes-2008, in English, the New Method for Road Traffic Noise Prediction). This method was recommended as an interim option during the implementation of the European Directive 2009/49/EC. The NMPB Routes-2008 was pre-sented in detail by Dutilleux et al.25 and can be described by Equation 2:
(Equation 2) Where,
p is the percentage of occurrence of favorable meteorological conditions for sound propaga-tion. It assumes a value 1 (one), if the conditions are favorable, and 0 (zero), if the conditions are homogeneous. The conditions are favorable, when the wind, temperature and humidity cause deflections to downwards, intensifying the sound level near the ground. The homogeneous condi-tions correspond to deflection upwards;
LpF is the sound pressure level for favorable conditions, according to Equation 3;
Lp,F = LW – Adiv – A atm – Asolo,F – Adif,F – Aref (Equation 3)
LpH is the sound pressure level for homoge-neous conditions, according to Equation 4.
LpH = LW – Adiv – A atm – Asolo,H – Adif,H – Aref (Equation 4)
In Equations 3 and 4, the LW represents the acoustical power of the vehicular traffic, generat-ed by the average spegenerat-ed, the traffic composition and type of paving. Adiv is the attenuation due to geometric dispersion, Aatm is the attenuation caused by atmospheric absorption, Adif is the dif-fraction caused by obstacles, Asolo is the ground effect, and Aref is the absorption of the vertical surfaces.
Nesses casos, a complexidade do fenômeno envolvido e os cálculos necessários levam ainda a uma modelagem auxiliada por programa com-putacional.
In these cases, because of the complexity of the phenomena under consideration and the cal-culations required, a computer aided modeling program should be used. For this purpose, the prediction method applied here was the CAD-NA-A, v.4.1 computational program (Computer Aided Design Noise Abatement, Datakustik)26.
The traffic noise in this computational pro-gram is represented as a linear source, for which the attributes correspond to the road characteris-tics and the traffic flow.
The program can be run using the input data of real sound pressure levels measured on site or by counting vehicular flow and composition.
Due to the fact that the software was developed for specific conditions of French cities, a valida-tion process is always necessary before it is applied to conditions of Brazilian cities. In our case, the validation process for the study area was previous-ly performed and presented in the study of Giunta et al.27. The latter indicated that the best option for the input data is the LAeq values, because of the precise results obtained. These authors also highlight thatif the vehicular flow is used as input data, the simulated values may result in an average difference of 2 dB(A) less than the real values.
Thus, the input configuration of the simula-tion corresponded to the collected data of sound pressure levels (LAeq) and the street characteris-tics, both of them for the periods of peak hours. The absorption coefficient of the façade surfaces assumed the value of 0.37 (which is the default value of the software). In this calculation pro-cess, receptors were inserted at the middle point of the front part of the urban blocks and in the inner part of the blocks, thus enabling us to cal-culate simulated values of sound pressure levels.
Acoustical Classification of the urban blocks
Classifying and analysing the blocks was based on a methodology adapted from Men-donça et al.22. This method consisted of deter-mining an arithmetic average of values simulat-ed for the four middle points of the front part of each urban block, together with the values of four points placed in the inner part of the urban blocks, positioned 30 meters from the points of the front part. This average generates the val-ue for the acoustical classification of the urban blocks.In our specific case, the method is similar, however it considers the the logarithm average values instead of the arithmetic average. We be-lieve that this kind of logarithmic approach has a better correspondence with the nature of the LAeq parameter, because of its logarithm charac-teristics. Afterwards, the classification of the fol-lowing acoustical ranges was carried out: below 60 dB(A); between 60 and 65 dB(A); between 65 and 70dB(A) and above 70db(A).
LLT = 10log [p x 10 + LpF10 (1 - p) x 10 ] LpF
aúd
e C
ole
tiv
a,
20(7):2201-2210,
2015
Community exposure to noise
The population of each urban block was calculated based on the census tract defined by the IBGE. This estimation considered the value of the censor sector of IBGE (I), the constructed area of the urban block (AQ) and the total area of buildings in each census tract (ASC), as shown in Equation (5):
PQ = PSC x (AQ/ASC) (Equation 5) Where:
PQ is the number of people exposed to noise per urban block;
AQ is the constructed area of the specific ur-ban block (m2);
PSC is the number of inhabitants for each sec-tor of the census tract;
ASC is the total area of buildings in each sector of the census tract (m2).
According to the technical standards of NBR 10.15119, the limits of the urban zones presenting mixed uses with commercial tendencies should not exceed 60 dB(A) during the day and 55 dB(A) during the night. These limits were the guide to comparing information of the acoustical classes and the population classes, so that the number of people exposed to noise in the peak hours could be calculated.
Results and discussion
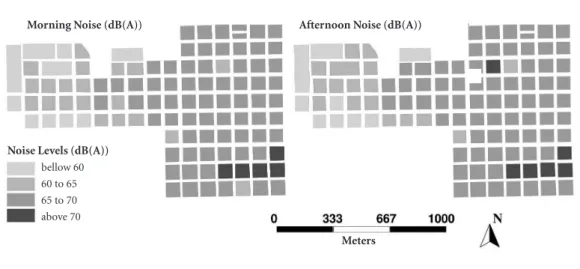
The classification of the urban blocks using the logarithm average method is shown by the results in Figure 2 (peak hours of the mornings and af-ternoons, respectively).
These results show that most of the urban blocks in the study area of São Carlos present-ed high levels of noise, passing the limits estab-lished by current regulations. In the peak hours of the mornings, there are 19.8% of urban blocks classified in the range of 60 to 65 dB(A), while in the afternoons there are 16.8%. Most of the urban blocks are classified in the range of 65 to 70 dB(A). While during the peak hours of the mornings, 65.3% of the urban blocks are clas-sified in this latter range and 68.3% in the peak hours of the afternoon. For the same periods of peak hours, the classification above 70 dB(A) represented only 4.9% and 5.9%, respectively.
There are only a few urban blocks of the area that were classified in the lowest range, represent-ing 9.9% in the mornrepresent-ings and 8.9% in the after-noons. The area corresponding to letter “H” (Fig-ures 1 and 3), represents a hospital, therefore we expected to register the lowest sound emissions among the points. Instead, though not reaching the critical limits, the levels of this area present ed the values already in the limits of the ranges established by current regulations.
Various studies have shown that Brazilian cit-ies are noisy, such as Lima and Carvalho3 for the
Figure 2. Acoustical classes of the urban blocks in the city of São Carlos, SP, in the mornings (7 to 8 a.m.) and in
the afternoons (5:30 to 18:30 p.m.), by ranges of conformity.
Afternoon Noise (dB(A)) Morning Noise (dB(A))
Noise Levels (dB(A)) bellow 60 60 to 65 65 to 70 above 70
S
ur
iano MT
city of Mossoró, Costa and Lourenço28 for Soro-caba, Brito and Sinder29 for Taubaté, Souza and Giunta30 for Bauru and Valadares et al.31 for some cities in Minas Gerais.
From the point of view of the consequenc-es caused by high noise levels and indicated by the WHO2, this situation is even worse, when large-sized cities are taken into account. Cantieri et al.32, for instance, showed that in Curitiba the average values of noise reached 81.9 dB(A) and Pinto and Mardones33 observed that levels above 65 dB(A) are registered in many roads of the city of Rio de Janeiro.
However, the noise disturbance and exposure of population is not a feature exclusively found in Brazilian cities. This urban issue has also been documented in Korea34, the United States35, some states of Pakistan36, Belgium and neighboring countries 37, Ireland38,39, some cities in Finland40 and Spain41.
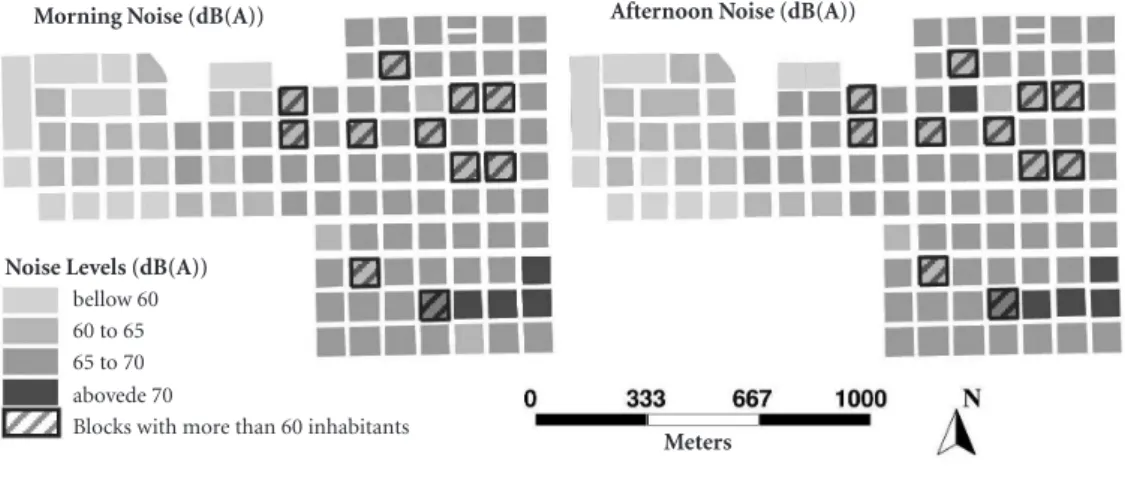
In an attempt to identify the number of peo-ple exposed to the most intense noise in the study area, the data of acoustical classes of the urban blocks (Figure 2) and the number of inhabitants per urban block (Figure 3) were compared, al-lowing access to the portion of the population exposed to noise. The largest concentration of inhabitants coincides with the highest values of sound levels. This fact shows the acoustical fra-gility of the area, generating conflicts for inhabi-tants as well as for pedestrians.
A total of 4,202 inhabitants live in the study area. Most of them are exposed to sound levels above 65 dB(A), representing 70.0% in the peak hours of the morning and 74.7% in the peak hours of the afternoons. Even though these values are for outdoors conditions, it can be observed that there is a high potential of noise exposure in these urban blocks. Thus, the importance of addressing building façades cannot be neglected. Openings of buildings facing the environment of the noisiest blocks expose the inhabitants to lim-its above those considered healthy. Furthermore, the number of people exposed to noise may be even more, if we remember that the number of pedestrians was not computed in this study, which could result in a higher number than that presented here.
In order to quickly detect the blocks that should be priority concerning noise control ac-tions, some maps were developed as shown in Figure 4.
The urban blocks highlighted in Figure 4 cor-respond to those sheltering more than 60 inhab-itants, all of them exposed to high sound levels [above 65 dB(A)] in both periods of peak hours, thus conflicting with the recommendations. These are blocks of streets and avenues with a large vehicular flow.
There are five urban blocks, for which mit-igating measures for noise reduction should be taken into account, as seen in Figure 5. These
Figure 3.Number of persons exposed to environmental noise per urban blocks in the city of São Carlos, SP.
Population (inhabitants)
Square Bellow 40 From 41 to 60 From 61 to 80 Above 80 Hospital H
aúd
e C
ole
tiv
a,
20(7):2201-2210,
2015
blocks are currently found in critical noise con-ditions, because they exceed the 70 dB(A).
A way of mitigating this issue is discussed by Alesheikh and Omidvari41. The authors observed high levels of noise in residential areas and indi-cated the need to verify the emissions of the old vehicle fleet and optimize the quality of public
transportation in order to achieve a minimi-zation of the noise disturbance caused by these factors.
In the case of the city São Carlos, the Master Plan considers a densification of the study area by classifying it as an induced occupation area. As a consequence, a vehicular flow increment
Figure 4. Blocks classified by noise levels, highlighting those with more than 60 persons, in the city of São Carlos,
SP.
Morning Noise (dB(A))
Noise Levels (dB(A)) bellow 60 60 to 65 65 to 70 abovede 70
Blocks with more than 60 inhabitants
Figure 5. Classes of number of persons exposed to environmental noise per urban blocks in the city of São
Carlos, SP, highlighting those where the population is exposed to noise levels above 70 dB(A).
Public Garden below 40 from 41 to 60 from 61 to 80 above 80
Population exposed to 70 dB(A) Afternoon Noise (dB(A))
Population (inhabitants) Meters
Meters
S
ur
iano MT
and the intensification of noise sources should be predicted for this area. Nevertheless, the general guidelines for this area should be more restrictive than the current ones. The densification of the area should be very cautious in terms of noise consequences, even for the urban blocks under the limits of 55 and 60dB(A), aiming at main-taining the quality of life of the inhabitants.
Conclusions
There is a lack of information concerning noise pollution and the damage it causes to the popu-lation in urban centers of Brazilian cities.
In this context, noise maps are a useful tool, helping to verify noise levels, identify areas con-taminated by noise and quantify population ex-posure.
An analysis of noise contamination by urban blocks enabled us to identify levels in specific ur-ban points, which helps decision making to pre-vent and control noise and population exposure. This study presented the noise mapping technique in a specific scale, which is a different scale considered from the municipal guidelines for occupation zones. Although urban decisions cannot be taken based only on specific issues, the guidelines of the scale of occupation zones are too general, when considering the densification of some areas. Indeed, this may create a deterio-ration of the environment, due to the intensifica-tion of noise emissions that cause disturbance for the population.
The approach by urban blocks is an efficient solution resulting in easy interpretation of the acoustical environment. This method can clear-ly show the blocks which exceed the limits and, therefore should not experience urban densifica-tion or not receive a vehicular flow larger than the current one. There is a need to establish priorities and restrictive actions to control and prevent sound emissions in order to reduce the
community exposure to noise. In addition, the classification of urban blocks can be also a tool for environmental education and for the aware-ness of the population.
This proposal can also be extended to other kind of uses and occupation zones, thus compar-ing current regulations to any of the acoustical situations presented by the urban area.
Collaborators
MT Suriano collected the data, wrote the text and prepared initial analysis with LCL Souza, who outlined the study and gave substantial contribu-tions to the paper; ANR Silva incorporated the data in a GIS, and prepared maps, complement-ing the analysis. All the authors worked on the final revision for publication.
Acknowledgements
aúd e C ole tiv a, 20(7):2201-2210, 2015
Brasil. Ministério do Meio Ambiente (MMA). Comis-são Nacional do Meio Ambiente. Resolução Conama nº 002, de 8 de março de 1990. Diário Oficial da União
1990; 2 abr.
Brasil. Ministério do Meio Ambiente (MMA). Comis-são Nacional do Meio Ambiente. Resolução Conama nº 020, de 08 de dezembro de 1994. Diário Oficial da União 1994; 30 dez.
Associação Brasileira de Normas Técnicas (ABNT).
NBR 10.151:Avaliação do nível do ruído em áreas
habi-tadas visando o conforto da comunidade. Rio de Janeiro:
ABNT; 2000.
Associação Brasileira de Normas Técnicas (ABNT).
NBR 10.152:Níveis de ruído para o conforto acústico.
Rio de Janeiro: ABNT; 1987.
Associação Brasileira de Normas Técnicas (ABNT).
NBR 7.731:Guia para execução de serviços de medição
de ruído aéreo e avaliação de seus efeitos sobre o homem. Rio de Janeiro: ABNT; 1983.
Mendonça ABD, Suriano MT, Souza LCL, Viviani E. Classes de quadras urbanas determinadas pelos ní-veis de ruídos. Rev Brasileira de Gestão Urbana 2013; 5(2):63-77.
Instituto Brasileiro de Geografia e Estatística (IBGE).
Indicadores Sociais Municipais:uma análise dos
resulta-dos do universo do Censo Demográfico. Rio de Janeiro:
IBGE; 2010.
International Organization for Standardization (ISO 1992/2). Acoustics: description, measurement and
assess-ment of environassess-mental noise - Parte 2: Determination of
environmental noise levels. Geneva: ISO; 2007. Dutilleux G, Defrance J, Gauvreau B, Besnard F. The revision of the French method for road traffic noise pre-diction. Paris: Acoustics’08; 2008.
Datakustik GMBH. CADNA Manual V3.4. Greifen-berg: Datakustik GMBH; 2005.
Giunta MB, Souza LCL, Viviani E. Sensibilidade de pa-râmetros de um modelo de cálculo para a simulação do ambiente acústico urbano. Anais do XII Encontro Nacional de Conforto no Ambiente Construído e do VIII Encontro Latinoamericano de Conforto no Ambiente Acústico Urbano. Paranoá, Brasília, n 11, p. 77-86, 2014. Costa SB, Lourenço RW. Geoprocessing applied to the assessment of environmental noise: a case study in the city of Sorocaba, São Paulo, Brazil. Environ Monit As-sess 2011; 172(1-4):329-337.
Brito LAPF, Sinder V. Determinação do nível de pressão sonora das principais vias públicas da região central de Taubaté. Anais do X Encontro Nacional e do V Encontro
Latinoamericano de Conforto no Ambiente Construído;
Natal; 2009. p. 27-28.
Souza LCL, Giunta MB. Urban indices as environmen-tal noise indicators. Comput Environ Urban Syst 2011; 35(5):421-430.
Valadares VM, Souza RVG, Cornacchia G, Grosch JG. Considerando a atmosfera acústica na elaboração de planos diretores. Anais do XI Encontro Nacional e do V
Latino Americano de Conforto do Ambiente Construído;
Ouro Preto; 2007. p. 1914-1923. 17. 18. 19. 20. 21. 22. 23. 24. 25. 26. 27. 28. 29. 30. 31. References
Araújo CCR, Guimarães ACA, Meye CR, Boing L, Ra-mos MO, Souza MC, Parcias SR. Influência da idade na percepção de finitude e qualidade de vida. Cien Saude
Colet 2013; 18(9):2497-2505.
World Health Organization (WHO). Guidelines for comunity noise. Edited by Birgitta Berghund, Thom-as Lindvall, Dietrich H. Schela. 1999. [acessado 2014 jun 14]. Disponível em: http://whqlibdoc.who.int/hq /1999/a68672.pdf
Lima AGM, Carvalho EG. Poluição sonora no meio ambiente urbano – Caso Centro de Mossoró, Rio Grande do Norte, Brasil. REDE – Revista Eletrônica do
PRODEMA 2010; 5(2):69-87.
Jakovljević B, Belojević G, Paunović K, Stojanov V. Road Traffic Noise and Sleep Disturbances in an Urban Population: Cross-sectional Study. Croat Med J 2006; 47(1):125-133.
Kim M, Chang SI, Seong JC, Holt JB, Park TH, Ko JH, Croft JB. Road Traffic Noise Annoyance, Sleep Distur-bance, and Public Health Implications. Am J Prev Med
2012; 43(4):353-360.
Halonen JL, Vahtera J, Stansfeld S, Yli-TuomiT, Salo P, Pentti J, Kivimaki M, Lanki T. Associations be-tween Nighttime Traffic Noise and Sleep: The Finn-ish Public Sector Study. Environ Health Perspect 2012; 120(10):1391-1396.
Stansfeld SA, Matheson MP. Noise pollution: non-au-ditory effects on health. Br Med Bull 2003; 68:243-257. Szalma JL, Hancock PA. Noise effects on human per-formance: A meta-analytic synthesis. Psychol Bull 2011; 137(4):682-707.
Babisch W, Beule B, Schust M, Kersten N, Ising H. Traf-fic Noise and Risk of Myocardial Infarction. Epidemiol-ogy 2005; 16(1):33-40.
Banerjee D, Pratim Das P, Foujdar A. Association be-tween road traffic noise and prevalence of coronary heart disease. Environ Monit Assess 2014; 186(5):2885-2893.
Eriksson C, Nilsson ME, Pershagen G.
Environmen-tal noise and health –Current knowledge and research
needs. Stockholm: Stockholm University; 2013.
Moura EC, Lima AMP, Urdaneta M. Uso de indicadores para o monitoramento das ações de promoção e aten-ção da Política Nacional de Atenaten-ção Integral à Saúde do Homem (PNAISH). Cien Saude Colet 17(10):2597-2606.
Directive 2002/49/EC of the European parliament and of the council of 25 June 2002 relating to the assess-ment and manageassess-ment of environassess-mental noise,
Offi-cial Journal of the European Communities, 12-26.
Santos LC, Valado F. The municipal noise map as planning tool. In: Santos LC, Valado F, organizadores.
Acústica. Guimarães: Universidade do Minho; 2004.
S
ur
iano MT
Cantieri E, Catai RE, Agnoletto RA, Zanqueta HFB, Cordeiro AD, Romano CA. Elaboração de um mapa de ruído para a região central da cidade de Curitiba - PR.
Revista Produção on-line 2010; 10(1):71-95.
Pinto FANC, Mardones MDM. Noise mapping of densely populated neighborhoods – example of Co-pacabana, Rio de Janeiro – Brazil. Environ Monit Assess
2009; 155(1-4):309-318.
Ko JH, Chang SI, Kim MH, Holt JB, Seong JC. Trans-portation noise and exposed population of an urban area in the Republic of Korea. Environ Int 2011; 37:328-334.
Seong JC, Park TH, Ko JH, Chang SI, Kim MH, Holt JB, Mehdi MR. Modeling of road traffic noise and estimat-ed human exposure in Fulton County, Georgia, USA.
Environ Int 2011; 37:1336-1341.
Mehdi MR, Kim M, Seong JC, Arsalan MH. Spa-tio-temporal patterns of road traffic noise in Karachi, Pakistan. Environ Int 2011; 37:97-104.
Botteldooren D, Dekoninck L, Gillis D. The Influence of Traffic Noise on Appreciation of the Living Quali-ty of a Neighborhood. Int J Environ Res Public Health
2011; 8(3):777-798.
Murphy E, King EA. An assessment of residential expo-sure to environmental noise at a shipping port. Environ Int 2014; 63:207-215.
Murphy E, King EA. Scenario analysis and noise action planning: Modelling the impact of mitigation mea-sures on population exposure. Applied Acoustics 2011; 72(8):487-494.
Torija AJ, Ruiza DP, Alba-Fernandez V, Ramos-Ridao A. Noticed sound events management as a tool for inclusion in the action plans against noise in medi-um-sized cities. Landscape and Urban Planning 2012; 104(1):148-156.
Alesheikh AA, Omidvari M. Application of GIS in Urban Traffic Noise Pollution. J Prev Med Hyg 2010; 2(2):79-84.
Article submitted 28/07/2014 Approved 13/11/2014
Final version submitted 15/11/2014 32.
33.
34.
35.
36.
37.
38.
39.
40.