Interaction Potential for InSb: A Molecular Dynamics Study
J. P. Rino, P. S. Pizani, and S. C. Costa
Departamento de F´ısica, Universidade Federal de S˜ao Carlos,Caixa Postal676, 13565-905, S˜ao Carlos, SP, Brazil
Received on 6 September, 2003
Molecular dynamics simulation was used to study structural and dynamical properties of InSb. The effective potential takes into account two and three-body interactions, considering atomic-size effects and charge-charge, charge-dipole, and dipole-dipole interactions between 1000 particles, 500 In and 500 Sb, initially within a cu-bic box of sideL=32.397 ˚A. The effect of hydrostatic pressure and temperature on the structural properties like pair distribution function, coordination number, volume change and bond angle distribution and on dynamical properties like vibrational density of states, phonon anharmonicity, dynamic Debye-Waller factor, thermal ex-pansion coefficient and structural phase transformations are correctly described, in excellent agreement with the experimental results.
1
Introduction
Since the eighties molecular dynamic (MD) calculations can simulate structural phase transformations because of the modifications introduced by Parrinello and Rahman [1] who used an appropriate Lagrangian that permits MD calcula-tions in which both the volume and the shape of the simu-lation box change with time. This is so worth because many materials exhibit crystal phase changes under temperature and pressure. In particular, many of the III-V semiconduc-tors undergo a semiconductor to metal transition under high pressure. Among then, InSb is one that present the lowest pressure induced structural transformation.
In the seventies x-ray diffraction was used to study the structural transformation in indium antimonide up to 2.8 GPa[2, 3, 5]. In next decade Vanderborgh et al., using energy-dispersive x-ray diffraction studied this system up to 66 GPa[6]. The most of the experimental results indicated that its cubic structure, at room temperature, transforms ei-ther to a mixture of P2 (tetragonal β-tin structure) and P3 (orthorhombic) phases at ∼2.1 GPa, followed to a single-phase P3 and before crystallizing in P4 orthorhombic single-phase, or directly transform to P4 at∼3.0 GPa. Recently, Nelmes et. al.[7] reexamined, by using angle-dispersive powder-diffraction technique on a synchrotron source, the structural transformation in InSb up to 5 GPa, showing that the es-tablished pressure-temperature (P-T) phase diagram was in-correct. Finally, further experiments[8] has shown that the phase P2, in fact, does not exist, but is an orthorhombic phase. On the other hand, from the theoretical point of view, there are some pseudo-potential and first-principle density functional total energy calculations studies about this
mate-rial. However, these calculations are performed at structural ground state configuration [9-11].
In this paper we report the results of isoenthalpic-isobaric MD simulation for the pressure induced structural transformation and dynamical properties in InSb. From the MD simulation, dynamical Debye-Waller factor, thermal ex-pansion coefficient, pressure induced phase transition, tem-perature and pressure phonon anharmonicity were correctly described, the last in excellent agreement with Raman scat-tering experimental results.
2
Interaction potential and molecular
dynamics calculation
The central core of a molecular dynamics simulation is the choice of the interatomic potential, which determines the failure or success of a simulation. There are tens of em-pirical interaction potentials, which have been used to de-scribe elemental semiconductors and metals to III-V and II-VI semiconductors or more complex systems [12, 13]. Among all these empirical interaction potentials we choose the interaction potential proposed by Shimojo et. al.[14] which has been used to describe several different systems [15-18]. The total interaction potential consist of effective two-body and three-body terms
Φ =
i≺j
Vij(2)(rij) + i≺j≺k
Vjik(3)(rij, rik). (1)
The two-body interaction reads as
⌋
Vij(2)(rij) = Hij rηij
ij
+ZiZj rij
exp(−rij/λ)− Dij 2r4 ij
exp(−rij/ξ)− Wij
r6 ij
where the first term takes into account stereometric repulsion (with parametersHij andηij), the second term is the Coulomb
interaction due to charge transfer between ions, the third term is the charge-dipole interaction due to the large electronic polarizability of anions, and the last one is the van der Waals (dipole-dipole) type interaction. The three-body interaction, necessary to take into account covalent effects, is a modified Stillinger-Weber [12] type potential given by
Vjik(3)(rijrik) =Bijkexp
γ
rij−r0
+ γ
rik−r0
(cosθ
ijk−cosθijk)2
1 +C(cosθijk−cosθijk)2
Θ (r0−rij) Θ (r0−rik), (3)
⌈
where Bijk is the strength of the interaction, Θ (r0−rij) Θ (r0−rik)are step functions,θijkis a
con-stant, andθijkis the angle betweenrijandrik. The
screen-ings in the Coulomb and in the charge-dipole interactions are introduced in order to avoid the long-range calculations in these interactions. The range of screening parameters was fixed inλ=5.0A˚andξ=3.75A˚, and the two-body potential is truncated atrc=7.5A˚. The interaction potential forr < rc is shifted as usually [19, 20], in order to have the value
and its first derivative continuous at the cutoff length. From other simulations using this type of potential [14, 15, 21] we took the exponentsηInIn,ηInSb,andηSbSb to be 7, 9, and
7, respectively. The remaining constants were determined from the cohesive energy, elastic constant, bulk modulus, and melting temperature.
The molecular dynamics simulations were performed in the HPN ensemble (Parrinello-Rahman, which allows changes of the size and shape of the simulation box [1]), in a system consisting of 1000 particles (500 In + 500 Sb). Initially the particles were arranged in a cubic zinc-blende structure at actual density, with zero external pressure. The system was then heated until temperature reaches 900 K, when we start applying external pressure in a rate of 0.2 GPa per 50 000 time steps, up to 6.0 GPa. For all applied pressures the temperature was kept constant at that value by
scaling the velocity of particles every 100 time steps. For each applied external pressure, the system was ther-malized by 50 000 time steps of 2.5 fs, and the phase space has been examined in order to provide two-body structural correlations through pair distribution function and coordi-nation numbers, as well as three-body correlations through bond-angle distributions. It is known that the time scale for volume and shear fluctuations in the simulation ought to be on the order of a few vibrational periods; hence, they are by definition orders of magnitude smaller than experimental (seconds). Nevertheless, the phase transition may well occur very rapidly, as we discuss below. To determine the melting temperature, starting from the cubic zinc-blende structure, the system was heated at constant zero external pressure up to 1500 K. For each temperature the system was allowed to relax for 50 000 time steps.
The experimental values of the physical constants shown in the Table I were used to calibrate the interaction poten-tial, that is, to adjust the parameters used in Eqs. (2) and (3). Once the results from the simulations reproduce well these values, the potential parameters are fixed to simulate all other properties. The values of the potential parameters for InSb are also displayed in Table II [4]. At zero pres-sure and zero kelvin the ground-state zinc-blende structure is stable.
TABLE I: Experimental (Refs. 29 and 30) and Molecular Dynamics values of the lattice parameter, elastic constants, bulk modulus, cohesive energy and melting temperature for InSb.
Experiment Molecular dynamics Lattice Parameter (A˚) 6.4794 6.4794
Elastic Constants (GPa)
C11 65.76 65.7
C12 35.65 35.6
C44 29.83 25.2
Bulk Modulus 45.73 45.63 Cohesive Energy (eV/N) 2.80 2.795 Melting Temperature (K) 800 1300±50
TABLE II: Parameters used in the interaction potencial for InSb.λ, ξ, rcin angstrons..
In-In In-Sb Sb-Sb
Hαβ 5.5933×10⁻¹⁰ 2.4105×10⁻⁸ 1.2022×10⁻⁸
Zαβ 0.86825e2 −
0.86825e2
0.86825e2 Dαβ 0 2.60476e2
5.20951e2 Wαβ 0 14.539×10⁻¹⁰ 0
ηαβ 7 9 7
3
Results and discussion for
struc-tural properties
To simulate the pressure effects on InSb, for each applied pressure, after the system has been very well thermalized, averages were taken over additional 20 000 time steps. In this study the temperature of the system was set to be 900 K. In Fig. 1 we show the changes in the bond length, In-Sb and first neighbors In-Sb-In-Sb and In-In, as a function of the pressure. The increase in In-Sb bond length is followed by the increase of coordination number, which clearly show the structural transformation from a four-fold to sixfold coordi-nated orthorhombic structure under pressure.
Figure 1. The In-Sb pair distribution function (left) and coordina-tion number (right) for pressures just before and after the structural transformation. Full circles at 2.8 GPa and open squares at 3.0 GPa.
A comparison of experimental and MD results for the volume-pressure relationship for InSb is shown in Fig. 2. An excellent agreement of the MD results, in a wide range of pressure can be observed. The volume reduction due to compression, just before the transition, at 2.8 GPa is 0.925V0(V0is the volume at ambient pressure) which agrees very well with experimental results of 0.93V0. The volume reduction due to the structural transformation was found to be 19.7%, which also agrees very well with the experimental result reported by Nelmes et al.,[7] 19.5%, and Yu et al.,[5] 19.3%, but larger than that reported by Vanderborgh et al.[6] 17,1%.
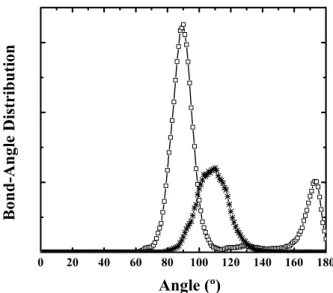
The three-body correlations were analyzed through the angle distribution. Fig. 3 displays the Sb-In-Sb bond-angle distribution at 2.8 and 3.0 GPa. At pressures below the structural transition the bond angle is peaked at 109o
(inter-nal tetrahedral angle), and at the transition this angle moves to 90o and 180o, characteristic of an orthorhombic phase.
These results clearly demonstrate that the structural transfor-mation from a tetrahedrally fourfold-coordinated structure goes to an octahedrally sixfold coordinated structure under pressure.
Figure 2. Changes of the reduced volume as a function of the hy-drostatic pressure. Open circles from reference 5 and full squares from the molecular dynamics simulation. The dotted line indicates the structural phase transition.
Figure 3. Sb-In-Sb bond angle at pressures just before and after the structural transformation. Open squares at 2.8 GPa and stars at 3.0 GPa.
4
Results and discussion for
dynam-ics properties
Here it will be focused the attention on the dynamical be-havior of the ions in the crystalline phase as a function of the temperature, at normal pressure and also under high hy-drostatic external pressure. From the atomic trajectory, fur-nished by the MD, it is possible to calculate all positional, angular and dynamical properties of the system. The veloc-ity autocorrelation functionZα(t)is defined as
Zα(t) =viα(0)viα(t)
whereviα(t)is the velocity of particleiof typeαat time t and<>denotes an ensemble average as well as an aver-age over all particles of typeα. The vibrational density of states G(ω)is obtained from the Fourier transform of the velocity-velocity correlation function
Gα(ω) = 6Nα π
∞
0
Zα(t) cos(ωt)dt.
From the temperature dependence of the pair distribution function (PDF), which gives the bond distance between pair of atoms, it can be obtained the dynamical Debye-Waller factor and the thermal expansion coefficient.
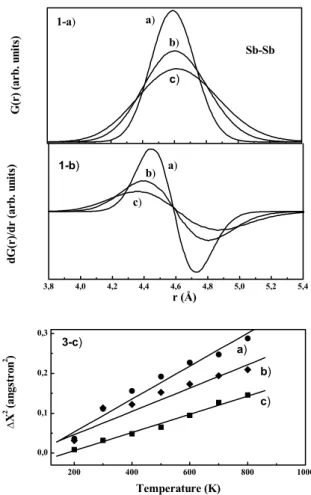
Figure 4. 4a I-a: first peak of the pair distribution function (PDF) of Sb-Sb atoms in crystalline InSb for three different temperatures a) 300, b) 600 and c) 900 K. I-b: first derivative of the PDF for the three temperatures. I-c: squared atomic amplitude oscillation for a) In-In, b) Sb-Sb and c) In-Sb as a function of the temperature.
Among the several static structural information that can be obtained from the pair distribution function (PDF) as bond length, atomic bond angle distributions, crystalline symmetry, and coordination numbers, it variation with the temperature and pressure gives information about structural phase transitions. Moreover, the variation with the tempera-ture furnish directly the thermal expansion coefficient while the width of the pair distribution function gives the atomic oscillation amplitude, which permits to calculate the dynam-ical Debye-Waller factor. The data were obtained from the
simulation in steps of 50 K, from 200 to 1100 K. In Fig. 4(a) it is showed the evolution of the first peak of the PDF of Sb-Sb distance for three temperatures 300, 600, and 900 K, at 0 GPa, whose maximum peak position gives the Sb-Sb bond distance. From the zeros of the derivative of the first peak, displayed in Fig.4(b), it was obtained the ther-mal expansion coefficient for Sb-Sb, and similarly for In-In and InSb distances. The average values between 300 and 900 K are αSb-Sb ∼ 10×10−6,αIn-In ∼ 14×10−6 and
αIn-Sb∼2×10⁻⁶K−1for the cubic phase (at 0 GPa). From the full width of the PDF it was obtained the atomic oscillation amplitude for In-Sb, In-In, and Sb-Sb atoms∆xas a function of the temperature, as displayed in Fig. 4(c). From a linear fit approximation, the temperature coefficient for∆x2,(∂∆x2)/∂T)P, was obtained. The
val-ues are displayed in Table I. From these valval-ues, it can be determined the dynamical Debye-Waller factor by using the equation[22]
D(T) = exp[−2M(T)] = exp
−4π2(∆x)2 3d2
,
wheredis the reticular spacing for the planes giving rise to the reflection under consideration.
Figure 5 displays the vibrational density of statesG(ω)
simulated at 0 GPa and 300 K, obtained by the Fourier transforms of the velocity-velocity correlation function and it comparison with the results obtained by the de-formable bond model (DBM),[23] the experimental Raman spectrum[24] and with the phonon dispersion curve.[25] The result from MD fits very well the DBM and experimental results, reproducing the correct frequencies of the acoustical and optical bands. The lower values of the frequencies ob-tained from MD simulations can be attributed to the small number of particles (1000), since it sampled only around 80 % of the high values of the wave vector side of the Brioullin zone, while Raman scattering samples phonons at the center of the Brillouin zone (phonon wave vectorsk∼0). As the dispersion relation of the optical modes presents decreasing frequencies with increasing phonon wave vectors, it is ex-pected then lower values of the phonon frequencies from the simulations. Furthermore, the Raman scattering measure-ments from Ref. 8 were performed at low temperature (80 K), which shifts the frequencies to higher values, standing out the differences. Despite the computational limitation, the frequency value of the maximum of the optical band is 170 cm−1, near 175 cm−1, the average frequency value of
the optical band of InSb, at room temperature.[26] A dis-cussion on the average optical frequencyωop can be found in literature, which is defined by
ωop=
1 3N
k,,j ωj(k),
wherekbelongs to the first Brillouin zone andjare the opti-cal branches. This equation describes the lattice dynamics as an Einstein approximation, where the optical modes are rep-resented by3N oscillators vibrating at the same frequency
Figure 5. 5-a: vibrational density of states, G(w), from the Molecu-lar Dynamics simulation at 0 GPa and 300 K. 5-b: Raman spectrum of InSb, reference 8. G(w) from the Deformable Bond Model, ref-erence 7. 5-c: G(w) from the Deformable Bond Model, refref-erence 7. 5-d: phonon dispersion curve for InSb, reference 9.
Figure 6(a) shows the effect of the temperature variation on G(ω), for 300, 600, and 900 K. The simulations were performed from 200 to 1100 K, in steps of 50 K. Figure 6(b) displays the temperature dependence of the longitudi-nal (LO) and transverse (TO) optical phonon frequencies of InSb obtained by Raman scattering experiment[28] and the maximum of the optical band of the density of states, from the MD simulation. From a linear fitting approxima-tion, the temperature frequency coefficients(∂ωLO/∂T)P,
(∂ωTO/∂T)P and(∂ωop/∂T)P are 0.026, 0.016, and -0.025 cm−1K−1, respectively.
Figure 6. 6(a): Vibrational density of states G(w) at 300, 600 and 900 K. 6(b): a) and b) temperature dependence of the longitudinal and transverse optical phonon frequencies from Raman scattering, respectively and (c) temperature dependence of the maximum of G(w) in the optical range obtained by molecular dynamics simula-tion. The full lines are linear fitting approximations.
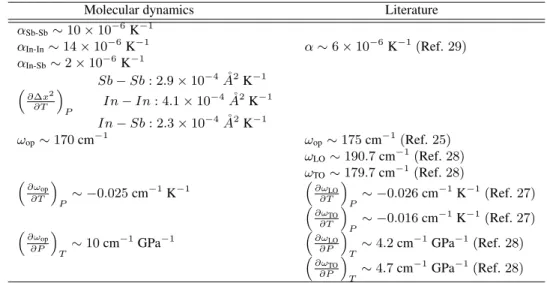
TABLE III: Values of the physical constants obtained by Molecular Dynamics simulations and from the literature. αSb−Sb, αIn−In,
αIn−Sb,are the mean thermal expansion coefficient between 300 and 900 K.(∂∆x
2
)/∂T)P,is the temperature coefficient for the squared
atomic amplitude oscilation.ωop,is the maximum of the optical band and(∂ωop/∂T)P,and(∂ωop/∂P)T,are it temperature and pressure
coefficient, respectively.(∂ωLO/∂T)P,(∂ωT O/∂T)P,(∂ωLO/∂P)T,(∂ωT O/∂P)T,are the temperature and pressure frequency
coeffi-cients for the longitudinal and transverse optical phonons, respectively.
Molecular dynamics Literature
αSb-Sb∼10×10−6K−1
αIn-In∼14×10−
6
K−1 α∼6×10⁻⁶K−1(Ref.29)
αIn-Sb∼2×10⁻⁶K−1
Sb−Sb: 2.9×10⁻⁴A˚2K−1
∂∆x2
∂T
P In
−In: 4.1×10⁻⁴A˚2K−1
In−Sb: 2.3×10⁻⁴A˚2K−1
ωop∼170cm−1 ωop∼175cm−1(Ref.25)
ωLO∼190.7cm−1(Ref.28)
ωTO∼179.7cm−1(Ref.28)
∂ω op
∂T
P
∼ −0.025cm−1K−1
∂ω LO
∂T
P
∼ −0.026cm−1K−1(Ref.27) ∂ω
TO
∂T
P
∼ −0.016cm−1K−1(Ref.27) ∂ω
op
∂P
T
∼10cm−1GPa−1
∂ωLO
∂P
T
∼4.2cm−1GPa−1(Ref.28)
∂ωTO
∂P
T
∼4.7cm−1GPa−1(Ref.28)
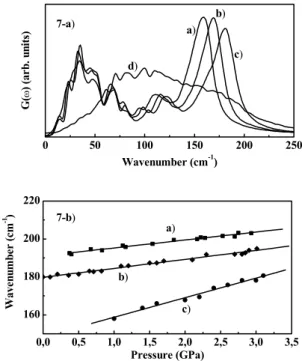
Figure 7(a) shows the dependence of the G(ω) with the hydrostatic pressure. There are two main effects of the pressure on G(ω): (i) an anharmonic frequency shift to high frequencies up to 3.0 GPa and (ii) a structural cu-bic to orthorhomcu-bic phase transition, denounced by the dra-matic change in G(ω)at about 3.2 GPa. Figure 7(b) dis-plays the pressure dependence of the longitudinal optical phonon of crystalline InSb from Raman scattering[29] and of the maximum of G(ω). From a linear fitting approxi-mation, the pressure frequency coefficients (∂ωLO/∂P)T,
(∂ωTO/∂P)T, and(∂ωop/∂P)T are 4.2, 4.7, and 10 cm−1 GPa−1, respectively. Finally, Table III summarizes all
nu-merical values obtained from the present simulation, show-ing also the experimental values disponible in the literature.
5
Conclusions
In conclusion, isoenthalpic-isobaric molecular dynamics simulations to study the pressure and temperature influence on structural and dynamical properties of InSb was success-fully performed using the effective potential which takes into account two and three-body interactions. The zinc-blende to orthorhombic structural transformation is very well described, in excelent agreement with experimental ob-servation. The calculated volume change, before and after transformation, are also in excellent agreement with those observed in experiments. Furthermore, structural parame-ters such as bond length and coordination number are cor-rectly reproduced.
From the pair distribution function, the thermal expan-sion coefficient was obtained, in excellent accord with the experimental value. Furthermore, the temperature depen-dence of the dynamical Debye-Waller factor was also ob-tained. From the vibrational density of states, the
temper-ature and pressure phonon anharmonicity was correctly de-scribed, in excellent accord with results from Raman scatter-ing. As the interatomic potential describes very well static and dynamic properties of InSb, it can be used to simulate and preview new properties in several different experimental conditions.
Acknowledgments
This work was parcially supported by Fundac¸˜ao de Am-paro `a Pesquisa do Estado de S˜ao Paulo - FAPESP and Conselho Nacional de Desenvolvimento Cient´ıfico e Tec-nol´ogico - CNPq.
References
[1] M. Parrinello and A. Rahman, Phys. Rev. Lett. 45, 1196 (1980); M. Parrinello and A. Rahman, J. Appl. Phys.52,7182 (1981).
[2] K. Asaumi, O. Shimomura, and S. Minomura, J. Phys. Soc. Jap.41,1630 (1976).
[3] O. Shimomura, K. Asaumi, N. Sakay, and S. Minomura, Phi-los. Mag.34,839 (1976).
[4] S.C. Costa, P.S. Pizani, and J.P. Rino, Phys. Rev. B, 66, 214111 (2002).
[5] S. C. Yu, I. L. Spain, and E. F. Skelton, Solid State Commun.
25,49 (1978).
[6] C. A. Vanderborgh, Y. K. Vohra, and A. L. Ruoff, Phys. Rev. B40,12450 (1989).
[7] R. J. Nelmes, M. I. McMahon, P. D. Hatton, J. Crain, and R. O. Piltz, Phys. Rev. B47,35 (1993).
[9] S. B. Zang and M. L. Cohen, Phys. Rev B 35, 7604 (1987). [10] G. Y. Guo, J. Crain, P. Blaha, and W. M. Temmermen, Phys.
Rev. B 47, 4841 (1993).
[11] A. A. Kelsey and G. J. Ackland, J. Phys. Condens. Matter 12, 7161 (2000).
[12] F. H. Stillinger and T. A. Weber, Phys. Rev. B 31, 5262 (1985).
[13] S. Erkoc¸ Phys. Reports.278,79 (1997) (in this paper several empirical interaction potentials are discussed).
[14] F. Shimojo, I. Ebbsjo, R. K. Kalia, A. Nakano, J. P. Rino, and P. Vashishta, Phys. Rev. Lett.84,3338 (2000).
[15] I. Ebbsjo, R. K. Kalia, A. Nakano, J. P. Rino, and P. Vashishta, J. Appl. Phys.87,7708 (2000).
[16] W. Li, R. K. Kalia and P. Vashishta, Phys. Rev. Lett.77, 2241 (1996).
[17] R. K. Kalia, A. Nakano, K. Tsuruta, and P. Vashishta, Phys. Rev. Lett.78, 689 (1997).
[18] R. K. Kalia, A. Nakano, A. Omeltchenko, K. Tsuruta, and P. Vashishta, Phys. Rev. Lett.78, 2144 (1997).
[19] M. P. Allen and D. J. Tildesley, ”Computer Simulation of Liquids”, Clarendon Press - Oxford (1997).
[20] A. Nakano, R. K. Kalia, and P. Vashishta, J. Non-Crsyt. Solids171, 157 (1994).
[21] J. P. Rino, A. Chatterjee, I. Ebbsj¨o, R. K. Kalia, A. Nakano, F. Shoimojo, and P. Vashishta, Phys. Rev. B 65,195206-1 (2002).
[22] A. Guinier,X-Ray Diffraction in Crystals, Imperfect Crystals and amorphous Bodies(W. H. Freeman and Company, San Francisco, 1963), Chap. 7.
[23] K. Kunc, M. Balkanski and M. A. Nusimovici, Phys. Status Solidi (b) 72, 229 (1975).
[24] W. Kiefer, W. Richter and M. Cardona, Phys. Rev. B, 12, 2346 (1975).
[25] D. L. Price, J. M. Rowe and R. M. Nicklow, Phys. Rev. B, 3, 1268 (1971).
[26] G. Landa, Spectrometrie Raman des Materiaux III-V Desor-donnes, Ph. D. Thesis, Universit´e Paul Sabatier, Toulouse, France (1990).
[27] R. Carles, G. Landa and J. B. Renucci, Solid State Commun. 53, 179 (1985).
[28] E. Liarokapis and E. Anastassakis, Phys. Rev. B 30, 2270 (1984).
[29] K. Aoki, E. Anastassakis and M. Cardona, Phys. Rev. B, 30, 681 (1984).
[30] Numerical Data and Functional Relationships in Science and Technology, edited by O. Madelung, M. Schulz and H. Weiss, Landolt-B¨ornstein, New Series, Group III, Vol. 17a, Pt. 327 (Springer-Verlag, Berlin, 1982).