A Work Project, presented as part of the requirements for the Award of a Master’s Degree in
Management from NOVA – School of Business and Economics
Voluntary Disclosure of Financial Ratios: Evidence from Portuguese Listed Companies
Inês de Figueiredo Tavares Batista, No. 2333
A Project carried out in the Accounting and Auditing Area, with the supervision of:
Professor Leonor Ferreira
2 Title: Voluntary Disclosure of Financial Ratios: Evidence from Portuguese Listed Companies Abstract: While financial ratios are a useful tool to provide financial information, their disclosure
remains mostly voluntary. This Work Project studies the extent, presentation and determinants of
voluntary disclosure of financial ratios in the annual reports of 43 Portuguese listed companies.
Results show that, on average, ratio disclosure is low, there is great disparity in terminology and
there is some discrepancy in presentational features. Only the external auditor being one of the Big
Four is significantly associated with higher disclosure. These conclusions alert to the need for
tighter guidelines on extent, computation and presentation of financial ratios voluntarily disclosed.
Keywords: Financial Ratio, Voluntary Disclosure, Annual Reports, Portuguese Listed Companies
1. INTRODUCTION
Beattie and Pratt (2002) ascertained that information of financial nature is the most valued category
of voluntary disclosure for all types of users1. Ratios are one of the tools that can be used to provide
this information and they have several benefits. As Agyei-Mensah (2015) summarizes, ratios
facilitate the interpretation and understanding of the financial information being conveyed in the
report, by highlighting in a simple manner key facts and figures and they can present information
that is not readily observed in other parts of the report. In addition, the presentation of information
in the form of ratios allows comparisons not only with other companies and industry averages, thus
enabling a better evaluation of the firm’s performance, but also between companies of different
sizes. Moreover, Gibson (2011) highlights how different ratios provide a wide variety of
information and how they are useful for a number of users. As such, financial ratios can be
considered a valuable tool for communicating financial information, since they synthesize and
3
emphasize key data.
According to International Accounting Standard (IAS) 332, whichapplies to consolidated accounts
of companies with shares listed in European Union (EU) regulated markets, companies are required
to present one financial ratio: earnings per share (EPS). This standard outlines how firms should
calculate both the basic and the diluted EPS. Apart from the EPS, however, it is not mandatory to
disclose any other financial ratio and, thus, their presentation falls under the voluntary disclosure
category3. In Portugal, companies must also comply with the Companies Business Code (CSC,
Código das Sociedades Comerciais). It states that companies must prepare a management report
and financial statements for each fiscal year that present a clear picture of business evolution,
performance and results (CSC, Articles 65th, 66th and 66th-A), and that these documents must be
readily available for interested users (CSC, Article 70th). However, the Code does not detail which
information should be presented or how it should be disclosed, thus leaving room for disparity in
the tools used for reporting, terminology used and computation of indicators. Further, Beattie
(2005), apudWalker (1997), highlights how disclosure decisions are influenced by “the objectives
of corporate executives; financing requirements of companies; managerial incentives; and how
third parties use corporate disclosures” (Beattie, 2005, p. 101).
Hence, due to the aforementioned relevance of financial ratios and the lack of regulation on them,
it is important to find evidence on the extent and presentation of voluntary disclosure of financial
ratios and what influences said disclosure. This Work Project is divided into six sections.
Subsequent to the Introduction, Section 2 provides a theoretical overview on financial ratios and
their possible groupings and Section 3 discusses findings in previous empirical research. Section 4
outlines the research questions, methodology, the sample and data, while Section 5 presents and
4
discusses the results. Finally, Section 6 summarizes the conclusions of the study, its limitations and
presents suggestions for future research.
2. NORMATIVE LITERATURE
A ratio is a meaningful relationship between two items, a numerator and a denominator,
represented by numbers4, which allows for a comparison between the two. A financial ratio is,
then, the relationship between items of financial nature, arising from financial statements and
capital market data.
Grouping of financial ratios is not consensual and terminology used is not harmonized, which can
generate difficulties in preparing and interpreting ratio data. According to Gibson, “a standard list
of ratios or standard computation of them does not exist” (Gibson 2011, p. 187). Weston &
Copeland (1992) group financial ratios into liquidity ratios, leverage ratios, activity ratios,
profitability ratios, growth ratios and valuation ratios. Gibson (2011) groups the most utilized
ratios into five categories: liquidity ratios, borrowing capacity/leverage ratios, profitability ratios,
cash flow ratios and a special group of ratios relevant for investors. Yet, Gibson (1987) had
previously grouped them as liquidity, debt, profitability, “other” and uncategorized ratios, while
recognizing that “a single ratio may measure more than one aspect of a firm’s financial health”
(1987, p. 74). More recently, Gitman & Zutter (2012) suggest five categories of financial ratios,
as follows: liquidity ratios, activity ratios, debt ratios, profitability ratios and market ratios.
Furthermore, Dun & Bradstreet consider only three categories for the ratios it presents as the Key
Business Ratios5: solvency, efficiency and profitability. Appendix I describes the categories
considered by these authors.
4 According to Merriam-Webster dictionary: https://www.merriam-webster.com/dictionary/ratio
5
As all of the aforementioned authors highlight, ratios only have meaning when compared to other
ratios, either those of other companies in the same industry or line of business, industry averages,
the firm’s own past ratio for evolution analysis or a combination of all of these. Furthermore, as Gitman & Zutter (2012) point out, in order to get an overall picture of a company’s performance,
the analysis of a single ratio is seldom enough.
Limitations to the use of financial ratios
However useful financial ratios may be, their use is subject to some limitations and should observe
a higher level of caution. As Weston & Copeland (1992) alert, firstly companies may treat
accounting data differently (e.g. depreciation methods, treatment of R&D expenses) or apply
different accounting regulations. Secondly, attention must be paid to the fiscal year of the
companies being compared, as seasonality and production cycle might be factors that distort the
comparison. Thirdly, because accounting information can be manipulated, users of financial ratios
should be aware that good ratios do not necessarily indicate good performance and management,
and must learn more about the company and its operations to verify them. Gibson (2011) adds that
problems may arise when computing ratios that use balance sheet and income statement items,
since the balance sheet reflects a static point in time, while the income and cash flow statements
cover events over a period of time.6 Further, Lev & Sunder (1979) alert for methodological issues
in the two main uses of financial ratios – as control for size and as control for industry-wide factors7.
Sector-specific ratios – Banks
In the EU, the banking sector has additional requirements on capital, liquidity and leverage,
implemented in the scope of the Basel III agreement, consisting of the capital requirements
6 To deal with this problem, averages of period-beginning and period-end balance sheet figures can be used; however, this does not cover the issues of seasonality and cyclicality.
6
regulation (CRR) and the capital requirements directive (CRD IV)8. These mandate banks to keep
certain ratios within certain values and to disclose them. In addition, banks’ financial statements
present specificities due to the nature of their operations. As such, their financial ratios (particularly
voluntary ones) are hardly comparable to those of other companies.
Agency theory and signaling theory
When considering the potential reasoning for disclosure of financial ratios, two theories emerge.
According to agency theory, more information may be disclosed in order to reduce information
asymmetry and decrease agency costs, which arise from the principal (i.e. the owner of the
company) being a separate entity from the agent (i.e. the manager). In light of signaling theory,
companies with good performance and position in the market wish to demonstrate this to the public,
in order to attract more investors, and thus disclose more information (e.g. in the form of ratios)
under these situations.
3. PREVOUS EMPIRICAL RESEARCH
Specific research on disclosure of financial ratios is scarce, with the majority of them being
conducted on developing countries like Malaysia (Abdullah, 2005; Amran & Aripin, 2015) and
Ghana (Agyei-Mensah, 2015), but also in Australia (Rahmat, 2001) and the U.K. (Watson et. al,
2002). Most studies on voluntary disclosure focus on information in general and explore the
influence of factors such as corporate governance (board composition and ownership structure) and
company characteristics (size, profitability and industry) on disclosure (voluntary or otherwise) of
different types of information, particularly strategic, financial, and non-financial. Some of these
studies focus on individual countries or regions like Spain (Giner, 1997), Singapore (Eng, 2003;
Cheng, 2006), Kenya (Barako, 2006) and the Iberian Peninsula (Alves et. al, 2012), whereas Meek
7
et al. (1995) pursued a comparative study between the U.S., U.K. and Continental Europe. Yet
other studies provide a review of existing literature (Ahmed & Courtis, 1999; Healy & Palepu,
2001; Core 2001).
Giner (1997) found that size, being audited by one of the Big Six auditing firms9 and being quoted
on several stock exchanges was associated with higher levels of disclosure of financial information.
Interestingly, she also found that regulation, even if not compulsory, increased disclosure by
companies. Eng’s (2003) results show that while managerial ownership was negatively associated
with lower levels of voluntary disclosure, government ownership was positively associated with
higher levels of this type of disclosure; total block holder ownership was not associated with
disclosure levels and a higher proportion of outside (non-executive) directors led to lower levels of
voluntary disclosure. Cheng (2006) concluded that a higher proportion of independent
non-executive directors is associated with higher levels of voluntary disclosure and that boards
dominated by a majority (>50%) of independent directors displayed significantly higher levels of
voluntary disclosure as opposed to those, while CEO-Chairman duality relationship with voluntary
disclosure was not significant. Barako (2006) found that the proportion of outside (non-executive)
directors and shareholder concentration were both associated with lower voluntary disclosure
levels. However, the presence of an audit committee, a higher proportion of foreign ownership and
of institutional ownership, higher leverage and bigger size are associated with higher levels of
voluntary disclosure. As for the existence of an external audit firm, profitability and liquidity, these
were not significant.
Meek et al. (1995) studied voluntary disclosure for the U.S., U.K. and Continental-European
multinational corporations and found that, for financial information, U.S. and
8
European companies disclose more than British companies and international listing leads to higher
levels of disclosure. Also, size and industry also influence disclosure of financial and non-financial
information. Overall, European companies lead in the levels of voluntary disclosure. Alves et al.
(2012) conducted a similar study for Iberian Peninsula listed companies. Resorting to a disclosure
index based on the level of detail of disclosure of 60 indicators10, they evaluated the influence of
corporate governance and corporate characteristics on the disclosure of voluntary information
pertaining to six categories11. The results show that firm size largely influences voluntary
disclosure. Other main determinants of global disclosure are growth opportunities, performance,
board compensation and the presence of a large shareholder12. Ahmed & Courtis (1999) performed
a meta-analysis and compiled the results of several studies on disclosure. They found that corporate
size, listing status13, financial leverage and profitability are positively related with voluntary
disclosure, while audit firm size did not have significant relationships.
Turning the focus to financial ratio disclosure, Williamson (1984) analyzed the annual reports of
some of the largest industrial companies in the U.S. to learn which financial ratios were disclosed
and whether they were selectively reported. The most reported ratio was return on equity, disclosed
by 58% of companies analyzed. It was also found that there is selective reporting for return on
equity, current ratio and return on sales, as reporting companies had significantly better values than
non-reporting ones14. Houghton & Woodliff (1987) studied the potential of financial ratios in
predicting company performance (measured by EPS) and concluded that previous years’ financial
10 The level of detail of disclosure was scored as zero if no information about the indicator was disclosed, one if there was disclosure without detail and two if information disclosed on the indicator was detailed.
11 Strategy, market and competition, management and production, marketing, future perspective and human capital. 12 Measured by the proportion of shares held by the largest shareholder.
13Measured as “unlisted versuslisted” and “listed versusmultiple listed”.
9
ratios are able to discriminate failed from non-failed firms and, for the latter, the relative success
of firms (when separated into high or low EPS). They also concluded that financial information
users, particularly accounting students and bankers, were able to use financial ratio data to predict
company failure or success. Rahmat (2001) studied financial ratio disclosure by Australian listed
companies and focused on where ratios are disclosed in annual reports, which ones are most
frequently reported and how they are computed. He found that financial ratios are most frequently
located in the financial summary and financial highlights sections and that the three most frequently
disclosed ratios are dividend per share, gearing ratio and interest cover. He also found great
inconsistency in computation methods (e.g. 12 different formulae for the gearing ratio, nine for
return on sales and seven for return on shareholders’ equity). Watson et al. (2002), studying the
determinants of voluntary disclosure of financial ratios in the U.K., found that industry is an
important factor and that media and utilities companies are less likely to disclose. Size is positively
associated with disclosure, though performance measures, like return on investment, gearing and
profitability, have contradicting effects in different years. They also found that investment ratios
and liquidity ratios are the most and least disclosed categories, respectively. Abdullah (2005)
analyzed voluntary accounting ratio disclosure in the top 100 companies listed in Malaysia in 2003.
He found that the mean number of ratios disclosed was 3.53, while the average index value15 was
0.252. The most common type disclosed was investment ratios, while liquidity was the least
common type, and the most disclosed individual ratio was net tangible assets per share. Through
an Ordinary Least Squares (OLS) regression, it was also found that size and liquidity are positively
associated with voluntary ratio disclosure and that plantation companies disclosed more than those
from other sectors. Amran & Aripin (2015) also analyzed the top 100 listed Malaysian companies
10 in 2011, but looked only for the “10 mostly referred and cited financial ratios”16 (Amran & Aripin,
2015, p. 157) and computed an index – Extent Financial Ratio Disclosure (EFRD) – where the number disclosed by each company is divided by 10. It was found that sample firms disclose on
average 18.4% of the selected ratios and that the most disclosed ratio is net assets per share.
Regressing EFRD on company characteristics, only the corporate governance score (percentage of
independent directors to total number of directors on the board of directors) has a significant
positive effect on the EFRD. Agyei-Mensah (2015) also resorted to the construction of an index,
also referred to as EFRD, but considering all the ratios, when studying voluntary ratio disclosure
in Ghana’s listed companies in 2012. He found that the average EFRD is 62.78%, ranging between
50% and 75%, though the maximum number of ratios disclosed by a company was not reported.
In addition, return on investment17, a measure of firm performance, had significant positive
relationship with the EFRD, as well as leverage18.
As can be observed from the previous literature, results are often disparate and, apart from size,
which is consistently positively associated with voluntary disclosure, studies do not agree on which
variables mostly affect it or in which direction. This literature, though insightful and relevant for
each of the countries it approaches, cannot provide many conclusions for the case of Portugal. This
Work Project fills this void, by adding to the existing literature on financial ratio voluntary
disclosure that by Portuguese listed companies, and contributes to a better understanding of what
the scenario is in this country, namely if Portugal differs significantly from other countries.
4. RESEARCH DESIGN
The purpose of this study is to get insight into the voluntary disclosure of financial ratios by
16 These ratios are: net assets per share, return on equity, return on assets, gearing, dividend payout, dividend yield, return on shareholder, price to earnings, gross profit margin and debt-to-equity.
17 Measured as dividend per share.
11
Portuguese listed companies, by analyzing the extent, presentation and determinants of said
disclosure in the annual reports. Six research questions were designed to properly investigate these
aspects of voluntary disclosure, each focusing on a different topic under analysis. The first five
questions concern the extent and characteristics of presentation of voluntary ratios disclosed.
RQ1: Which ratios and ratio categories are disclosed? What are the most disclosed ratios and
categories?
RQ2: Is the formula used to calculate the ratios disclosed?
RQ3: Which format (table, text or chart/graph) is used in the presentation of ratios?
RQ4: Are ratios repeated throughout the report?
RQ5: Are ratios from the previous period presented?
Question six concerns company characteristics and whether they influence voluntary ratio
disclosure:
RQ6: What are the determinants of voluntary disclosure of financial ratios?
Methodology
The period under analysis is 2014 and data was hand-collected directly from the companies’ consolidated annual reports, as well as a CMVM report19. The scope of this research is limited to
the study of voluntary disclosure of financial ratios. Thus, information on earnings per share (EPS)
was not collected.
A database was constructed in an excel spreadsheet20, into which the following information was
collected: ratios displayed, their location and form of presentation, whether they were repeated in
the report, what type of ratios were disclosed and the following company characteristics: net assets,
net income, debt-to-equity ratio, industry, number of independent directors in proportion to total
12
number of members of the Board of Directors, whether the company was a holding, external auditor
and percentage of shares held by the largest shareholder.
It is clear, from Section 2, that consensus in grouping financial ratios has not been achieved. For
this Work Project, the ratio categories considered for data treatment were established taking into
account i) the availability of ratio listings, to ease the process of attributing the appropriate category
to each ratio, and ii) the level of agreement amongst the authors in terms of ratio allocation, that is,
how many authors consider a certain ratio to belong to a certain category as opposed to another.
The categories considered were Profitability, Liquidity, Debt, Activity and Valuation, as well as
an “Other” category for ratios that could not be allocated based on any source.
The designed research questions were answered based on univariate analysis of the data on ratios
voluntarily disclosed in the reports (RQ1 through RQ5) and multivariate data analysis, through the
computation of a disclosure index and OLS regression (RQ6).
Sample
The sample was selected using judgment sampling based on market capitalization and trade
volume, since these are the most relevant factors for shareholders and other stakeholders. From a
total of 57 Portuguese companies listed in Euronext Lisbon in 2014, 10 batch trade companies were
excluded, due to their reduced role in the stock market. Companies classified as “Banks”21
according to the Industry Classification Benchmark (ICB) were eliminated as well, due to their
sector-based specificities and added requirements in ratio disclosure. The final sample is thus
composed of 43 companies, representing 75% of the total number of Portuguese companies listed
in Euronext Lisbon in 2014. The year 2014 was chosen since it was the most recent year for which
13
all of the reports were available at the time data collection was initiated22.
Data was retrieved from the companies’ annual reports for 2014, which were downloaded from the companies’ websites. It was hand-collected through content analysis of each report, resorting to
the advanced word-search program embedded in Adobe Reader to locate the ratios throughout the
files and skimming extents of the reports likely to have ratio data that the word-search might have
missed (namely, sections on financial analysis). It was noted, during the process, the extent of the
reports (up to 460 pages), variability of ratio names and terminology (which increased difficulty in
the use of word-search) and the existence of several ratios not relevant to the study – namely, year-to-year growth ratios. Moreover, this method is not without risk, since there is the possibility of
not detecting some ratios (particularly those presented with an uncommon name and, hence, not
searched for). Most of the annual reports consist of a single document containing the Management
Report, Corporate Governance Report and Financial Statements23. Some reports do not follow this
formal separation, but have a text document separated into different chapters.24 However, relevant
information was found for all companies.
The average size of the companies, as measured by consolidated net assets, is € 2,871 Million; the
biggest company is EDP, with € 42,873 Million, while the smallest is LISGRÁFICA. As for net income, the proxy used for company performance, the average value is € 55.9 Million, with the
maximum belonging to EDP, with € 1,264 Million, and the minimum to PHAROL SGPS, which presented a loss for the year 2014 of € -289 Million. Average leverage ratio (D/E) is 20.7x, with
the highest value observed for SLBENFICA FUTEBOL SAD (747.2x) and the lowest being a negative
22 The Sociedades Anónimas Desportivas’s fiscal year runs from July 1st to June 30th; thus, for these, the reports analyzed are the ones from fiscal year 2014-2015, the most recent ones available.
23 An exception was noted for SONAE, which presented a separate document for each of these sets of information.
24 E.g. GALP does not have a separate management report and instead has six chapters, one of which –“Commitment to stakeholders” –includes a “Corporate governance” subchapter, while the financial statements are a subchapter of “Appendices”; NAVIGATOR
14
value (-42.7x) observed for SDCINVESTIMENTOS, due to negative equity. The average percentage
of independent directors to total number of members of the Board of Directors (BoD) is 19%,
corresponding to one in five members being independent. Sixteen present no independent directors
and the maximum percentage (55.6%) is found in SONAE SGPS, for which out of a total of nine
members of the BoD, five are independent. Ten Industries and 15 SuperSectors25 are identified.
Construction & Materials and Industrial Goods & Services are the most represented SuperSectors,
with six companies each. Out of the 43 companies in the sample, 27 (62.8%) are holdings. As for
the external auditor, most companies are audited by one of the Big Four and only seven out of the
43 companies (16.3%) did not resort to them. On average, the top shareholder holds 55.3% of the
company’s shares. The biggest top shareholder is found in LUZ SAÚDE, with a 98.2% share, while
the smallest is found in CTT, holding 6.7%.
Ratio Data
For ratio data collection, all consolidated ratios were considered; for companies that presented both
types of ratios, individual ones were ignored; where type of ratio was not specified, all were
collected, unless clearly indicated that it was individual26.
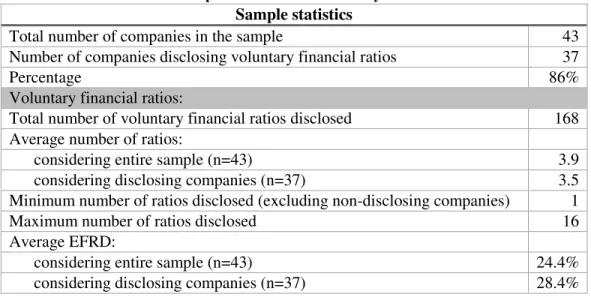
Out of the 43 companies analyzed, only six27 (14%) do not disclose any voluntary financial ratios,
which is to say, 37 out of 43 companies (86%) disclose at least one ratio in the annual report. A
total of 168 voluntary financial ratios is identified, resulting in an average of 3.9 ratios per annual
report. Considering only companies that present ratios, this number rises to 4.5 ratios per report.
Both values are considered low. The number of financial ratios voluntarily disclosed by each
company ranges from one to 16 (excluding companies that do not present any ratios). There are
25 The level of SuperSector is used to allow identification of Banks.
26 A column in the excel spreadsheet database indicates the nature (individual or consolidated) of the ratios collected.
15
five companies presenting only one ratio, while CTT presents a total of 16 ratios. Considering the
Extent of Financial Ratio Disclosure (EFRD), an index in which the number of ratios disclosed by
a company is divided by the maximum observed (i.e. 16), the average EFRD stands at 0.244. This
is in line with the results obtained by Abdullah (2005) in Malaysia, but considerably lower than
what Agyei-Mensah (2015) observed in Ghana28. This index increases to 0.284 when only
companies disclosing ratios are taken into account.
Table 1 - Descriptive statistics on voluntary ratio disclosure
Sample statistics
Total number of companies in the sample 43
Number of companies disclosing voluntary financial ratios 37
Percentage 86%
Voluntary financial ratios:
Total number of voluntary financial ratios disclosed 168
Average number of ratios:
considering entire sample (n=43) 3.9
considering disclosing companies (n=37) 3.5
Minimum number of ratios disclosed (excluding non-disclosing companies) 1
Maximum number of ratios disclosed 16
Average EFRD:
considering entire sample (n=43) 24.4%
considering disclosing companies (n=37) 28.4%
The vast majority of ratios disclosed (81.5%) are located in the Management Report. Only one ratio
(0.6%) is found in the Corporate Governance Report29. Considering companies that disclose ratios,
94.6% of them present them in the Management Report30 and 70.3% only present ratios there.
Though in the overall sample there are more ratios in the Highlight Section (12.5%) than in the
Notes to Financial Statements (5.4%), there are more companies presenting ratios in the Notes
(16.2%) than in the Highlight Section (10.8%).
28 Even though Agyei-Mensah (2015) does not exclude banks from his sample, a preliminary analysis including banks showed similar results, so comparison is still relevant.
29 Net debt/capital employed ratio, in IBERSOL SGPS’s annual report.
16
There is significant correlation between the number of voluntary ratios disclosed in the annual
reports and whether the auditing firm is one of the Big Four (R2=0.13, p-value=0.02), meaning that
the external auditor being one of these companies is associated with higher disclosure of voluntary
financial ratios. There is, however, no correlation between the number of voluntary ratios disclosed
and the number of pages (R2=0.01, p-value=0.47), company size31 (R2=0.00, p-value=0.75) or
profitability32 (R2=0.01, p-value=0.47).
5. RESULTS
Financial Ratios and Categories of Ratios Disclosed (RQ1)
The analysis of financial ratios disclosed in the annual reports required an intermediate step:
standardizing the names of the ratios observed. Firstly, terminology was not homogeneous and
some ratios were presented in different reports under different names. In particular, equity to assets
ratio was presented under seven different names33 and EBITDA margin was presented with six
different names34. Secondly, another difficulty emerged as some ratios with the same name were
computed differently among companies. This is the case of gearing ratios, calculated as either debt
to equity, net debt to capital employed or net debt to equity. These were, hence, grouped based on
formula rather than name. In addition, simplification was necessary for the standardization of some
ratios. For example, EBITDA margin not including Guaranteed Income Provisions and Recurring
EBITDA margin are both standardized as EBITDA margin, though slight differences in
computation apply. As this was required for the analysis at hand and the focus of this study is not
on formulae variability, this is not considered to constitute a limitation. A full list of ratios found,
their standardized name and category is disclosed in Appendix IV. The total number of ratios
31 Proxied by consolidated Total Assets. 32 Proxied by consolidated Net Income.
33 Excluding cases where the report was only available in Portuguese.
34Excluding cases where the report was only available in Portuguese and excluding variations in formulae, where simplification
17
observed in the sample is 168. After standardization, 51 uniquely defined ratios are identified – i.e. in terms of variety of information conveyed by ratios, there are 51 different ratios in the sample.
The most frequently disclosed financial ratio is EBITDA margin, which accounts for 34 of the 168
ratios observed (20.2%). The second most popular ratio is EBIT margin, comprising 17 out of 168
(10.1%)35. EBITDA provides a measure of a company’s operating profitability, i.e. of the profit it
can generate from its core operations, disregarding costs that are not directly associated with
business decisions. EBIT margin follows a similar logic, but does not exclude depreciation and
amortization costs. These results show the importance companies place on displaying their
operating profitability, but are not in line with previous research, where the most frequently
disclosed ratios were return on equity (Williamson, 1984), dividend per share (Rahmat, 2001) (i.e.
ratios focused on the shareholder) or net tangible assets per share (Abdullah, 2005). Thirty of the
168 ratios(17.9%) are disclosed only once in the sample. Thirty-one out of the 37 companies that
disclose ratios (83.8%) disclose the EBITDA margin at least once in the annual reports, while the
EBIT margin is disclosed at least once in the reports of 16 companies (43.2%). Thirty-one
companies (83.8%) present only one ratio in their report (though they may repeat that ratio
throughout the report).
Ratios observed were allocated to the six categories defined in Section 4. All categories are present
at least once in the sample. No company presents all types of ratio categories. 12 companies
(32.4%) disclose ratios belonging only to one category. CTT presents the biggest variety of ratio
categories, disclosing ratio belonging to five categories and only missing Activity ratios. The most
frequently disclosed ratio category is Profitability, observed in the annual reports of 34 out of the
35 These values do not represent the number of companies disclosing each ratio, nor do they include times the same ratio was repeated with the same formula in a report. This is because, for standardization purposes, similar ratios with slight differences in
18
37 disclosing companies (91.9%)36, while the
least observed category is Liquidity, only
present in CTT’s report (2.7%). Considering
all 168 ratios found in the sample, 83 (49.4%)
are Profitability ratios, whereas only one
(0.6%) is a Liquidity ratio. These results are
partially in line with previous research, where Liquidity ratios were the least disclosed, but the
most frequent category was Investment (Watson et al., 2002; Abdullah, 2005).
Formula (RQ2)
Out of the 168 ratios found in the sample, 85 (50.6%) ratios disclosed are not accompanied by the
formula used to calculate them. Contrarily, 83 (49.4%) include the formula used to calculate them.
This is done in different ways: the ratio’s name is directly its formula, its computation method is
presented with the ratio, or there is a glossary section in the report. Looking at the companies, only
three (8.1%) present the formula for all the ratios they disclose. In particular, SAGGEST SGPS
includes the formula for all the 13 ratios it discloses. Conversely, 16 companies (43.2%) do not
present the formula for any ratio they disclose, while 18 (48.6%) include the formula for some
ratios, but not for others. CTT, which discloses the largest number of ratios (16), presents the
formula for 11 of them. The absence of formula for some of the ratios disclosed negatively impacts
understandability and interpretation by the users, particularly for those with less financial literacy,
and even more so taking into account that some ratios could not be identified only by the name
(e.g. gearing ratios). Further, it makes comparability between companies or with industry averages
more difficult, when this should be one of the most useful features of ratios. Additionally, this
36 No Profitability ratio is found in the annual reports of EDP,REN and OREY, but all present a positive result for the period. Figure 1 – Ratios disclosed by category
Nu
mb
e
r o
f r
at
19
affected the study, mainly at the stage of standardization for ratio counting, as discussed in RQ1.
Format (RQ3)
There are three ways in which a ratio can be presented: in a
chart or graph, in a table or as text. Graphs are more visual and
thus are more immediately seen and perceived by the reader
(Beattie et al., 2000), while tables are also instruments for
communication (Wainer, 1992) and make data more apparent
than text. As such, when a ratio was repeated and appeared in
more than one format, the most noticeable one was recorded according to the aforementioned order
(chart/graph > table > text). The most frequently occurring format to display ratios in the annual
reports, used for 107 of the 168 ratios (63.7%) is tables, followed by text (38 ratios, or 22.6%) and
finally charts or graphs (23 ratios, or 13.7%). Only 11 out of the 37 companies (29.7%) use charts
to depict financial ratios in the reports, while 26 (70.3%) include ratios in tables throughout the
report and 21 (56.8%) present them inside text portions. These results show that the preferred
format to disclose ratios is in a table. Tables are widely used in annual reports, as per observation
during data collection, and they summarize mainly numeric data. They are also useful for the
purpose of comparing values one of the main ways ratios are used. It thus makes sense that ratios
are extensively included in them. On the other hand, since charts are more immediately visible,
ratios may be selectively reported in this format when companies wish to highlight them.
Repetition (RQ4)
As for whether the financial ratios were repeated throughout the report, it was found that 39.9%
appeared in each report two or more times, while 60.1% only appeared once. At company level, 32
companies (86.5%) repeat at least one of the ratios they present, while five (13.5%) do not repeat
20
any of the ratios37. Only five companies (13.5%) repeat all the ratios disclosed. Some ratios are
repeated with different names in the same annual report38 and were only realized to be the same
through the formula, value or name comparability (that is, ratio names that are known to be
equivalent and have the same computation). This poses a problem for interpretation in general, as
it might confuse the users of financial reports. More attention should be paid to this aspect of ratio
presentation. Repeated ratios may be so in order to highlight the information they present, since
repetition means that those values can be viewed more than once.
Previous period (RQ5)
Most ratios observed, 86.9%, present their value for 2014 and the previous period, while 13.1%
only present the value for the year under study. Since the majority of ratios disclosed were
displayed in tables, which most often present a column for current year and another for prior year,
this is to be expected. Thirty-five companies (94.6%) display previous year values for at least one
of the ratios they disclose and 24 (64.9%) present those values for all the ratios they disclose in the
annual report. Only two39 (5.4%) do not present values pertaining to the previous year for any of
ratio disclosed. Previous period values are important for comparability and analysis of a company’s
evolution and the examination of the same ratio for two consecutive years allows a more immediate
picture of the improvement or deterioration of financial aspects translated in those ratios.
Determinants of voluntary disclosure of financial ratios (RQ6)
This question focuses on the relationship between company characteristics and voluntary
disclosure of financial ratios. The company characteristics analyzed are all those suggested by
previous research (Giner, 1997; Ahmed & Courtis, 1999; Watson et al., 2002; Abdullah, 2005;
37 COMPTA,LISGRÁFICA,OREY,SDCINVESTIMENTOS SGPS andVISTA ALEGRE ATLANTIS SGPS.These companies disclose between one and three ratios.
38 E.g., in CTT: “solvency ratio” also presented as “equity to liabilities”; in EDPRENEWABLES: “EBITDA/net revenues” also presented as “EBITDA margin”; in CORTICEIRA AMORIM SGPS: “equity/net assets” also presented as “financial autonomy ratio”.
21
Amran & Aripin, 2015; Agyei-Mensah, 2015) as being potentially associated with voluntary
disclosure, drawing mainly on agency theory and signaling theory.
In accordance with previous literature (Watson et al., 2002; Abdullah, 2005; Amran & Aripin,
2015; Agyei-Mensah, 2015), the determinants of voluntary disclosure of financial ratios are studied
through an Ordinary Least Squares (OLS) regression of company characteristics on a ratio
disclosure index – the Extent of Financial Ratio Disclosure (EFRD), defined as the number of financial ratios disclosed by each company, divided by the maximum number of ratios disclosed
observed in the sample (in this case, 16)40.
The independent variables are the following companies’ characteristics:
o Ln_size: company size, measured by the natural logarithm of the Total Assets41;
o SuperSector: SuperSector the company belongs to, according to the ICB;
o Profitability: profit or loss of 2014, proxied by Net Income;
o Leverage: financial leverage, measured by debt to equity ratio42;
o SGPS: dummy variable, “1” if company is a holding, “0” if otherwise;
o Corp_Gov: measure of corporate governance level, measure by percentage of independent
directors to total members of the Board of Directors;
o Big4: dummy variable, “1” if company is audited by a Big Four firm, “0” if otherwise;
o Top_shareh: percentage of shareholding of the biggest shareholder;
o N_pages: number of total pages in the annual report;
Previously to running the regression, it is necessary to analyze the correlation among the
independent variables. The Pearson’s correlation is used for this effect and the resulting matrix is
presented in Appendix V. The results show that Ln_Size is highly correlated with Profitability
(R2=0.23, p-value=0.00) and N_pages (R2=0.41, p-value=0.00)43. N_pages is alsohighly correlated
40 As mentioned in the Section 3, different authors considered different computations for the disclosure index. The one found most appropriate (Agyei-Mensah, 2015) for the study at hand was chosen.
41 The natural logarithm is used due to the large scale and variance of the variable. 42 Calculation based on balance sheet debt and equity values.
22
with Profitability (R2=0.24, p-value=0.00) and Corp_Gov (R2=0.13, p-value=0.02). In order to
avoid multicollinearity affecting the results of the regression, and taking into account their lack of
correlation with disclosure of ratios and the EFRD, the variables Ln_Size and N_pages were
removed from the data for the purpose of running the regression. The final regression equation,
where i stands for the company and ranges from 1 to 43, is, then, the following:
Equation 1 - OLS Regression equation of EFRD on company characteristics
The results of the OLS regression are summarized in tables 2 and 3.
Table 2 - Regression statistics of EFRD on company characteristics
Multiple R R Squared Adjusted R Squared Standard Error Observations
0.525064 0.275692 0.130831 0.221264 43
R Squared indicates that these independent variables jointly explain 27.6% of the variation in
EFRD, but the Adjusted R Squared presents a significantly lower value of 13.1%. This means that
these explanatory variables do not have, in general, a strong correlation with the EFRD.
Table 3 - OLS Regression output of EFRD on company characteristics
Coefficients Standard Error t Stat P-value
Intercept 0.202889 0.141068 1.438237 0.159249
SuperSector -0.007750 0.008489 -0.913030 0.367474
Profitability -1.2E-08 1.86E-07 -0.062390 0.950608
Leverage -0.000410 0.000325 -1.257360 0.216948
SGPS -0.142290 0.078613 -1.810010 0.078888
Corp_Gov 0.240659 0.205226 1.172651 0.248856
Big4 0.273756 0.105233 2.601417 0.013515
Top_shareh -0.140500 0.169736 -0.827760 0.413415
The regression output shows that, for a significance level of 5%, only one variable, Big4, has a
significant relationship with the EFRD (p-value=0.01). Big4 is positively related with the EFRD
and the value of its coefficient indicates that a company audited by one of the Big Four auditing
firms will have a disclosure index 0.27 points higher than those audited by other firms, ceteris
23
EFRD and its coefficient means that a holding company will have a disclosure index 0.14 points
lower than a non-holding company, ceteris paribus.
Agency theory suggests that a larger proportion of independent directors (Corp_Gov) should lead
to higher levels of voluntary disclosure, since they have a controlling function and their role, as a
corporate governance practice, is to reduce information asymmetry; and larger ownership
concentration (Top_shareh) should be associated with lower levels of voluntary disclosure, as large
shareholders can exert more control on managers and hence align their interests. Moreover, in light
of signaling theory, companies with good performance, like high levels of net income (Profitability),
disclose more voluntary information. However, though the coefficient signs are according to
expectation, none of these variables have a significant relationship with the EFRD.
These results are, for the most part, not consistent with previous literature. Only one previous study,
conducted in Spain (Giner, 1997), has established a positive relationship between the auditing
company being one of the Big Four (then, Big Six) and higher levels of disclosure of financial
information. Most other studies (Ahmed & Courtis, 1999; Watson et al., 2002; Abdullah, 2005)
found size to be highly related with voluntary disclosure; Amran & Aripin (2015) only found
corporate governance score to be associated with voluntary ratio disclosure, while for
Agyei-Mensah (2015) this is the case only for company performance. The geographical and cultural
proximity to Spain (and distance to countries of other studies) is to be noted.
6. CONCLUSION
This Work Project analyzed the extent, presentation and determinants of voluntary disclosure of
financial ratios for a sample of 43 Portuguese listed companies. It contributes to existing literature
by conducting this study in Portugal for the first time.
The results suggest that there is low voluntary disclosure of financial ratios by Portuguese
24
reports, the average was of 4.5 ratios per annual report, resulting in an average Extent of Financial
Ratio Disclosure of 0.284. The most disclosed type of ratios was Profitability and the most
frequently observed ratio was EBTIDA margin, followed by EBIT margin, highlighting the
importance placed on operating profitability. As for presentation format, 50.6% of ratios were not
accompanied by the formula used for their calculation, which hinders information users when it
comes to interpretation and comparison with other ratios. Most ratios (63.7%) were presented in
tables, followed by graphs (13.7%). Circa 40% of the ratios were disclosed more than once and
86.9% presented their respective value for the previous period. As for determinants of the extent
of voluntary disclosure of financial ratios (i.e. considering the actual amount of ratios disclosed),
only the external auditor being one of the Big Four, as opposed to another auditing firm,
significantly influences how many ratios are disclosed.
This study is not without limitations. Firstly, the sample is relatively small (though representative
of Portuguese listed companies) and only one year, 2014, was analyzed. Also, the lack of
harmonization in terminology and consequent standardization performed for the study carries the
risk of mismatching ratios. Future research could extend the study to more companies and include
banks and to more years. This would allow undertaking a time series analysis to evaluate if and
how these features have changed. The investigation of ratio values could also be carried out.
Conclusions could be drawn as to whether ratios are selectively disclosed each year and, for the
same year, whether ratios are selectively repeated.
Healy & Palepu (2001) alert to how “firms have incentives to optimally trade off the costs and
benefits of voluntary disclosure” (Healy & Palepu, 2001, p. 411), and produce levels of information
they deem convenient or efficient. These affirmations, along with the results obtained in this study,
alert to the need for tighter guidelines on voluntary disclosure, particularly that pertaining to ratios,
25 REFERENCES
Abdullah, A. & Ismail, K. 2005. “Disclosure of Voluntary Accounting Ratios By Malasian Listed
Companies.” Journal of Financial Reporting & Accounting , 6(1): 1-20.
Agyei-Mensah, B. k.2015. “The Determinants of Financial Ratio Disclosures and Quality: Evidence from an Emerging Market.” International Journal of Accounting and Financial Reporting (2015) 5(1): 188-210.
Ahmed, K. & Courtis J. 1999. “Associations between corporate characteristics and disclosure levels in
annual reports: A meta analysis.” British Accounting Review(1999) 31: 35-61.
Alves, H., Rodrigues A. M., & Canadas, N. 2012. “Factors influencing the different categories of
voluntary disclosure in annual reports: An analysis for Iberian Peninsula listed companies.” Tékhne - Review
of Applied Management Studies (2012) 10: 15-26.
Amran, N. A., & Aripin N. 2015. “Financial Ratios: A Tool for Conveying Information and Decision
Making” Global Review of Accounting and Finance, 6(1): 151-164.
Barako D. G., Hancock P., & Izan H. Y. 2006. “Factors Influencing Voluntary Corporate Disclosure by
Kenyan Companies” Corporate Governance: An International Review, 14(2): 107-125.
Beattie, V., & Jones, M. J. 2000. “Changing graph use in corporate annual reports: A time-series analysis.”
Contemporary Accounting Research, 17(2): 213-226.
Beattie, V., & Pratt, K. “Voluntary Annual Report Disclosures: What Users Want” Edinburgh: The Institute of Chartered Accountants of Scotland, 2002.
Beattie, V. 2005. “Moving the financial accounting research front forward: The UK contribution” The British Accounting Review, 37(1): 85-114.
Cheng, E. C. M., & Courtenay, S. M. 2006. “Board composition, regulatory regime and voluntary
disclosure” The International Journal of Accounting 41(3): 262-289.
Core, J. E. 2001. “A review of the empyrical disclosure literature: discussion” Journal of Accounting and Economics 31(1-3): 441-456.
Courtis, J. K. 2004. “Colour as visual rhetoric in financial reporting” Accounting Forum 28(3): 265-281.
Eng, L. L., & Mak, Y. T. 2003. “Corporate governance and voluntary disclosure” Journal of Accounting and Public Policy 22(4): 325-345.
Gibson C. H. 1987. “How Chartered Financial Analysts View Financial Ratios” Financial Analysts Journal
43(3): 74-76.
Gibson, C. H. 2011. Financial Reporting & Analysis: Using Financial Accounting Information Mason:
South-Western Cengage Learning.
Giner Inchausti, B. 1997. “The influence of company characteristics and accounting regulation on
information disclosed by Spanish firms” European Accounting Review 6(1): 45-68.
Gitman L. J., & Zutter, C. J. “Managerial Finance” Prentice Hall, 2012.
Healy, P. M., & Palepu, K. G. 2001. “Information asymmetry, corporate disclosure, and the capital
markets: A review of the empyrical disclosure literature” Journal of Accounting and Economics 31(1-3):
405-440.
Houghton, K. A., & Woodlif, D. R. 1987. “Financial Ratios: The Prediction of Corporate ‘Success’ and
Failure” Journal of Business Finance & Accounting 14(4):537-554.
Meek et al., G. K., Roberts, C. B., & Gray, S. J. 1995. “Factors Influencing Voluntary Annual Report
Disclosures by the U.S., U.K. and Continental European Multinational Corporations” Journal of Internationa Business Studies 26(3): 555-572.
Lev, B., & Sunder, S. 1979. “Methodological issues in the use of financial ratios” Journal of Accounting and Economics 1(3): 187-210.
26
Watson, A., Shrives. P., & Marston, C. 2002. “Voluntary disclosure of accounting ratios in the UK” The British Accouting Review 34(4): 289-313.