LARGE DISCREET RESOURCE ALLOCATION:
A HYBRID APPROACH BASED ON DEA EFFICIENCY MEASUREMENT
Eliane Gonçalves Gomes*
Empresa Brasileira de Pesquisa Agropecuária (Embrapa) Brasília – DF
eliane.gomes@embrapa.br
João Carlos Correia Baptista Soares de Mello
Departamento de Engenharia de Produção Universidade Federal Fluminense (UFF) Niterói – RJ
jcsmello@pesquisador.cnpq.br
Lidia Angulo Meza
Departamento de Engenharia de Produção Universidade Federal Fluminense (UFF) Volta Redonda – RJ
lidia_a_meza@pq.cnpq.br
* Corresponding author / autor para quem as correspondências devem ser encaminhadas
Recebido em 03/2008; aceito em 09/2008 Received March 2008; accepted September 2008
Abstract
Resource allocation is one of the traditional Operations Research problems. In this paper we propose a hybrid model for resource allocation that uses Data Envelopment Analysis efficiency measures. We use Zero Sum Gains DEA models as the starting point to decrease the computational work for the step-by-step algorithm to allocate integer resources in a DEA context. Our approach is illustrated by a numerical example.
Keywords: resource allocation; DEA; zero sum gains; step-by-step allocation algorithm.
Resumo
A alocação de recursos é um dos problemas clássicos da Pesquisa Operacional. Neste artigo é proposto um modelo híbrido para alocar recursos, que faz uso de medidas de eficiência calculadas por Análise de Envoltória de Dados (DEA). São usados modelos DEA com Ganhos de Soma Zero como ponto de partida para reduzir o esforço computacional do algoritmo seqüencial para alocação de recursos discretos em DEA. A abordagem aqui proposta é aplicada a um exemplo numérico.
1. Introduction
Data Envelopment Analysis (DEA) models measure the efficiency of productive units (known as Decision Making Units – DMU’s). Usually, this measure evaluates the units and shows the better management practices that become benchmarks for the other units. The efficiency measure can also be taken as an index of good use of resources and, thus improve its allocation. It is clear that more resources should be allocated to the units that make better use of them. This procedure is of particular interest whenever there is a central decision making controller that allocates scarce resources severely limited in number to the DMU’s.
Using DEA models to achieve this has been a study subject in the literature as shown, for instance in Athanassopoulos (1995, 1998), Thanassoulis (1996), Cook & Kress (1999), Yan et al. (2002), Beasley (2003), Gomes (2003), Korhonen & Syrjänen (2004), Lozano & Villa (2004), Amirteimoori & Kordrostami (2005), Ertay & Ruan (2005), Marinescu et al. (2005), Soares de Mello et al. (2006), Avellar et al. (2007), Gomes & Lins (2008), among others. A revision of the “DEA resource allocation” theme can be found in Soares de Mello et al. (2006).
Here, two approaches rise from the others: The DEA with Zero Sum Gains (DEA-ZSG) model (Gomes, 2003; Lins et al., 2003; Gomes et al., 2003, 2004, 2005; Gomes & Lins, 2008) and the sequential algorithm to allocate discreet resources in DEA models (Soares de Mello et al., 2006). Both models assume that the sum of resources is constant and do not assume a pre definition of the efficient frontier. They are, therefore, non-parametric models.
Classic DEA models assume that the quantity of consumed resources, as well as each unit’s output depend only upon that unit’s decisions. So, units are independent. On the contrary, DEA-ZSG models assume the hypothesis of output and resource consumption not being fully independent. This arises whenever resources are shared or when a larger production from one unit compels another to have a lesser output, the classic example being that of Olympic medals being won (Lins et al., 2003). An additional constraint to optimization problems used to determine classic DEA efficiency is required when the dependency hypothesis is assumed. This constraint compels the sum of a given resource (or output) to be constant and raises non-linearity in the optimization problems. In principle, this increases the computational effort, which is already usually large to solve DEA models (Dulá, 2002; Biondi Neto et al., 2004).
This added constraint implies that when an inefficient DMU tries to reach its target along the efficiency frontier, the position of the remainder DMU’s changes so the sum of resources (or outputs) is kept constant. Therefore, as opposed to what occurs in the classic DEA models, the efficient frontier moves whenever a DMU tries to reach it. This allows DEA-ZSG models to be used to reallocate resources. All that is needed is to move to the frontier all inefficient DMU’s. Necessarily, the frontier is displaced. After this procedure, all DMU’s will belong to the efficiency frontier. However, this method requires continuous variables, which may not be the case.
determine resource allocation on the basis of the DEA efficiency measures. For a detailed description of the algorithm see Soares de Mello et al. (2006). The major disadvantage of this procedure is that it becomes very slow when the integer resource to reallocate is large and the number of efficient DMU’s is small. The lesser the number of efficient DMU’s, the slower the process as, in this case, any iteration causes only a small resource reallocation. This leads to many iterations being required.
A comparative analysis of both the resource allocation sequential algorithm and the DEA-ZSG model shows they are based on similar assumptions: the efficiency frontier is not specified in a functional way and the total of a given variable is limited. However, whilst in the DEA-ZSG models the existing total of a given variable is reallocated, in the sequential algorithm new resources are allocated to the DMU’s. Another difference is that DEA-ZSG models deal with continuous variables while the sequential algorithm deals with discreet variables.
Taking advantage of the existing similarities, this paper proposes the joint use of the two approaches as a means to overcome the slow processing of the resource allocation sequential algorithm. A DEA-ZSG is proposed to start off with as a means to speed up resource allocation. The hybrid approach herein proposed is applied to a numerical example adapted from the Korhonen & Syrjänen (2004) case study.
2. DEA Zero Sum Gains Models
The classic DEA models, either the CCR (Charnes et al., 1978) or the BCC (Banker et al., 1984) and their variations, assume total freedom of production, i.e., a given DMU’s production does not interfere with the production of the other DMU’s. The same assumption can be extended to the use of resources. However, in many cases there is no such freedom. In competitions, for instance, to improve a competitor’s ranking requires an equivalent loss for the other competitors. If a variable is linked to the rankings obtained (Lins et al., 2003; Villa & Lozano, 2004; Gomes & Avellar, 2005), this has to be taken into account.
In the so called Zero Sum Gains DEA models (DEA-ZSG) (Gomes, 2003; Lins et al., 2003; Gomes et al., 2003, 2004, 2005; Gomes & Lins, 2008), an inefficient DMU trying to reach the frontier by reducing its inputs (or increasing its outputs) shall impart to the others that increase or decrease so the sum is constant. So, DEA-ZSG models have a direct application in the resource (or output) allocation or reallocation studies whenever a constant sum is a modeling constraint.
DEA-ZSG models are similar to zero sum games in which others must lose whatever one given player wins. In other words, the net sum of wins must be zero. As opposed to traditional models, the way followed by a DMU to reach its target on the frontier may imply changes in the shape of the efficient frontier.
There is always the possibility of more than one DMU trying to maximize efficiency. This can either be done in competition or cooperation. The case in which DMU’s create a cooperative group is the most interesting case in ZSG modeling. In the DEA-ZSG paradigm, cooperative search for efficiency means that the DMU’s belonging to the group try to allocate a given quantity of input only to those DMU’s that do not belong to the group, the same applying when the group tries to withdraw a given quantity of outputs only from those DMU’s that do not belong to the group, either.
In the general case of multiple DMU’s acting in cooperation, the DEA-ZSG model becomes a Multi-objective Nonlinear Programming Problem (Gomes et al., 2003). Problems like this tend to lead often to the use of metaheuristics owing to the large number of variables and DMU’s. However, for the proportional reduction strategy, Gomes et al. (2003) prove that the model is reduced to a Mono-objective Nonlinear Programming Problem in accordance with the Proportional Efficiencies in the Proportional Strategies Theorem. The Theorem establishes that if various cooperating DMU’s search targets following proportional strategies, the efficiencies of the DMU’s in the DEA-ZSG model are directly proportional to their efficiencies in the classical model.
Should all inefficient DMU’s gather in a sole cooperative group and search for their efficiency in the classic DEA efficiency frontier, the use of DEA-ZSG will lead to the complete constant sum input (or output) reallocation. After this reallocation, all DMU’s will belong in the efficient frontier, i.e., they all will be 100% efficient.
This new DEA frontier, herein named uniform DEA frontier or maximum efficiency frontier, will be located at lower levels than those of the DEA classic model frontier. This happens because efficient DMU’s lose efficiency, as they end up having have more input units and/or less output units. This is so to compensate for the inverse movement in the previously inefficient DMU’s in order to keep constant the sum of either the inputs or outputs. This maximum efficiency maybe seen as “ideal” by regulating organs as the decision maker will be presented with an input and/or output reallocation that makes all units be 100% efficient.
To build directly a uniform frontier in which inefficient DMU’s are joined in a single cooperative grouping W, Gomes et al. (2003) have proved the Target Determination Theorem. This theorem establishes that “the DMU target being studied in the proportional strategy DEA-ZSG model equals the classic target multiplied by the reduction coefficient”. Together with the Proportional Efficiencies in the Proportional Strategies Theorem, the Target Determination Theorem leads to the solution of the Non Linear Programming Problem being a single equation.
Thus, for both the CCR and BCC input oriented models, equation (1) is valid. In it, hRi and
i
h are the respective efficiencies of the DEA-ZSG and classic DEA models; W is the
cooperating DMU’s group; rij =hi I− hj I− is the proportionality factor resulting from the use of the input oriented proportional strategy. Equation (2) is the corresponding equation for output-oriented models in qij =hi O− hj O− is the proportionality factor.
(
1)
1
j ij Ri j W
Ri i
j j W
x r h
h h
x
∈
∉
⎛ ⎡⎣ − ⎤⎦⎞
⎜ ⎟
= ⎜ + ⎟
⎜ ⎟
⎝ ⎠
∑
(
1)
1j ij Ri j W
Ri i
j j W
y q h
h h
y
∈
∉
⎛ ⎡⎣ − ⎤⎦⎞
⎜ ⎟
= ⎜ − ⎟
⎜ ⎟
⎝ ⎠
∑
∑
(2)It should be pointed out that other DEA models that use the constant sum constraint are to be found in the literature. The works of Avellar et al. (2007, 2005) and Lozano & Villa (2004) deserve particular mention. The former propose DEA CCR type models based on limited inputs/outputs in which the allocation of resources/production can be influenced either by the inputs or the outputs. The construction of these models was based on the geometrical profile of three-dimensional CCR frontier that is replaced by a hyperbolic or spherical frontier depending on the nature of the variable to be allocated. Attention is drawn to the fact that these models postulate a type of function for the frontier as opposed to the practice in classic DEA. Guedes (2007) names this type of model as “parametric” DEA”. On the other hand, Lozano & Villa’s (2004) model, called Constant Sum of Outputs (CSO), refers to resource allocation decision making being centralized. The authors propose a DEA BCC model in two phases in which the efficiency maximization for each individual DMU occurs simultaneously with the minimization of total resources or maximization of total production.
3. Sequential Algorithm to Allocate Resources in DEA
The authors of this paper are not aware of any models to be found in the literature that reallocate resources already existing and/or do not take into account the possibility of the resources being discreet. As proposed in Soares de Mello et al. (2006), the sequential algorithm to allocate resources in DEA takes into account the sharing of discreet resources that will be allocated at a later stage. The authors describe a sequential algorithm to allocate resources based on the efficiency measurements of the DMU’s. It is a dynamic algorithm that computes new efficiencies at each step.
The first approach to allocate new resources on the basis of DEA efficiency measurements, as showed in Soares de Mello et al. (2006) would be the allocation of available resources to efficient DMU’s only. However this rather simplistic technique may present difficulties. The first one has to do with the fact that the number of resources may not be a multiple of the number of efficient DMU’s, which would lead to some sort of ranking for the 100% efficient DMU’s. Another difficulty is that this method of allocation does not take into account those inefficient DMU’s that are, however, very close to efficiency. In this case, it may not be right to allocate all resources to the efficient DMU’s and nothing to one that is 99% efficient.
In the algorithm proposed by Soares de Mello et al. (2006), the efficiencies of all DMU’s are computed and only one single resource is allocated to each of the 100% efficient DMU’s. Once this is done, it is assumed that the resources have been effectively allocated and new efficiencies are computed. This procedure is repeated until all resources are allocated, the aim of this step being to find out what would be the behaviour of the DMU’s if they maintained the same output but could count on the resources allocated at this stage. This is then a sequential algorithm to allocate discreet resources based on efficiencies calculated by the classical DEA models.
not received any in the previous steps and, next, to those efficient DMU’s with the lesser number of the original resource. The first rule is justified by a more equitable allocation. The second follows the principle that the same resource is better used by a DMU with fewer resources than by a DMU with more resources.
4. Proposed Hybrid Model
As previously mentioned, DEA-ZSG models as they exist now are adequate for the allocation of continuous resources. To allocate discreet resources, rounding off the allocated value may be an option, but it may lead to values the sum of which is different from the established total.
As opposed to this, the sequential algorithm for DEA allocation is valid for discreet resources. However good the allocation it promotes, this algorithm may become very slow, should the number of resources be large and the number of efficient DMU’s be small. The cause for becoming slow is the small number of resources that are reallocated at any iteration.
To combine the advantages and potentialities of both models, we propose herein their joint use. To do so, the allocation of resources is done in two steps. Firstly, resources are allocated in accordance with the proportional strategy DEA-ZSG model. As resources are allocated assuming that the variables are continuous, which they are not, only the integer part is allocated as the first parcel for each DMU. In the second allocation step, the difference between what should have been allocated and what really was, the left-over from the first step is allocated using the sequential algorithm previously described.
5. Numerical Example
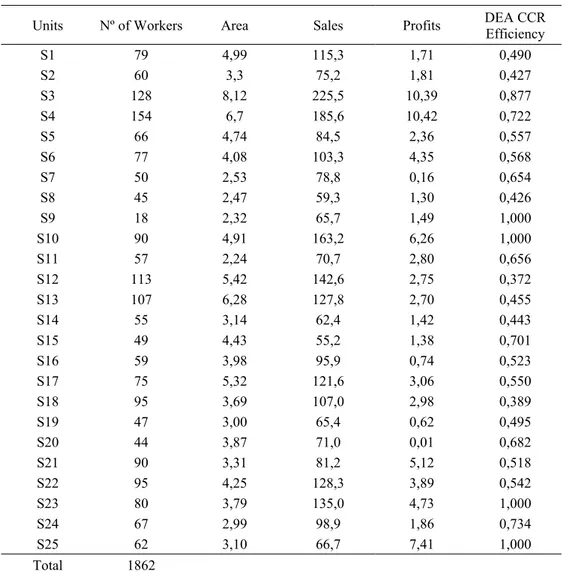
To give an example of the hybrid approach herein proposed, we have adapted the Korhonen & Syrjänen (2004) case study. Data were obtained from the real case of 25 Finnish supermarkets belonging to the same chain. The authors have used two output variables, namely sales and profits (106 Finnish Mark, the previous Finnish currency), whereas man-hours (102 h) and sales (102 m2) were used as inputs.
To apply the model it has been assumed that the variable “sales area” is a non-discretionary input. Indeed, it is not possible, at short notice, to change the area of any supermarket and it may not even be in the management’s interest to do so.
Table 1 – Numeric Example Data.
Units Nº of Workers Area Sales Profits DEA CCR
Efficiency
S1 79 4,99 115,3 1,71 0,490
S2 60 3,3 75,2 1,81 0,427
S3 128 8,12 225,5 10,39 0,877
S4 154 6,7 185,6 10,42 0,722
S5 66 4,74 84,5 2,36 0,557
S6 77 4,08 103,3 4,35 0,568
S7 50 2,53 78,8 0,16 0,654 S8 45 2,47 59,3 1,30 0,426 S9 18 2,32 65,7 1,49 1,000
S10 90 4,91 163,2 6,26 1,000
S11 57 2,24 70,7 2,80 0,656
S12 113 5,42 142,6 2,75 0,372
S13 107 6,28 127,8 2,70 0,455
S14 55 3,14 62,4 1,42 0,443 S15 49 4,43 55,2 1,38 0,701 S16 59 3,98 95,9 0,74 0,523
S17 75 5,32 121,6 3,06 0,550
S18 95 3,69 107,0 2,98 0,389
S19 47 3,00 65,4 0,62 0,495 S20 44 3,87 71,0 0,01 0,682 S21 90 3,31 81,2 5,12 0,518
S22 95 4,25 128,3 3,89 0,542
S23 80 3,79 135,0 4,73 1,000
S24 67 2,99 98,9 1,86 0,734 S25 62 3,10 66,7 7,41 1,000
Total 1862
It is assumed that the chain management’s aim is to improve shop efficiency by reallocating workers. The hybrid approach herein proposed is used within the terms of an input oriented CCR model. The efficiencies generated by the original workers allocation is shown on Table 1, and were calculated with the SIAD software (Angulo-Meza et al., 2005).
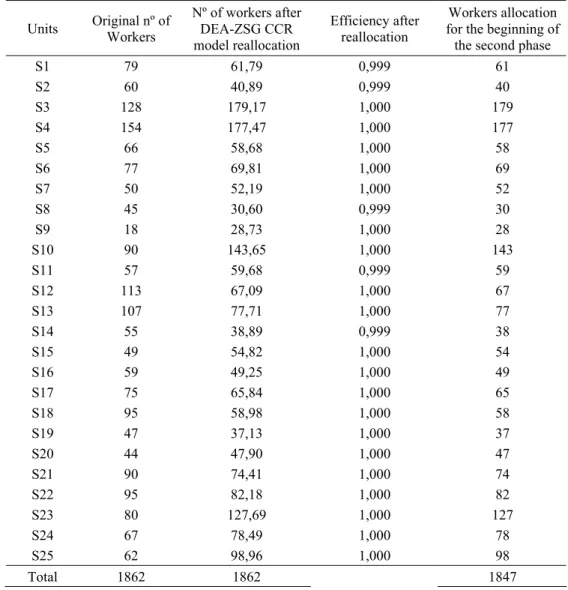
The first phase of the approach herein proposed is to compute the targets using the DEA-ZSG model. The reallocation results are shown on Table 2. It can be noticed that the reallocated value is a fraction, a characteristic of the DEA-ZSG model. So, only the integer part of this value is reallocated to each DMU and the sequential algorithm, as previously explained, reallocates the remainder. According to the CCR model, the remainder are 15 workers to be reallocated in the second phase.
Table 2 – Input oriented DEA-ZSG CCR model results.
Units Original nº of
Workers
Nº of workers after DEA-ZSG CCR model reallocation
Efficiency after reallocation
Workers allocation for the beginning of
the second phase
S1 79 61,79 0,999 61
S2 60 40,89 0,999 40
S3 128 179,17 1,000 179
S4 154 177,47 1,000 177
S5 66 58,68 1,000 58
S6 77 69,81 1,000 69
S7 50 52,19 1,000 52
S8 45 30,60 0,999 30
S9 18 28,73 1,000 28
S10 90 143,65 1,000 143
S11 57 59,68 0,999 59
S12 113 67,09 1,000 67
S13 107 77,71 1,000 77
S14 55 38,89 0,999 38
S15 49 54,82 1,000 54
S16 59 49,25 1,000 49
S17 75 65,84 1,000 65
S18 95 58,98 1,000 58
S19 47 37,13 1,000 37
S20 44 47,90 1,000 47
S21 90 74,41 1,000 74
S22 95 82,18 1,000 82
S23 80 127,69 1,000 127
S24 67 78,49 1,000 78
S25 62 98,96 1,000 98
Total 1862 1862 1847
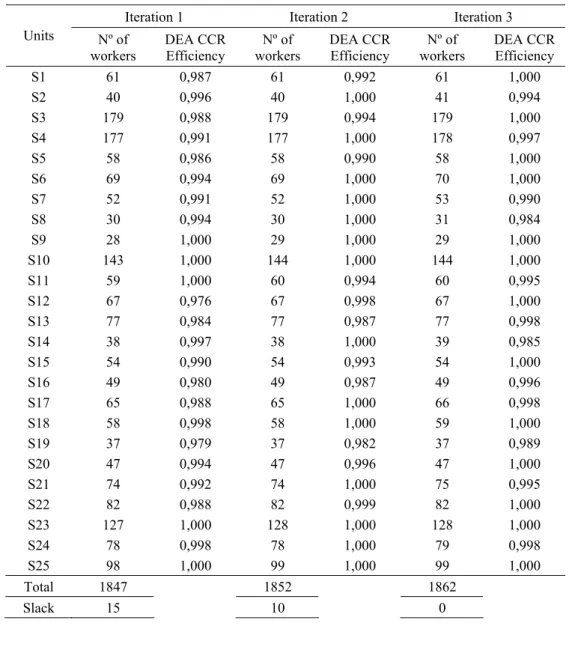
run again with the new resource, i.e., DMU’s S9, S10, S11, S23 and S25 have respectively 29, 144, 60, 128 and 99 workers. In this second iteration 14 units are CCR efficient with this resource arrangement: S2, S4, S6, S7, S8, S9, S10, S14, S17, S18, S21, S23, S24 and S25.
In the second iteration, the number of resources to be allocated is less than the number of efficient DMU’s. According to the sequential algorithm, resources should be allocated first to those efficient DMU’s that were not contemplated in the previous steps and, after, to those that originally had fewer of this resource. Applying the first tie-breaking criterion, 4 of 14 DMU’s (S9, S10, S23 and S25) did receive resources in the previous phase and, thus, they are ineligible to receive any. So, in this iteration, the third, the remaining 10 workers can be reallocated without having recourse to the second tie-breaking criterion.
Table 3 – Second phase results: use of the sequential algorithm.
Iteration 1 Iteration 2 Iteration 3
Units Nº of
workers
DEA CCR Efficiency
Nº of workers
DEA CCR Efficiency
Nº of workers
DEA CCR Efficiency
S1 61 0,987 61 0,992 61 1,000 S2 40 0,996 40 1,000 41 0,994 S3 179 0,988 179 0,994 179 1,000 S4 177 0,991 177 1,000 178 0,997 S5 58 0,986 58 0,990 58 1,000 S6 69 0,994 69 1,000 70 1,000 S7 52 0,991 52 1,000 53 0,990 S8 30 0,994 30 1,000 31 0,984 S9 28 1,000 29 1,000 29 1,000 S10 143 1,000 144 1,000 144 1,000 S11 59 1,000 60 0,994 60 0,995 S12 67 0,976 67 0,998 67 1,000 S13 77 0,984 77 0,987 77 0,998 S14 38 0,997 38 1,000 39 0,985 S15 54 0,990 54 0,993 54 1,000 S16 49 0,980 49 0,987 49 0,996 S17 65 0,988 65 1,000 66 0,998 S18 58 0,998 58 1,000 59 1,000 S19 37 0,979 37 0,982 37 0,989 S20 47 0,994 47 0,996 47 1,000 S21 74 0,992 74 1,000 75 0,995 S22 82 0,988 82 0,999 82 1,000 S23 127 1,000 128 1,000 128 1,000 S24 78 0,998 78 1,000 79 0,998 S25 98 1,000 99 1,000 99 1,000
Total 1847 1852 1862
The proposed hybrid approach reached its initial objective of allocating the supermarket chain workers in the “fairest possible way” as the table shows. “Fair way” (the result of the DEA-ZSG model imposed paradigm) means the increase of the average chain efficiency, which grows from 63,1% (Table 1) to 99,7% (Table 3). Furthermore, the reallocation of resources took only three iterations.
6. Conclusions
A hybrid approach has been proposed in this paper for the (re) allocation of discreet resources. This approach uses together the DEA-ZSG models and the DEA sequential algorithm to allocate discreet resources. DEA-ZSG models are used as a first step to allocate resources in a continuous manner. The sequential allocation algorithm is used thereafter to allocate discreet resources.
Only three iterations were needed to reallocate all the resources in this case. Moreover, the average shop efficiency was nearly 100%. So, this new approach was very advantageous both to reallocate resources and to increase the average efficiency of the DMU’s at the end of the process. This is of particular interest to units subject to a central authority that wishes its productive centres to be as efficient as they can.
DEA-ZSG models and the sequential allocation algorithm can be used together for other purposes. One example is to allocate a large quantity of new resources beside those already existing. As already mentioned, the use of the sequential algorithm on its own might lead to numberless iterations to reach the complete allocation of a particular resource. This could render the process too slow for practical purposes. Two alternatives can be used to start off the hybrid model. Either the new resources are added to the previous lot, the total being then uniformly allocated to the units, or the initial system is unchanged and only the new resources are uniformly allocated to the units. In the first case, the total value serves as starting point for the model. In the second, the sum of the two values becomes the variable to be allocated in the DEA-ZSG model to be followed by the sequential algorithm.
Acknowledgements
Thanks are in order to the CNPq for its financial support.
References
(1) Amirteimoori, A. & Kordrostami, S. (2005). Allocating fixed costs and target setting: a DEA-based approach. Applied Mathematics and Computation, 171(1), 136-151.
(2) Angulo-Meza, L.; Biondi Neto, L.; Soares de Mello, J.C.C.B. & Gomes, E.G. (2005). ISYDS – Integrated System for Decision Support (SIAD – Sistema Integrado de Apoio à Decisão): A Software Package for Data Envelopment Analysis Model. Pesquisa Operacional, 25(3), 493-503.
(3) Athanassopoulos, A.D. (1995). Goal programming & data envelopment analysis
(4) Athanassopoulos, A.D. (1998). Decision support for target-based resource allocation of public services in multiunit and multilevel systems. Management Science, 44(2), 173-187.
(5) Avellar, J.V.G.; Milioni, A.Z. & Rabello, T.N. (2007). Spherical frontier DEA model based on a constant sum of inputs. Journal of the Operational Research Society, 58(9), 1246-1251.
(6) Avellar, J.V.G.; Milioni, A.Z. & Rabello, T.N. (2005). Modelos DEA com variáveis limitadas ou soma constante. Pesquisa Operacional, 25(1), 135-150.
(7) Banker, R.D., Charnes, A. & Cooper, W.W. (1984). Some models for estimating
technical scale inefficiencies in data envelopment analysis. Management Science, 30(9), 1078-1092.
(8) Beasley, J.E. (2003). Allocating fixed costs and resources via data envelopment
analysis. European Journal of Operational Research, 147(1), 197-216.
(9) Biondi Neto, L.; Lins, M.P.E.; Gomes, E.G.; Soares de Mello, J.C.C.B. & Oliveira, F.S. (2004). Neural data envelopment analysis: A simulation. International Journal of Industrial Engineering: Theory Applications and Practice, 11(1), 14-24.
(10) Charnes, A.; Cooper, W.W. & Rhodes, E. (1978). Measuring the efficiency of decision-making units. European Journal of Operational Research, 2(6), 429-444.
(11) Cook, W.D. & Kress, M. (1999). Characterizing an equitable allocation of shared costs: a DEA approach. European Journal of Operational Research, 119(3), 652-661.
(12) Dulá, J.H. (2002). Computations in DEA. Pesquisa Operacional, 22(2), 165-182.
(13) Ertay, T. & Ruan, D. (2005). Data envelopment analysis based decision model for optimal operator allocation in CMS. European Journal of Operational Research, 164(3), 800-810.
(14) Gomes, E.G. (2003). Modelos de Análise de Envoltória de Dados com Ganhos de Soma Zero. Tese (Doutorado em Engenharia de Produção), COPPE/UFRJ, Rio de Janeiro, 2003.
(15) Gomes, E.G. & Avellar, J.V.G. (2005). Modelos de análise de envoltória de dados com variáveis de soma constante: teoria e aplicação. Pesquisa Naval, 18, 99-104.
(16) Gomes, E.G. & Lins, M.P.E. (2008). Modelling undesirable outputs with zero gains DEA models. Journal of the Operational Research Society, 59(5), 616-623.
(17) Gomes, E.G.; Soares de Mello, J.C.C.B. & Lins, M.P.E. (2003). Busca sequencial de alvos intermediários em modelos DEA com soma de outputs constante. Investigação Operacional, 23(2), 163-178.
(18) Gomes, E.G.; Soares de Mello, J.C.C.B. & Lins, M.P.E. (2004). Redistribuição de inputs e outputs em modelos de análise envoltória de dados com ganhos de soma zero. Pesquisa Operacional, 24(2), 269-284.
(19) Gomes, E.G.; Soares de Mello, J.C.C.B. & Lins, M.P.E. (2005). Uniformização da fronteira eficiente em modelos de análise de envoltória de dados com ganhos de soma zero e retornos constantes de escala. Pesquisa Operacional, 25(2), 261-277.
(21) Korhonen, P. & Syrjänen, M. (2004). Resource allocation based on efficiency analysis. Management Science, 50(8), 1134-1144.
(22) Lins, M.P.E.; Gomes, E.G.; Soares de Mello, J.C.C.B. & Soares de Mello, A.J.R. (2003). Olympic ranking based on a zero sum gains DEA model. European Journal of Operational Research, 148(2), 312-322.
(23) Lozano, S.N. & Villa, G. (2004). Centralized resource allocation using data envelopment analysis. Journal of Productivity Analysis, 22(1-2), 143-161.
(24) Marinescu, M.V.; Sowlati, T. & Maness, T.C. (2005). The development of a timber allocation model using data envelopment analysis. Canadian Journal of Forest Research, 35(10), 2304-2315.
(25) Soares de Mello, J.C.C.B.; Gomes, E.G.; Leta, F.R. & Soares de Mello, M.H.C. (2006). Algoritmo de alocação de recursos discretos com análise de envoltória de dados. Pesquisa Operacional, 26(1), 225-240.
(26) Thanassoulis, E. (1996). A data envelopment analysis approach to clustering operating units for resource allocation purposes. Omega, 24(4), 463-476.
(27) Villa, G. & Lozano, S.A. (2004). Constant Sum of Outputs DEA model for Olympic Games target setting. In: 4th International Symposium on DEA. Proceedings of the 4th International Symposium on DEA, Aston University, US, p. 36.
(28) Yan, H.; Wei, Q. & Hao, G. (2002). DEA models for resource reallocation and