Abs tract
The paper presents a rational procedure for evaluating the con-crete shear strength in reinforced concon-crete beams. Previous re-search has shown that the shear in concrete is resisted by various mechanisms and the resistance degrades with the increase of flex-ural deformation. The paper introduces a novel approach in utiliz-ing the knowledge about shear resistance degradation by couplutiliz-ing the shear resistance with the shear demand. Both the shear re-sistance and shear demand are correlated with flexural tensile strain from compatibility and equilibrium requirements. The basic shear strength, under a given loading is determined from the in-tersection of the demand and resistance curves. The procedure was verified against a database of 232 beams collected from 10 sources with a broad range of parameters. It showed good predic-tion capability and can be useful to design practice.
Key words
Shear strength; resistance and demand; shear tests, design proce-dure
A novel approach for evaluating the concrete shear
strength in reinforced concrete beams
1 INTRODUCTION
Shear behavior in reinforced concrete beams is very complex where, the system becomes highly in-determinate transmitting shear through various mechanisms which are influenced by many parame-ters [ACI-ASCE-326, ACI-ASCE-426, ACI-ASCE-445 (2009)]. The design of shear in most rein-forced concrete design codes [ACI-318-2011, Eurocode 2-2004] is based on the assumption that the nominal strength, �!, is the summation of contributions of concrete, V!, and stirrups, �!, such as :
V
!=V!+V! (1)
The concrete shear strength, V!, in the above codes involves semi-empirical equations, based on
tests of beams without stirrups, such as Eq. (2) and Eq. (3), respectively:
A h me d B . Sh u ra im*
Professor of structural Engineering, Civil Engineering Department, College of Engineer-ing, King Saud University, Riyadh, Saudi Arabia.
Received in 21 Nov 2012 In revised form 11 Apr 2013
Latin American Journal of Solids and Structures 11(2014) 093 - 112
V!=1
6 f!
! b! d (2)
V
!= 0.18 1+
200
d 100 ρ f!"
!/!
b! d (3)
where �!,� are the width and effective depth of the beam cross section (mm); �!!= specified
con-crete strength, MPa; � is the reinforcement ratio; and �!" =�!!−1.60 MPa. Concerns have been
raised about the adequacy of the ACI-318 simplified equation, Eq. (2) [Brown et al, 2006].
Several multi-parameter empirical equations have been developed [Kim and Park 1996; Rebeiz 1999; Okamura and Higai 1980; and Zsutty 1968], however, shear empirical equations have been recognized to produce a large degree of scatter due to the scatter in test results and to the uncer-tainty in assessing the influence of complex parameters in a simple formula [ACI-ASCE-445, 2009]. A new trend in evaluating the concrete shear strength is to relate shear strength to the strain in the longitudinal reinforcement [Vecchio and Collins, 1986; Bentz, et al, 2006; Collins et al, 2007; CSA Committee A23.3, 2004; AASHTO, 2008; Muttoni and Ruiz, 2008]. In these studies, the shear resistance, �!, was shown to degrade with the deformation where the latter is represented as a
func-tion of the strain in the longitudinal reinforcement, such as:
�! = �
1+� �! �!
! !/! �! � (4)
where the terms A and B are as defined by Eq. (6-a) and Eq. (7-a) in Table 1. The strain, �!, (see
Figure 1) is defined as a function of the factored moment and shear force (�!, �!) in the form
pro-vided by Eq. (6-b) and Eq. (7-b) in Table 1.
Another family of theoretical models that relates concrete shear strength to the strain in the lon-gitudinal reinforcement through various hypotheses regarding the crack location, orientation and the state of strain or stress [Zararis and Papadakis, 2001; Tureyen and Frosch, 2003, Park et al, 2006; Choi et al 2007; Choi and Park, 2008]. Based on these formulations, the shear strength, �!, of
a section was expressed as a function of neutral axis depth, c, concrete tensile strength, �!, and
flex-ural compressive stress, �, as
�!= �(�!,�) �/� �! � (5)
equa-Latin American Journal of Solids and Structures 11(2014) 093 - 112
tions (Eq. (6-b) and Eq. (7-b)) may not be the best effective approach to utilize the knowledge gained regarding shear degradation with increasing deformation.
The paper introduces a novel approach in utilizing the knowledge about shear resistance degra-dation by coupling the shear resistance with the shear demand. Both the shear resistance and shear demand can be correlated with flexural tensile strain from compatibility and equilibrium require-ments. The basic shear strength, under a given loading is determined from the intersection of the shear demand curve and the shear resistance curve, as shown in Figure 1c. This resistance-demand (RD) procedure was verified against a database of 232 beams collected from 10 sources with a broad range of parameters. The procedure showed good prediction capability and can be very useful to design practice.
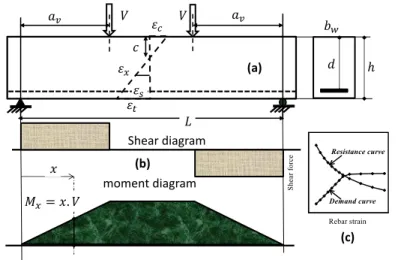
Figure 1 Basic definitions: a) RC beam having a rectangular section, showing strain distribution under loading; b) shear and moment diagrams; c) schematic representation of resistance and demand curves.
Table 1 A summary of main code and theoretical equations (units: MPa, mm, and N)
Reference V!, N Eq. No
CSA A23.3-2004
V!=λ! !.! !!!"## !! f!
! b! d! ; λ!= !"##
!"""!!!" (6-a)
ε
!=
!!!!!/!!
! !!!!
; d! = max[0.9 d or 0.72 h] (6-b)
Muttoni and Ruiz (2008)
V!=
0.333
1+120 μ ε
!
f!! b! d ; μ=
d
d
!+16 (7-a)
ε
!=0.41
f! E!
Mu
Mn (7-b)
Zararis and Papadakis (2001)
V!= λ! 0.3 f!!
!
! b
! c; ε!=0.002 λ!=1.2−0.2
a!
d d/1000 ≥0.65 c
d
!
+600ρ
f!!
c
d− 600 ρ f!!=
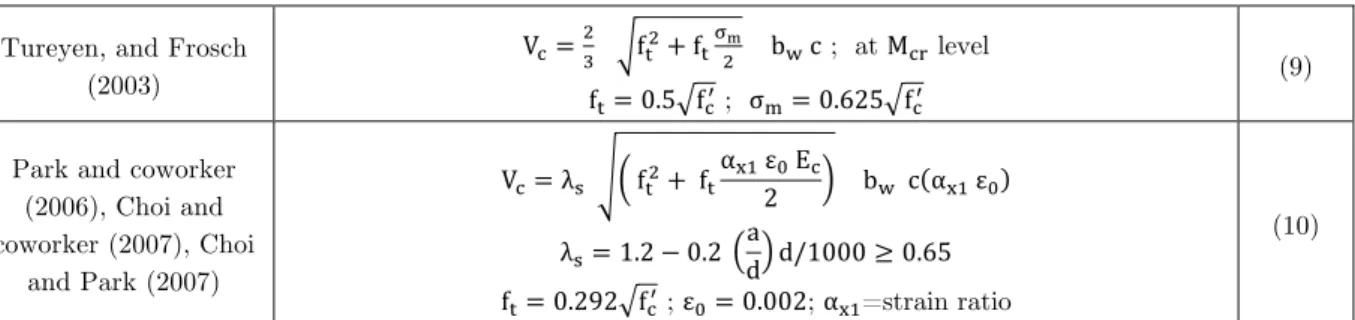
Latin American Journal of Solids and Structures 11(2014) 093 - 112 Table 1 (continued) Tureyen, and Frosch
(2003)
V!=! ! f!
!+f!!!
! b! c ; at M!" level
f!=0.5 f!! ; σ!=0.625 f!!
(9)
Park and coworker (2006), Choi and coworker (2007), Choi
and Park (2007)
V!=λ! f!!+ f!
α!" ε! E!
2 b! c α!" ε!
λ!=1.2−0.2
a
d d/1000≥0.65 f!=0.292 f!! ; ε!=0.002; α
!"=strain ratio
(10)
b!,d,h= width and effective depth, and total depth of cross section (mm); f!!= specified concrete strength, MPa;
ρ =reinforcement ratio; S!" = equivalent crack spacing parameter; E!,A!= modulus of elasticity and area of rein-forcement; V!,M!= factored shear and moment; d!= aggregate size; M
!= nominal moment capacity; M!"= crack-ing moment.
1.1 Shear Test Database
The shear strength of concrete is known to be affected by a wide range of key parameters, including concrete compressive strength, �!!, longitudinal reinforcement ratio, ρ, effective depth, �, and shear
span-to-depth ratio, �!
�, among others [ACI-ASCE-445 (2009)]. Therefore, it is important to
veri-fy any design procedure against a representative range of key parameters. For this purpose, test data were collected from nine sources in the technical literature as given in Table 2. Additionally, twelve beams were tested by the author to reflect local materials and to supplement the existing database. The database consists of 232 tested beams without stirrups from ten sources as summa-rized in Table 2. The beams had a broad range of design parameters: 11 ≤�!!≤ 99 MPa; 0.45 ≤ρ≤ 3.36 (percent); 70 ≤�≤ 1200 mm; and 1 ≤�!
�≤ 8.
Table 2 summary of test data.
# Source # of beams f!!, Mpa d, mm a!/d ρ %
1 Kani-1 56 18-35 272 2.5 -8 0.5 – 2.8
Kani-2 63 18-35 272 1-2.5 0.5 – 2.8
2 Papadakis 20 11-53 175-350 3-4 0.8-1.8
3 Mphonde & Frantz 9 21-94 298 3.6 3.36
4 Walraven 3 27.5 125 7.50 0.74-0.83
5 Leonhardt & Walther 24 28-38 70-600 3-8 1.33-2.1
6 Bhal 8 23-29 300-1200 3 0.6-1.3
7 Mattock 7 17-47 254 2.7-5.1 1-3.1
8 Taylor 15 22-32 140-930 3 1.35
Latin American Journal of Solids and Structures 11(2014) 093 - 112
2 LOCAL EXPERIMENTAL PROGRAM
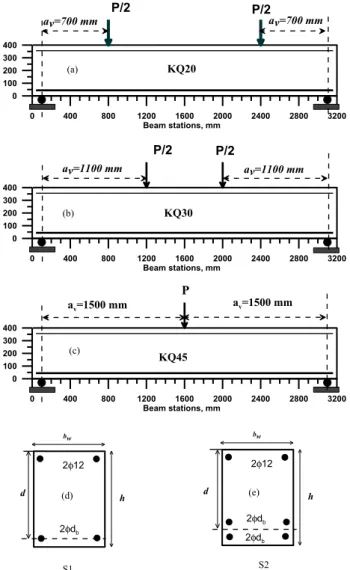
Details of the twelve specimens are provided in Figure 2 and in Table 3. The common features in-clude a nominal depth of 400 mm, a width of 200 mm, and a total length of 3.2 m with a clear span of 3.0 m. The specimens of this study were designed with four reinforcement ratios (0.45 % to 2.4 %) chosen to cover the practical spectrum of flexural reinforcements, the lowest is slightly above the code minimum and the largest is slightly above the recommended maximum reinforcement ra-tio. The loading was arranged to create a number of shear span ratios in the range of 2.0 to 4.7. These arrangements resulted in twelve specimens, having the same cross-section, length, and con-crete material properties.
The average concrete strength of these beams was 27 MPa supplied from a local ready mixed concrete company with a 20 mm maximum aggregate size. Proper instrumentations were provided to measure loading, deflections and strains throughout the loading history.
Figure 2 Beam layout details and loading: (a) KQ20 where av/h=1.75; (b) KQ30 where av/h=2.75; (c) KQ45 where av/h=3.75; (d) cross section S1 for R1 and R2; (e) cross section S2 for R3 and R4.
0 400 800 1200 1600 2000 2400 2800 3200 Beam stations, mm
0 100 200 300 400
P/2 av=700 mm
KQ20
av=700 mm P/2
0 400 800 1200 1600 2000 2400 2800 3200 Beam stations, mm
0 100 200 300 400
P/2
av=1100 mm
KQ30
av=1100 mm P/2
0 400 800 1200 1600 2000 2400 2800 3200 Beam stations, mm
0 100 200 300 400
P
KQ45
av=1500 mm av=1500 mm
bw
h
2φ12
2φdb
h
2φ12
2φdb
2φdb
bw
d d
(a)
(b)
(c)
(d) (e)
Latin American Journal of Solids and Structures 11(2014) 093 - 112
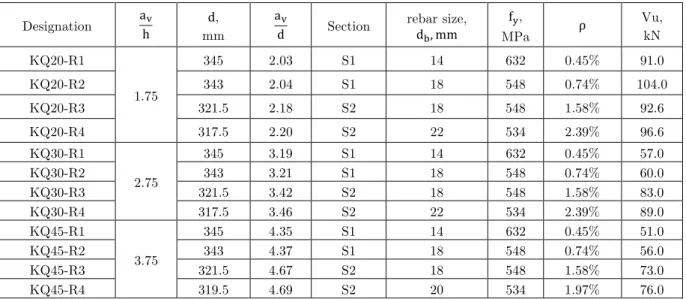
Table 3 beam details and Shear strength at failure.
Designation a! h
d,
mm
a!
d Section
rebar size,
d!,mm
f!,
MPa ρ
Vu, kN
KQ20-R1
1.75
345 2.03 S1 14 632 0.45% 91.0
KQ20-R2 343 2.04 S1 18 548 0.74% 104.0
KQ20-R3 321.5 2.18 S2 18 548 1.58% 92.6
KQ20-R4 317.5 2.20 S2 22 534 2.39% 96.6
KQ30-R1
2.75
345 3.19 S1 14 632 0.45% 57.0
KQ30-R2 343 3.21 S1 18 548 0.74% 60.0
KQ30-R3 321.5 3.42 S2 18 548 1.58% 83.0
KQ30-R4 317.5 3.46 S2 22 534 2.39% 89.0
KQ45-R1
3.75
345 4.35 S1 14 632 0.45% 51.0
KQ45-R2 343 4.37 S1 18 548 0.74% 56.0
KQ45-R3 321.5 4.67 S2 18 548 1.58% 73.0
KQ45-R4 319.5 4.69 S2 20 534 1.97% 76.0
3 SHEAR-LONGITUDINAL STRAIN RELATIONSHIP
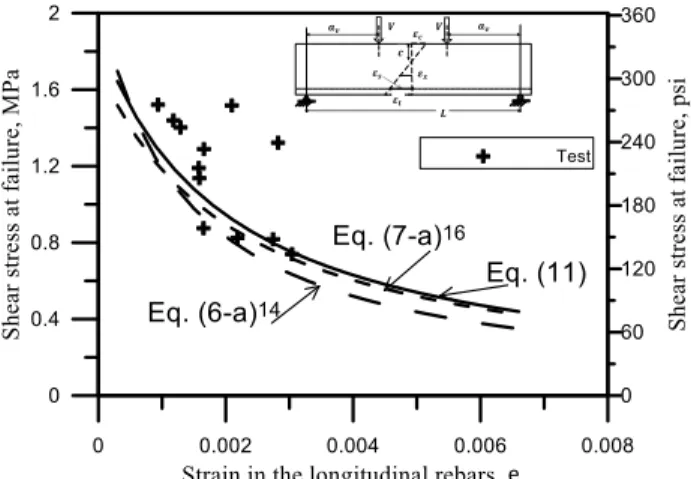
Experimentally, the strains in the longitudinal rebars at the mid-span of each beam were recorded along with the loading V, covering the full loading history. From the continuous record of strain versus applied load, the strain at maximum load was extracted for each beam. Because all beams had a shear mode of failure, the strain in each beam was considered as the critical strain that is associated with shear strength. The average shear strength, �
!=�/( �!�), versus the critical
longi-tudinal strains, �!, is shown in Figure 3. The data points in the figure show some scatter, however,
the overall trend is that as the strain increases, the shear strength decreases.
For comparison with previous studies, the average shear stresses �!=�!/( �!�) from Eq. (6-a)
and Eq. (7-a) versus longitudinal strain, �!, were plotted in Figure 3. For this purpose, the strains �
! were replaced by equivalent rebar longitudinal strains, �!, as assumed in the original formulation
of these equations. In Eq. (6-a) [CSA A23.3-2004], the strain �
! is taken as half the rebar strain (i.e. �!≈�!/2)while in (7-a) [Muttoni and Ruiz, 2008 ], the strain �! is taken as �!≈0.41 �!. The
fig-ure shows that the two equations give similar trend for the shear resistance degradation and they are in general agreement with the test data.
This study adopts an equation to describe the shear resistance-longitudinal strain relationship similar to Eq. (4), with two modifications: the effect of concrete strength is expressed as �!! !/
! and
the longitudinal strain is taken at the reinforcement level, such that �!=�!. The use of �!! !/!
instead of �!! !/! was chosen due to the poor correlation of the latter for high strength concrete
[Zsutty, 1968; Rebeiz, 1999] while the use of �!=�! was chosen as being a practical reference. The
Latin American Journal of Solids and Structures 11(2014) 093 - 112
V !=
0.63
1+500 ε! f!
! !! b! d (11)
The average shear stress based on Eq. (11) versus the longitudinal strain in the rebar is plotted in Figure 3. It can be seen that Eq. (11) leads to a relationship that is consistent with Eq. (6-a) [CSA A23.3-2004] and Eq. (7-a) [Muttoni and Ruiz, 2008].
Figure 3 Shear stress degradation versus longitudinal strain, ε!. 4 SHEAR DEMAND-LONGITUDINAL STRAIN RELATIONSHIP
As shown in Figure 1, when a beam is subjected to a monotonic gradually increasing load, the beam deforms due to the internal actions of shear forces and bending moments. To establish a shear de-mand-strain relationship that is compatible with the shear resistance-strain relationship, the defor-mations may be represented macroscopically by the longitudinal strain in the main rebars at mid-span. The choice of mid-span strain does not imply any assumptions with respect to the location of the shear diagonal crack.
In developing the shear demand-longitudinal strain relationship, the first step is to compute sev-eral values for the sectional moment in a range that extends from approximately cracking moment to the ultimate moment. The moment is to be computed on the basis of equilibrium, compatibility and constitutive material relationships in an incremental form, as explained in details in the next section. For each intermediate moment, �!
!, and its companion tensile strain at the reinforcement
level, ε!!, a typical point on the shear demand curve, (ε!!,�
!
!
), is computed, such as:
V
!! = M!!/a! (12)
Eq. (12) needs to be repeated for other values of �!
! in order to produce a smooth shear demand
Latin American Journal of Solids and Structures 11(2014) 093 - 112
the span [Kani, 1966] regardless of the critical section location. Therefore, the equivalent shear span may be defined as:
a!=M!"#
V!"# (13)
5 DETAILS OF THE PROPOSED PROCEDURE
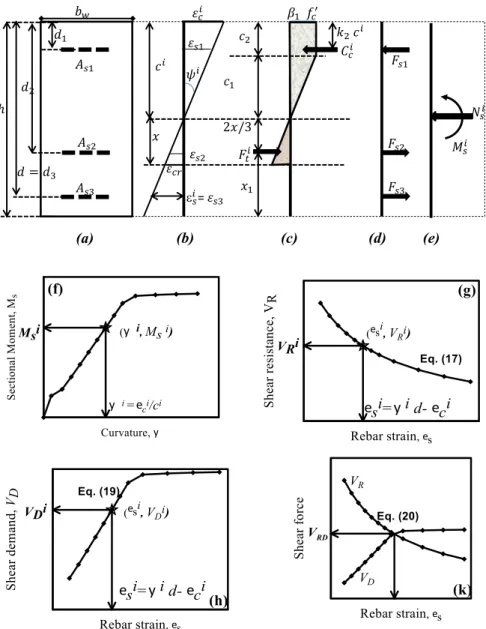
The proposed procedure encompasses four components, namely: a) moment-curvature for the sec-tion; b) shear resistance curve; c) shear demand curve; and, (d) basic shear strength from the inter-section of demand-resistance curves. The procedural steps are represented schematically and in a flowchart in Figure 4 and Figure 5, respectively.
5.1 Moment-curvature assumptions
The moment-curvature for a reinforced concrete cross section is an important element for linking the shear resistance and demand; it is developed on the assumptions of strain compatibility and force equilibrium under appropriate strain-stress assumptions for the materials. The steps of devel-opment are presented schematically in Figure 4 (a to e), by the flow chart in Figure 5, and summa-rized as follows:
1. The initial step is to be made with reference to Figure 4 (a and b), where assumptions are to be made regarding the concrete compressive strain value (�!!≤�!!≤�!!) and a neutral axis depth, �!, where these strain limits are as specified in Figure 5.
2. For each strain value, �!!, assume a neutral axis depth, �!, and utilize this value to deter-mine the strains, stresses, and forces in the rebar layers and the concrete on the assump-tion of compatibility, linear strain distribuassump-tion, and constitutive relaassump-tionships. This step is detailed in the flow chart in Figure 5 (Boxes: A, B, and C) along with Figure 4 (a to d). 3. The equilibrium of the forces from concrete compression, �!!, concrete tension, �!!, and
re-bar layers, �!", are to be verified, such that the net axial force �! !
≅0. This may require adjusting the neutral axis value, �!, using an appropriate iteration scheme, where:
�!
! =�!!+
�!!+ �!"
!
(14)
4. Once equilibrium is achieved, the moment �!
!, associated with ε !
!, and �!, is to be
ob-tained as the summation of the moments from concrete compression, �! !
, concrete tension, �!
!
, and rebar layers, �!". Eq. (15) gives the moment �! !
while the companion curvature, �!, is given by Eq. (16), where a typical moment-curvature curve is shown in Figure 4(f).
�!
!
= �!
!
+ �!!+ �!" !
Latin American Journal of Solids and Structures 11(2014) 093 - 112 �!
=ε!! /�!
(16)
5. Steps 2,3, and 4 are to be repeated for a predefined number of increments, n, which can be around 10 increments to cover the range of strains (�!!≤�
! ! ≤�
!
!) in ascending order. The
results of �!!, �! and �!! are to be tabulated in order to compute ε!!, � !
! , and �
!
!
, as follows.
5.2 Shear resistance curve
The shear resistance given by Eq. (11) can be modified to account for the short shear span ratio effect as suggested by Zsutty for �!/� less than 2.5 such that �=2.5 � /�! ≥1; thus the final form
of the shear resistance-longitudinal strain relationship is as follows:
�
!
!
=� !.!" !!!"" ε!! �!
! !! �! �; (MPa, mm, N) (17-a)
where,
ε!! =�!
�−ε!! (18)
A typical point on the resistance curve, (ε!!,V
!!), can be computed from Eq. (17) and Eq. (18), as
shown in Figure 4 (g).
5.3 Shear demand curve
A typical point on the shear demand curve, (ε!!,�
! !
), as shown in Figure 4 (h), is obtained by substituting �!
! and �
!, such that: �
! !
= �! !
/�! (19)
where ε!! is as defined by Eq. (18). Equations (17) to (19) need to be repeated for all strain
val-ues (�!! ≤�!! ≤�!!) in order to generate the demand and resistance curves (ε!!, �
! !, �
! !).
5.4 Basic shear strength
Following the steps above and as illustrated by Figure 4 and Figure 5, the shear demand curve and the shear resistance curve versus longitudinal strain can be generated. Their general shapes are as shown Figure 4(k), where the shear demand follows an ascending path while the shear resistance follows a descending path. Their intersection point defines the basic shear strength, �
!", for a
nor-mal size beam without stirrups, such as:
�
Latin American Journal of Solids and Structures 11(2014) 093 - 112
Figure 4 Schematic steps for computing the shear strength using the proposed procedure: (a) cross-section with rebar layers; (b) strain distribution; (c) concrete stresses and forces; (d) rebar forces; (e) resultants; (f) moment-curvature; (g) shear resistance; (h) shear
de-mand; and (k) resistance-demand intersection.
=
Latin American Journal of Solids and Structures 11(2014) 093 - 112 Figure 5 Flowchart for computing shear strength using the proposed procedure.
+
No ; next Given , , , ,
, , n=10
• For increment , i
= +
Fig. 4 (a,b,c)
;
+
? Yes;
compute
No; revise Assume/adjust
Fig. 4 (a,b,c) Fig. 4 (a,b,d)
For each rebar layer, j
A: Concrete‐ compression
B: Concrete‐
Latin American Journal of Solids and Structures 11(2014) 093 - 112
5.5 Size effect factor
Studies (ACI-ASCE Committee 445, 2009) have shown that there is a very significant size effect or depth of member effect on the shear strength of members without transverse reinforcement where the average shear stress to cause failure decreases with the increase of the effective depth. Several models have been proposed in the literature, among them those shown in Table 1. This study adopts a size reduction factor following CSA A23.3-2004 with a slight modification. The size factor is to modify the basic shear strength in Eq. (20), such that:
�!=
�
!" , ℎ≤400 �� 1200
800+ℎ �!", ℎ>400 ��
(21-a)
6 ILLUSTRATION OF THE PROCEDURE
The proposed procedure is illustrated by two examples to account for shear span ratios and rein-forcement ratios, as shown in Figure 6 (a), and Figure 6 (b), respectively. Figure 6 (a) shows the analysis of beams KQ30-R2 (�!
�=3.2) and KQ45-R2 (
�!
�=4.4) where they differ only in the
value of the shear span, �!. The two beams share the same resistance curve, �
!, but each beam has
its own demand curve, �
!, because of the different values of �!, as per Eq. (19). Accordingly, the
shear strengths for the two beams are 62.2 kN and 55.1 kN versus the test results of 60 kN and 56 kN, respectively. This indicates that the procedure accounts intrinsically for the effect of shear span ratio.
The effect of reinforcement ratios with a constant shear span as represented by beams KQ30-R1, and KQ30-R3 is shown in Figure 6(b). The shear resistance curves, �
!, are approximately the same,
affected only by the difference in the effective depth, d. Even though the two beams share the same
shear span, the beams have two distinguished demand curves, because of the effect of the rein-forcement ratio on the sectional moment, �!, as per Eq. (19). Hence, the influence of the
Latin American Journal of Solids and Structures 11(2014) 093 - 112 Figure 6 Implementation of the RD procedure: (a) two shear span ratios; (b) two reinforcement ratios.
7 COMPARISONS WITH TEST RESULTS
For verification, the proposed procedure was applied to 232 tested beams without stirrups from ten sources as summarized in Table 2. The beams had a broad range of design parameters: 11 ≤�!!≤
99 MPa; 0.45 ≤ρ≤ 3.36 (percent); 70 ≤�≤ 1200 mm; and 1 ≤�!
�≤ 8.
The results of the comparison in terms of the predicted strength to the measured experimental strength � �!"#! are presented in Figure 7(a) versus the shear span ratio. The figure contains
Latin American Journal of Solids and Structures 11(2014) 093 - 112
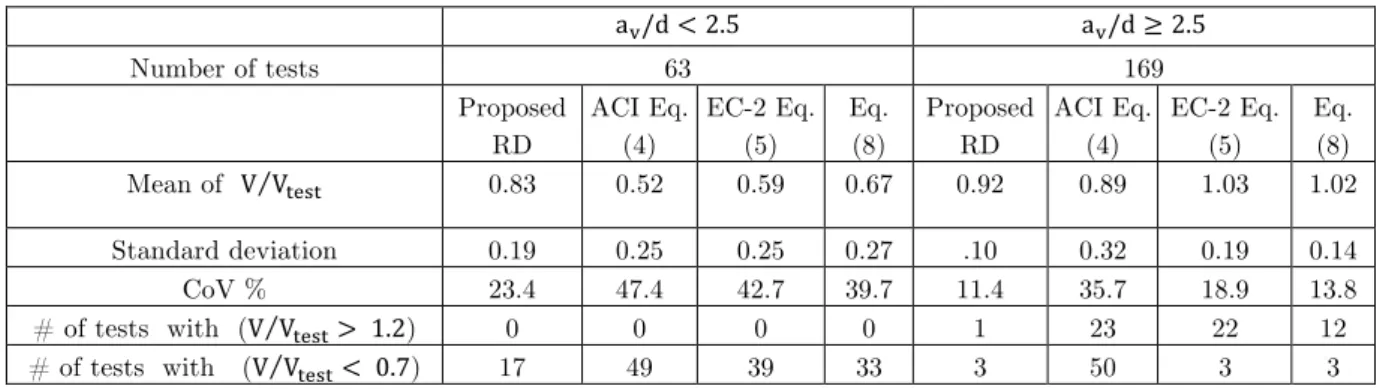
0.1 and a CoV of 11.4 percent. This represents a good prediction, especially since it produced a low scatter and a mean value on the conservative side, which are desired features in a design procedure in order to produce a uniform margin of safety. For analyzing the results, two limits were intro-duced conveniently: � �!"#! = 1.2 for the unconservative limit while (� �!"#!= 0.7) represents the
over-conservative limit. Only one prediction ratio lies above the unconservative limit and three prediction ratios fall below the over-conservative limit.
For short beams where (�!
�≤ 2.5), the proposed procedure became more on the conservative
side with a mean value of 0.83, a standard deviation of 0.19 and a CoV of 23.4 percent. This level of prediction is expected, in part because of the existing scatter in the test results, and also because the proposed procedure is more oriented towards slender beams behavior.
To view this procedure in the context of other shear models, the same database was analyzed by ACI-318 Eq. (2), EC-2 [Eurocode 2-2004] Eq. (3) and Zararis and Papadakis (2001) Eq. (8). For slender beams, the equation of ACI-318 leads to the highest scatter with a CoV of 35.7 percent and the highest number of predictions outside the above adopted limits, as shown in Figure 7(b) and Table 4. EC-2equation (Figure 7(c)) leads to a better performance than ACI equation while Zararis and Papadakis equations (Figure 7(d)) produce a much better performance with a CoV of 13.8 per-cent and lower number of predictions outside the limits.
For short beams where (�!
�≤ 2.5), the above shear models became more conservative with a
higher level of scatter. In addition to the existing scatter in the test results, the equations of ACI and EC-2 do not contain a parameter to account for the arch action in short beams. Eq. (8) by Zararis and Papadakis accounts for the effect of �!
�, however, the scatter as measured by the
CoV of 39.7 percent and the number of predictions outside the limits are relatively high.
Table 4 Summary of test results.
a!/d<2.5 a!/d≥2.5
Number of tests 63 169
Proposed RD
ACI Eq. (4)
EC-2 Eq. (5)
Eq. (8)
Proposed RD
ACI Eq. (4)
EC-2 Eq. (5)
Eq. (8) Mean of V V!"#! 0.83 0.52 0.59 0.67 0.92 0.89 1.03 1.02
Standard deviation 0.19 0.25 0.25 0.27 .10 0.32 0.19 0.14
CoV % 23.4 47.4 42.7 39.7 11.4 35.7 18.9 13.8
Latin American Journal of Solids and Structures 11(2014) 093 - 112 Figure 7 Shear strength predictions for test specimens using: (a) The proposed RD procedure; (b) ACI-318-11 Eq. (2); (c) Eurocode
Ec-2 Eq. (3); and, (d) Zararis and Papadakis Eq. 8.
0 2 4 6 8
Shear span ratio, (av/d) 0 0.4 0.8 1.2 1.6 2 2.4 S h ea r ca p ac ity r at io ( Vp re d ic ti o n /V te st ) Bhal Mattock Taylor
Collins & Kuchma study
Kani-1 Kani-2 Papadakis Mphonde & Frantz Walraven
Leonhardt & Walther
(a)
0 2 4 6 8
Shear span ratio, (av/d) 0 0.4 0.8 1.2 1.6 2 2.4 S h ea r ca p ac ity r at io ( V p re d ic ti o n /V te st ) ACI-318-08 (b)
0 2 4 6 8
Shear span ratio, (av/d) 0 0.4 0.8 1.2 1.6 2 2.4 S h ea r ca p ac ity r at io ( Vp re d ic ti o n /V te st ) EC-2-04 (c)
0 2 4 6 8
Shear span ratio, (av/d) 0 0.4 0.8 1.2 1.6 2 2.4 S h ea r ca p ac ity r at io ( V p re d ic ti o n /V te st )
Latin American Journal of Solids and Structures 11(2014) 093 - 112
8 ASSESSMENT OF TREND WITH KEY PARAMETERS
The contribution of the individual design parameters (�!!; ρ; �!/�; and �) is assessed by the
pro-posed RD procedure and compared with test results. It is desirable that a design procedure can account for the complex effects of these parameters. From the database in Table 2, the specimens that had similar dimensions and properties were selected with the aim of isolating the influence of each parameter by keeping the others approximately constant. To explore the interdependency among parameters, each parameter was investigated under two sets of properties as permitted by available data.
As shown in Figure 8 (a), as �!/� decreases, the shear strength of the beams increases and this
trend is more pronounced when �!/�≤2.5, as indicated by test results and the proposed
proce-dure. In the proposed procedure, as �! becomes smaller, the shear demand curve increases as per
Eq. (19), and demonstrated in Figure 6(a). Furthermore, the factor, �, introduced in Eq. (17)
evi-dently contributed well.
In Figure 8 (b), as ρ increases, the shear strength of the beams increases and this pattern is
shown in the test results and the RD procedure. In the RD formulation, the effect of ρ takes place
through the sectional moment, �!, in Eq. (19) as demonstrated in Figure 6 (b), which indicates
that shear strength increases with flexural reinforcement ratio.
In Figure 8 (c), as � increases, the shear strength of the beams decreases and this pattern is
shown in the test results and the RD procedure. In the proposed procedure, the effect of �, was
introduced by the size effect factor in Eq. (21). Evidently, it accounts for this effect properly by predicting the trend and magnitude.
In Figure 8 (d), the use of concrete with high �!! does not show a significant increase in the shear
strength of the beams, especially when associated with low ρ. This pattern is expressed
experimen-tally and by the RD procedure. In the formulation, �!!, enters explicitly in the resistance curve as �!!
!
! in Eq. (17), and implicitly through �
!, in Eq. (19). The effect of �!! on sectional moment is
known not to be significant and to be dependent on ρ. Furthermore, Figure 8 (d) shows Eq. (4)
where �!! is the sole shear strength predictor and its inadequacy is obvious in being very
Latin American Journal of Solids and Structures 11(2014) 093 - 112 Figure 8-Influence of individual key parameters on shear strength as predicted by RD procedure and compared with test results: (a) shear
span ratio; (b) reinforcement ratio; (c) effective depth; and (d) concrete strength.
9 SUMMARY AND CONCLUSIONS
The paper presented a rational design procedure for computing the concrete shear contributions, V!,
that can be used in Eq. (1). The procedure employs the principles of resistance and demand in the framework of the moment-curvature relationship of the beam cross-section. In this procedure, the shear resistance relationship was expressed as a function of the longitudinal flexural strain and the concrete tensile strength indicator in the form of �!! (!/
!). The shear resistance was enhanced by
Latin American Journal of Solids and Structures 11(2014) 093 - 112
The shear demand relationship was developed from the equilibrium requirement between exter-nal and interexter-nal moments; as a result, a relationship was established between flexural strain and the shear demand. The basic shear strength, under a given loading was determined from the intersec-tion of the shear demand curve and the shear resistance curve. This basic shear strength was modi-fied by a size effect factor when the total depth is greater than 400 mm (16 in.).
The procedure was verified against a database of 232 beams collected from 10 sources with a broad range of parameters. The performance of the procedure in predicting the shear strength was presented in different forms showing good predictions in terms of magnitude and trend. Further-more, a number of prediction equations were employed to allow viewing this procedure in the con-text of previous studies.
A cknow ledgm ent The author gratefully acknowledges the support provided by the National Plan for Science & Technology (NPST), King Saud University, Saudi Arabia under Grant ADV-1023. Any opinions, findings, and conclusions expressed in this paper are those of the writer and do not necessarily reflect the views of the sponsor.
References
AASHTO. (2008). AASHTO LRFD Bridge Design Specifications, American Association of State Highway and Transportation Officials.
ACI-318 (2011). Building Code Requirements for Structural Concrete (ACI 318-08) and Commentary, ACI, Farmington Hills, MI, USA, 510 pp.
Bentz, E. C., Vecchio, F. J. and Collins, M. P. ( 2006). Simplified Modified Compression Field Theory for Calcu-lating Shear Strength of Reinforced Concrete Elements, ACI Structural Journal, 103(4): 614-624.
Bhal, N. S. (1967). Über den Einfluss der Balkenhöhe auf die Schubtragfähigkeit von einfeldrigen Stahlbet-onbalken mit und ohne Schubbewehrung,” PhD thesis, Stuttgart University, 125 pp.
Brown, M. D. Bayrak, O., and Jirsa, J. O. (2006). Design for Shear Based on Loading Conditions, ACI Structur-al JournStructur-al, 103(4): 541-550.
Choi, K-K, Park, H-G, and Wight, J. K. (2007). Unified Shear Strength Model for Reinforced Concrete Beams— Part I: Development, ACI Structural Journal, 104(2): 142-152.
Choi, K-K, and Park, H-G (2007). Unified Shear Strength Model for Reinforced Concrete Beams—Part II: Verifi-cation and Simplified Method, ACI Structural Journal, 104(2): 153-161.
Collins, M. P., Bentz, E. C., and Sherwood, E. G. (2007). An adequate theory for the shear strength of reinforced concrete structures, Morley Symposium on Concrete Plasticity and its Application. University of Cambridge, 75-94.
Collins, M. P., and Kuchma, D. (1999). How safe are our large, slightly reinforced concrete beams, slabs, and footings?, ACI Structural Journal, 96(4): 482-490.
CSA Committee A23.3 (2004). Design of Concrete Structures, Canadian Standards Association, Mississauga, On-tario, Canada, 214 pp.
Eurocode 2(2004). Design of Concrete Structures, Part 1-1: General Rules and Rules for Buildings (EN1992-1-1), European Committee for Standardization, Brussels, Belgium, 230 pp.
Latin American Journal of Solids and Structures 11(2014) 093 - 112 Joint ACI-ASCE Committee 426 (1987). The shear strength of reinforced concrete members, Part 4 of ACI Man-ual of Concrete Practice, ACI, Farmington Hills, MI, 111 pp.
Joint ACI-ASCE Committee 445 (Reapproved 2009). Recent Approaches to Shear Design of Structural Concrete, ACI Manual of Concrete Practice, ACI, Farmington Hills, MI, USA, 56 pp.
Kani, G. N. J. (1966). Basic facts concerning shear failure, ACI Journal, 63(6): 675-692.
Kim, J-K, and Park, Y-D (1996). Prediction of Shear Strength of Reinforced Concrete Beams without Web Rein-forcement, ACI Materials Journal, 93(3): 213-222.
Leonhardt, F., and Walther, R. (1964). The Stuttgart Shear Tests,” C&CA Translation, No. 111, Cement and Concrete Association, London, 134 pp.
Mattock, A. H. (1969). Diagonal tension cracking in concrete beams with axial forces, Journal of the Structural Division, ASCE, 95(9): 1887-1900.
Mphonde, A. G., and Frantz, G. C. (1984). Shear tests of high- and low strength concrete beams without stir-rups, ACI Journal, 81(4): 350-357.
Muttoni, A., and Ruiz, M. F. (2008). Shear Strength of Members without Transverse Reinforcement as Function of Critical Shear Crack Width,” ACI Structural Journal, 105(2): 163-172.
Okamura, H., and Higai, T. (1980). Proposed Design Equation for Shear Strength of R.C. Beams without Web Reinforcement, Proceedings, Japan Society of Civil Engineering, 300:131–141.
Papadakis, G., “Shear failure of reinforced concrete beams without stirrups,” PhD dissertation, Dept. of Civ. En-grg., Aristotle University of Thessaloniki, Thessaloniki, Greece.
Park, H-G, Choi, K-K, and Wight, J. K. (2006). Strain-Based Shear Strength Model for Slender Beams without Web Reinforcement, ACI Structural Journal, 103(6): 783-793.
Park, H-G. , Kang, S., Choi, K. K. (2013). Analytical model for shear strength of ordinary and prestressed con-crete beams, Engineering Structures, 46: 94–103.
Rao, G. A., Sundaresan, R.(2012). Evaluation of size effect on shear strength of reinforced concrete deep beams using refined strut-and-tie model, Sadhana, 37:1 89-105.
Rebeiz, K. S. (1999). Shear strength prediction for concrete members, Journal of Structural Engineering, ASCE, 125(3): 301-308.
Rombach, G.A., Kohl, M., Nghiep, V.H. (2011). Shear Design of Concrete Members without Shear Reinforce-ment—A Solved Problem?, Procedia Engineering 14: 134–140.
Shuraim, Ahmed B. (2013). Behavior and shear design provisions of reinforced concrete D-region beams, Journal of King Saud University - Engineering Sciences, 25:1 65-74.
Sneed, L. H., Ramirez, J. A.(2010). Influence of effective depth on shear strength of concrete beams— Experimental Study, ACI Structural Journal, 107:5 554-562.
Taylor, H. P. J.(1972). Shear strength of large beams, Journal of the Structural Division, ASCE, 98(11): 2473-2490.
Tureyen, A. K., and Frosch, R. J. (2003). Concrete Shear Strength: Another Perspective, ACI Structural Journal, 100(5): 609- 615.
Vecchio, F. J., and Collins, M. P.(1986). The Modified Compression Field Theory for Reinforced Concrete Ele-ments Subjected to Shear, ACI Journal, 83(2): 219-231.
Walraven, J. C. (1978) “The influence of depth on the shear strength of lightweight concrete beams without shear reinforcement,” Stevin Lab. Rep. No. 5-78-4, Delft University of Technology, Delft, The Netherlands.
Latin American Journal of Solids and Structures 11(2014) 093 - 112
Zararis, P. D., and Papadakis, G. Ch. (2001). Diagonal shear failure and size effect in RC beams without web re-inforcement, Journal of Structural Engineering, ASCE, 127(7): 733-742.