Abs tract
This paper presents analytical and experimental results on ductility of reinforced lightweight concrete beams and columns in the form of moment curvature relationships, and compares the response with that of normal reinforced concrete members. The experimental part is limited to flexural tests on beams made of lightweight concrete. The latter is obtained with natural lightweight aggregates. Concre-te and sConcre-teel stress-strain models in compression and Concre-tension are integrated analytically through the section in order to derive the resulting moment and axial force. Lightweight concrete beams and columns showed a more ductile behavior than normal concrete members and the analytical model reproduced the response with very good accuracy. The lightweight ductility was more pronounced in columns subjected to axial compression forces and bending.
Key words
Lightweight concrete, moment curvature, stress integration, ducti-lity
Ductility of reinforced lightweight concrete beams and
columns
1 INTRODUCTION
Lightweight concrete is no longer considered a special material. It is included in many codes of practice, such as the American Concrete Institute ACI (1987), as normal concrete but with a lower density and increased deformability. The LWC material properties and mechanics have long been identified and still continue to attract interest as shown by the Works of Hon Zhi (2007), Koh et al. (2008) and Muyasser et al. (20011). Many structural and bridge applications have been reported by authors such as Russel (2007) and Waldron et al. (2005). High strength has also been achieved by Katkhuda et al. (2009), Yasar et al. (2004) and others. LWC offers undeniable isolation advantages but the reduction in the overall cost generated by the lower dead loads is often overwhelmed by the higher production cost, especially with factory produced ex-panded clay lightweight aggregates. LWC becomes however more challenging when using natural volcanic rocks reserves to produce lightweight aggregates. On the other hand, even if the reduced stiffness of LWC concrete requires a tighter deflection control, its higher ultimate strain confers a
A b de lh am id Ch ari f * M. J ama l Sh an na g Sa le h Dg ha ith er
King Saud University,
Latin American Journal of Solids and Structures 11 (2014) 1251-1274
major advantage to LWC in the form of improved ductility and better energy absorption capaci-ty.
2 A N A LY T IC A L M O M E N T -C U R V A T U R E R ELA T IO N SH IP
An analytical integration method of stress resultants over an arbitrary shaped section was formu-lated and used to compute the axial force and moment. This method, dealing with biaxial ben-ding combined with an axial force, is described in detail in the Works of Zupan, Saje (2005) and Charif et al. (2012). It performs better than the various numerical integration techniques such as those described by Sfakianakis (1999), Bonet et al. (2006) and Charalampakis, Koumousis (2008). The main steps are summarized here. Using the direct sign convention shown in Figure 1, the normal stress resultants for a beam-column member, subjected to an axial force and biaxial ben-ding, are given by:
N
=
∫
σ
dA
=
∫∫
σ
dy dz
M
y=
∫
σ
z dA
=
∫∫
σ
z dy dz
M
z=
−
∫
σ
y dA
=
−
∫∫
σ
y dy dz
(1)
Figure 1 General section under axial force and biaxial bending (a): Inclined neutral axis in global axes
(b): Rotated section and use of local neutral axes
Y
Z
M
zM
yLatin American Journal of Solids and Structures 11 (2014) 1251-1274 3 ST R E SS R E SU LT A N T S FO R D ISC R E T E B A R R E IN FO R C E M E N T
Reinforcing bars are lumped at their centroid points with coordinates ybi and zbi. Their
contribu-tion is easily determined from the corresponding area and stress. To account for the displaced embedding concrete, an equivalent stress is subtracted.
N
B=
F
bii
∑
=
A
bi(
σ
bi−σ
ci)
i
∑
M
By=
F
bii
∑
z
bi=
A
bi(
σ
bi
−
σ
ci)z
bi i∑
M
Bz=
−
F
bii
∑
y
bi=
−
A
bi(
σ
bi
−
σ
ci)
i∑
y
bi(2)
Bar stress (
σ
bi) and concrete stress (σ
ci) at the same point i are easily computed using co-rresponding stress-strain models. The capacity of a section with discrete reinforcement is obtained by combining equations (1) and (2). All other forms of non-discrete reinforcement use equations (1) by summing integrations over all the components of the section.The axial force in (1) and (2) is independent of y-z axis system whereas bending moments depend on the origin and orientations of these axes. It is common to express moments about the cross section centroid. This point is thus considered as the origin. With the assumption of plane sections and strain compatibility (perfect bond between various components), the total normal strain is a combination of axial force and bending moment effects:
ε
=
ε
0+
κ
y
z
−κ
zy
(3)ε
0 is the centroidal normal strain, whereasκ
y andκ
z are curvatures about respective axes.For dissymmetric sections, bending about one axis causes curvatures about both axes and
bending angle
M
zM
y⎛
⎝⎜
⎞
⎠⎟
is in general different from neutral axis angleκ
zκ
y⎛
⎝⎜
⎞
⎠⎟
.4 EX P R ESSIO N S O F IN T EG R A LS IN LO C A L N EU T R A L C O O R D IN A T ES
Normal strain (3) and the resulting normal stress are functions of both y and z coordinates. There exists a system of axes (
ζ
,
η
) as shown in Figure 1 where normal strain and stress depend on coordinate η only (ζ
-axis parallel to the neutral axis).κη
ε
ε
=
0+
(4)Where
κ
=
κ
ycos
φ
+
κ
zsin
φ
and φ=
arctan
κ
zκ
y⎛
⎝⎜
⎞
Latin American Journal of Solids and Structures 11 (2014) 1251-1274
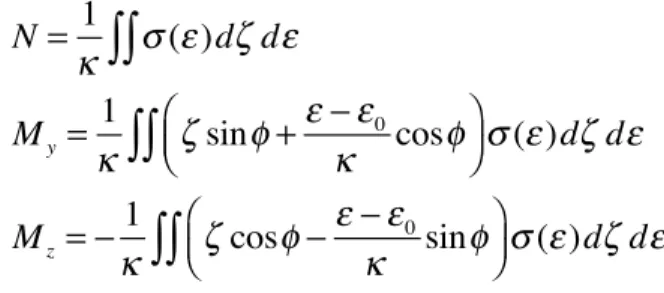
Integral relations (1) can be equally expressed with respect to coordinates (
ζ
,
η
), and then by virtue of relation (4) with respect to coordinates (ζ
,
ε
). We obtain:N
=
1
κ
∫∫
σ
(
ε
)
d
ζ
d
ε
M
y=
1
κ
ζ
sin
φ
+
ε
−
ε
0κ
cos
φ
⎛
⎝⎜
⎞
⎠⎟
σ
(
ε
)
d
ζ
d
ε
∫∫
M
z=
−
1
κ
ζ
cos
φ
−
ε
−
ε
0κ
sin
φ
⎛
⎝⎜
⎞
⎠⎟
σ
(
ε
)
d
ζ
d
ε
∫∫
(6)
5 B O U N D A R Y IN T E G R A T IO N O F ST R E SS R ESU LT A N T S
Green's theorem is a very useful tool as it reduces the problem dimension by replacing area inte-grals by path inteinte-grals along the border. The resulting boundary integration method offers many advantages and is very convenient for complex sections as it can elegantly handle various parts including voids. Figure 2 shows a composite section with three parts. The inner zone is either a void or a different material part. Figure 2b shows the appropriate vertex numbering (12 points) for the main part which eliminates the inner one, thanks to direction sign dependence of line inte-grals. If the inner part is not a void, it is dealt with similarly by a vertex numbering in the coun-terclockwise direction. The external skin reinforcement is also treated separately in the same way.
Figure 2 Border integration of a composite multi-polygon section (a): Composite section (b): Vertex numbering for main part
Figure 3 shows vertex numbering for the original section as well as identification of vertices for various parts. It is supposed in this case that both compression and tension models have two equations each as shown. The various parts are defined by lines parallel to the neutral axis, resul-ting in sub-polygons. The vertices for each part are shown in Table 1.
(a)
(b)
1, 5
2
3
4
6, 12
7
8
9
Latin American Journal of Solids and Structures 11 (2014) 1251-1274 Figure 3 Identification of vertices for various parts of the section
(a) Full-Section vertices (b) Vertices of various parts (c) Stress distribution across the section
Table 1 Vertices for various polygons in Figure 3
Polygon Full
Section Compression Zone Tension zone Compr. Part C1 Compr. Part C2 Tension Part T1 Tension Part T2
Points 1-2-3-4-5-6 1-2-c-d-5-e-f c-3-4-d-e-6-f 1-2-a-b a-c-d-5-e-f-b g-h-i-j c-g-j-d-e-6-f
Applying Green transformations to equations (6) leads to:
N
=
1
κ
!
∫
∂Aζ σ
(
ε
)
d
ε
M
y=
1
κ
ζ
22
sin
φ
+
ζ
ε
−
ε
0κ
cos
φ
⎛
⎝⎜
⎞
⎠⎟
σ
(
ε
)d
ε
∂A
!
∫
M
z=
−
1
κ
ζ
22
cos
φ
−
ζ
ε
−
ε
0κ
sin
φ
⎛
⎝⎜
⎞
⎠⎟
σ
(
ε
)
d
ε
∂A
!
∫
(7)
These integrations (7) are performed along the border lines of the section.
For a polygonal section, vertex points are expressed in (y , z) coordinates and then transfor-med to (
ζ
,
η
) coordinates. Each polygon side is identified by two successive vertices (v) and (v+1) with a linear relation between their coordinates:1 2 3 4 5 6
a
b
c
d
e
f
g
h
i
j
C1 C2 T1 T2(a)
(b)
Latin American Journal of Solids and Structures 11 (2014) 1251-1274
ζ
(
ε
)
=
s
v
ε
+
t
v withs
v=
ζ
v+1−
ζ
vε
v+1−
ε
vand
t
v
=
ζ
v−
s
vε
v (8)nv is the total number of vertices and point (nv +1) refers to the first vertex in order to complete
the closed boundary integral. Substitution and arrangement lead to:
N
=
1
κ
(
s
vI
2v+
t
vI
1v)
v=1nv
∑
M
j=
1
κ
(
c
v1jI
3v+
c
v2jI
2v+
c
v3jI
1v)
v=1nv
∑
j
=
2, 3
(9)
With:
c
v12
c
v22c
v32c
v13
c
v23c
v33⎡
⎣
⎢
⎢
⎤
⎦
⎥
⎥
=
cos
φ
sin
φ
sin
φ −
cos
φ
⎡
⎣
⎢
⎢
⎤
⎦
⎥
⎥
s
vκ
t
v−
s
vε
0κ
−
t
vε
0κ
s
v22
s
v
t
vt
v22
⎡
⎣
⎢
⎢
⎢
⎢
⎤
⎦
⎥
⎥
⎥
⎥
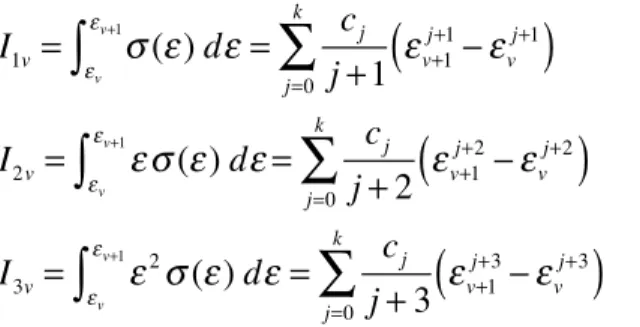
(10)The three different integrals in the previous relations are:
I
1v
=
σ
(
ε
)
d
ε
εvεv+1
∫
I
2v
=
ε σ
(
ε
)
d
ε
εvεv+1
∫
I
3v
=
ε
2
σ
(
ε
)
d
ε
εvεv+1
∫
(11)6 A N A LY T IC A L B O R D E R IN T E G R A T IO N O F P O LY N O M IA L M O D ELS
Nonlinear stress-strain models are usually expressed by one or two equations and the integrals (11) cannot be derived analytically in all cases. They are straightforward for polynomial models. For a polynomial stress-strain model of order k:
σ
(
ε
)
=
c
0+
c
1ε
+
c
2ε
2+
....
+
c
kε
k=
c
jε
j j=0k
∑
(12)Latin American Journal of Solids and Structures 11 (2014) 1251-1274
I
1v=
σ
(
ε
)
d
ε
εv εv+1
∫
=
c
jj
+
1
j=0
k
∑
ε
vj++11−
ε
v j+1
(
)
I
2v=
ε σ
(
ε
)
d
ε
εv εv+1
∫
=
c
jj
+
2
j=0
k
∑
ε
vj++12−
ε
v j+2
(
)
I
3v=
ε
2σ
(
ε
)
d
ε
εv εv+1
∫
=
c
jj
+
3
j=0
k
∑
ε
vj++13−
ε
v j+3
(
)
(13)
Relations (9) and (13) deliver closed-form solutions of normal stress resultants. It can be seen from (13) that all boundary lines parallel to the neutral axis
ε
v+1
=
ε
v(
)
have no contributions to force and moment resultants. This in fact is true by virtue of (11) and (9) whether the model is polynomial or not.This formulation cannot however be used for non-integrable material models. An alternative to using numerical integration, is replacing the original model by an appropriate polynomial fit and then use the present method. Charif et al. (2012) proved that this was more efficient than per-forming numerical integration on original models.
Apart from the moment-curvature relationship for a given constant axial force, the preceding formulation can also be used to determine N-My-Mz interaction curves and surfaces, and the
stress state for a given loading.
7 EX P ER IM EN T A L V A LID A T IO N O N B E A M FLEX U R E
7.1 Introduction
The present work is part of a strategic and ambitious project to promote LWC in Saudi Arabia using large reserves of natural basalt tuffs (scoria) and volcanic rocks available in some northwes-tern parts of the country, as reported by the Saudi Ministry of Petroleum (1998). Figure 4 shows some volcanic rock samples and the aggregates obtained after crushing and sieving. The various properties of these aggregates and the mix design techniques used are described by Shannag et al. (2013). With a weight ranging from 1750 to 1950 kN/m3, compression strengths from 18.0 to 45.0 MPa, were obtained. Two concrete grades (25 and 35 MPa) are used in this work. Their stress-strain relationships, measured under displacement controlled loading, are shown in Figure 5.
Latin American Journal of Solids and Structures 11 (2014) 1251-1274
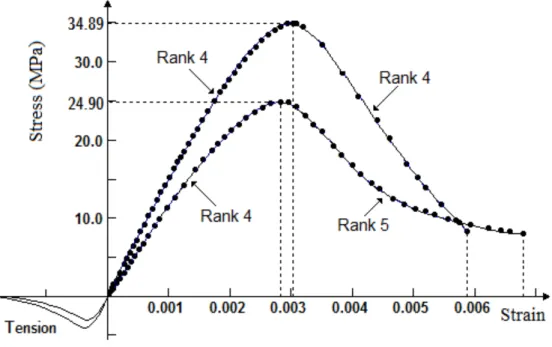
Figure 5 Measured compression stress-strain curves for LWC grades used
7.2 Experim ental flexural beam tests
Full scale beams were tested under third point loading until failure for both concrete grades. The under reinforced beams were provided with sufficient stirrups to prevent shear failure (Figure 6). The bottom tensile steel consisted of three bars of 16 or 20 mm diameter, corresponding to 0.9% and 1.5% steel ratios. The beams were loaded up to failure and the curvature was tracked through material strains using electrical gauges and transducers.
Figure 6 Flexural beam testing and dimensions
8 M A T ER IA L M O D ELIN G A N D M O M E N T -C U R V A T U R E R ESP O N SE FO R B E A M S
0.9 m 0.9 m
0.9 m
250 mm 3Ф16/20
2Ф10
Latin American Journal of Solids and Structures 11 (2014) 1251-1274
8.1 Material modeling
An integrated modeling strategy is used. The LWC material stress-strain models are first ap-proached by polynomials using an efficient constrained least square method. The resulting polynomial model is then analytically integrated to compute the stress resultants. The parameters of the equivalent rectangular stress block, having the same area and centroid as the original stress-strain curve, are also delivered. Polynomial modeling for the two lightweight concrete gra-des used is shown in Figure 7. In each case two polynomials of rank 4 or 5 are used. The rank is adjusted until the desired accuracy is achieved.
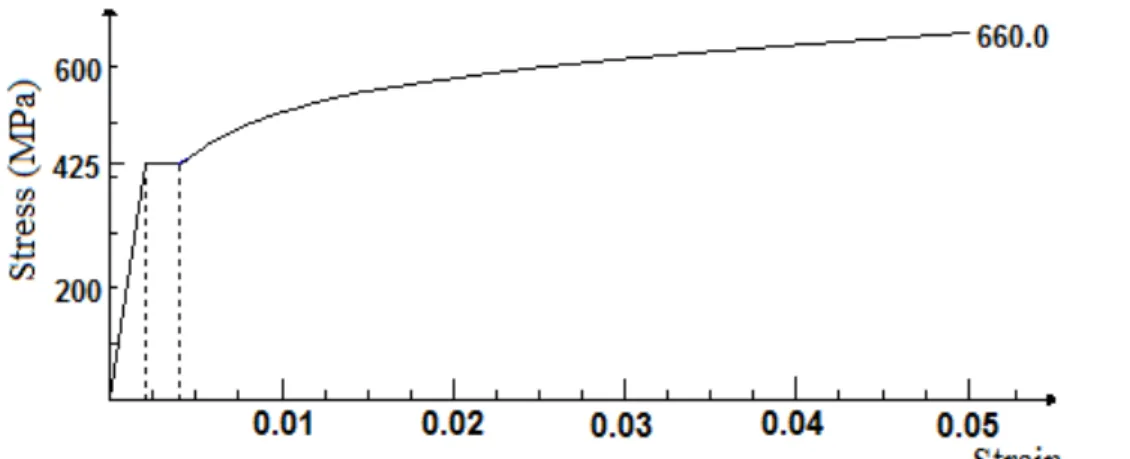
Concrete tension model and steel bar model are also analytically integrated. Concrete tensile stress-strain model was not directly recorded but it was based on the measured modulus of ruptu-re and assuming a parabolic variation with a quadratic decay (tension stiffening) as shown in Figure 7. The 16 and 20 mm reinforcing steel bars recorded an average yield strength of 425 MPa and exhibited strain hardening behavior up to an ultimate stress of 660 MPa (Figure 8). The nonlinear strain hardening was modeled using Rasmussen (2001) modified equation of Ramberg-Osgood.
Latin American Journal of Solids and Structures 11 (2014) 1251-1274
Figure 8 Steel model with yield plateau and nonlinear strain hardening
8.2 Moment-Curvature algorithm
The steps to compute moment curvature up to failure are:
1. Determine the initial section stress state under the constant axial force (if any). 2. Increase the top concrete strain using appropriate steps and for each level:
• Update tension steel strain to satisfy force equilibrium • Compute corresponding moment and curvature
The process is usually stopped when a failure criterion is reached. In this work the section strength is computed at any straining level, even beyond the material ultimate strains, and the algorithm is stopped only if there is a major strength drop. This allows load transfer between the various section components and is particularly convenient for analysis of complex composite sec-tions with many parts and different material properties. Limited local failures as well as the spread of crushing inside the concrete cover can thus be captured. Some significant points, such as the cracking and yielding moments, may be skipped by this incremental procedure. They are therefore determined separately and then added to the recorded points.
Latin American Journal of Solids and Structures 11 (2014) 1251-1274 Figure 9 Predicted and measured moment-curvature for grade 25 LWC beams
Latin American Journal of Solids and Structures 11 (2014) 1251-1274
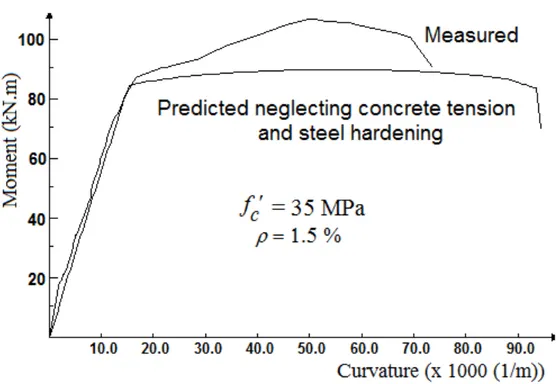
Figure 11 Predicted and measured moment-curvature for grade 35 LWC beams with concrete tension and steel hardening neglected
8.3 Moment-Curvature and ductility of normal and lightweight concrete beams
The previous LWC beam responses are now compared to similar normal concrete (NC) beams. A similar strength normal concrete is used with 0.004 ultimate strain and Thorenfeldt et al. model (1987) which is valid for normal and high strength concrete. This model uses a single equation but with different parameters for the ascending and descending branches:
f
c=
f
c'n
ε
cε
0⎛
⎝⎜
⎞
⎠⎟
(n
−
1)
+
ε
cε
0⎛
⎝⎜
⎞
⎠⎟
nkε
c≤
ε
0:
k
=
1.0
ε
c>
ε
0:
k
=
Max 0.67
+
f
c'
62
, 1.0
⎛
⎝⎜
⎞
⎠⎟
n
=
0.8
+
f
c '17.2
,
ε
0=
f
c'E
cn
n
−
1
⎛
⎝⎜
⎞
⎠⎟
⎧
⎨
⎪
⎪
⎪⎪
⎩
⎪
⎪
⎪
⎪
(14)Latin American Journal of Solids and Structures 11 (2014) 1251-1274 Figure 12 Thorenfeldt et al. model for normal concrete least-square fitted by second or fourth rank polynomials
Latin American Journal of Solids and Structures 11 (2014) 1251-1274
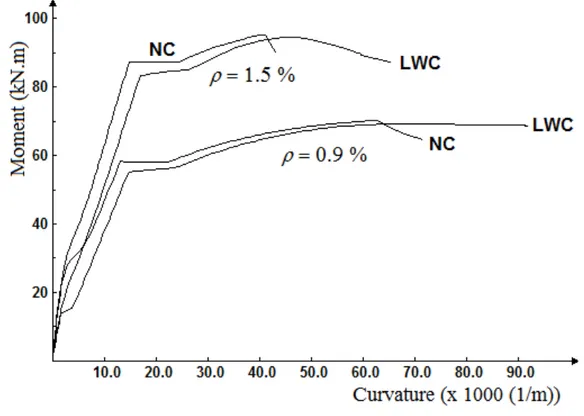
Figure 13 Moment curvature responses of NC and LWC beams
9 M O M EN T -C U R V A T U R E A N D D U C T ILIT Y O F C O LU M N S
9.1 Introduction
Beams are usually designed as under reinforced and tension controlled sections with a sufficient ductility. Concrete ductility is more needed in columns, which are often subjected to axial com-pression forces reducing their energy absorption capacity. A validation of the theoretical model developed is first presented using experimental results from literature with a confined concrete model, and then a parametric investigation is carried out using the previous normal and lightweight concrete models.
9.2 Validation
Red-Latin American Journal of Solids and Structures 11 (2014) 1251-1274 diar (2009) was used because of its integrable form (Figure 14), its simplicity, and its validity for both normal and high strength concrete.
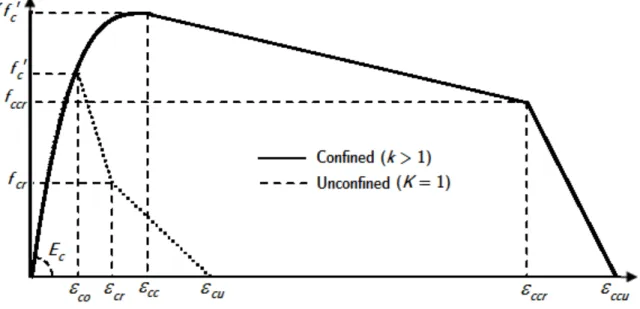
Figure 14 Stress-strain relation for confined high-strength concrete – Reddiar (2009).
The confined model is described by an ascending power equation followed by two linear descending parts :
0
≤
ε
c
≤
εcc
:
f
c=
Kf
c '1
−
1
−
εc
εcc
⎛
⎝⎜
⎞
⎠⎟
n⎛
⎝
⎜
⎞
⎠
⎟
ε
cc≤
εc
≤
εccr
:
f
c=
Kf
c '−
(
f
c'−
12
)
ε
c−
εcc
εccr
−
εcc
⎛
⎝⎜
⎞
⎠⎟
ε
ccr≤
ε
c≤
ε
ccu:
f
c=
f
ccrεc
−
εccu
εccr
−
ε
ccu⎛
⎝⎜
⎞
⎠⎟
⎫
⎬
⎪
⎪
⎪
⎪
⎭
⎪
⎪
⎪
⎪
(15)
The model is completely defined by the confining strength parameter K and the values of the crushing and ultímate strains (εccr and εccu). This offers more versatility to the model as it can
Latin American Journal of Solids and Structures 11 (2014) 1251-1274
ε
cc
=
ε
c0(
1
+
5
(
K
−
1
)
)
ε
c0
=
0.0015
+
f
c'
70000
(
MPa
)
n
=
E
cε
ccKf
c'E
c=
5000
f
c'(
MPa
)
(16)
The linear parts are integrable as first rank polynomials. The power function of the first part is not polynomial but can be integrated analytically. The three corresponding integrals (11) are :
I
1=
∫
σ
d
ε
=
Kf
c'
ε
c+
ε
cc1
−
ε
cε
cc⎛
⎝⎜
⎞
⎠⎟
n+1⎡
⎣
⎢
⎢
⎤
⎦
⎥
⎥
I
2=
∫
σε
d
ε
=
Kf
c'
( )
ε
c2
2
+
(
ε
cc)
2
1
n
+
1
1
−
ε
cε
cc⎛
⎝⎜
⎞
⎠⎟
n+1−
1
n
+
2
1
−
ε
cε
cc⎛
⎝⎜
⎞
⎠⎟
n+2⎛
⎝
⎜
⎞
⎠
⎟
⎡
⎣
⎢
⎢
⎤
⎦
⎥
⎥
I
3=
σε
2d
ε
∫
=
Kf
c'( )
ε
c3
3
+
(
ε
cc)
3
1
−
ε
cε
cc⎛
⎝⎜
⎞
⎠⎟
n+1n
+
1
+
1
−
ε
cε
cc⎛
⎝⎜
⎞
⎠⎟
n+2n
+
2
−
1
−
ε
cε
cc⎛
⎝⎜
⎞
⎠⎟
n+30.5
(
n
+
3
)
⎛
⎝
⎜
⎜
⎜
⎜
⎞
⎠
⎟
⎟
⎟
⎟
⎡
⎣
⎢
⎢
⎢
⎢
⎢
⎤
⎦
⎥
⎥
⎥
⎥
⎥
⎫
⎬
⎪
⎪
⎪
⎪
⎪
⎪
⎪⎪
⎭
⎪
⎪
⎪
⎪
⎪
⎪
⎪
⎪
(17)Latin American Journal of Solids and Structures 11 (2014) 1251-1274 Figure 15 Column section and material data used – Sheikh et al. (1990).
Latin American Journal of Solids and Structures 11 (2014) 1251-1274
Figure 16 Measured and predicted moment-curvature relationships for columns E2 and E13
9.3 Column ductility investigation
Latin American Journal of Solids and Structures 11 (2014) 1251-1274 Figure 17 Moment-curvature for NC and LWC columns with 3.5% reinforcement (8F30)
Latin American Journal of Solids and Structures 11 (2014) 1251-1274
Figure 18 Moment-curvature for NC and LWC columns with 1.57% reinforcement (8F16) at various axial force levels
10 C A P T U R E O F LO C A L A N D P A R T IA L FA ILU R E
Latin American Journal of Solids and Structures 11 (2014) 1251-1274 Figure 19 Moment-curvature predicted at zero axial force for the LWC column and
Latin American Journal of Solids and Structures 11 (2014) 1251-1274
Figure 20 Moment-curvature for a multi steel layer beam with stress distributions at various stages, showing the progressive layer rupture
11 C O N C LU SIO N S
Latin American Journal of Solids and Structures 11 (2014) 1251-1274 not only more economical than numerical integration techniques, but allows a better capture of the sensitive ultimate response. The method was more appealing when combined with material modeling using an efficient constrained least square method for polynomial fitting of experimental stress-strain results. It was also further successfully extended to existing non-integrable material models using the same polynomial approach.
A cknow ledgem ent The authors wish to acknowledge the financial support provided by National Plan for Science, and Technology, (NPST), at King Saud University, Project Number: 10-ADV-1190-02. The authors are grateful to the engineers and the technicians at the concrete and struc-tural laboratories for their assistance during the execution of the experimental program.
References
ACI 213R-87 (1987). Guide for Structural Lightweight Aggregate Concrete. American Concrete Institute, Detroit, Michigan.
Hong Zhi C. (2007). Mechanical properties of lightweight aggregate concrete – Effect of lightweight aggregates on concrete. PhD thesis, Hong Kong University, 270p.
Koh C. G., Teng M. Q., and Wee T. H. (2008). A Plastic-Damage Model for Lightweight Concrete and Nor-mal Weight Concrete. International Journal of Concrete Structures and Materials, Vol.2, No.2, pp. 123~136, December 2008
Muyasser M. J., Daham H.A., Saad M. R. (2011). Flexural behavior of lightweight concrete beams. European Journal of Scientific Research, Vol.58 No.4, pp.582-592
Waldron, C. J., et al. (2005). Demonstration of Use of High-Performance Lightweight Concrete in Bridge Su-perstructure in Virginia”, Journal of performance of Constructed Facilities, Vol. 19, No. 2, May, pp. 146-154.
Russell, Henry (2007). Current Provisions and Needed Research for Lightweight Concrete in Highway Brid-ges. Publication No. FHWA-HRT-07-051, US Department of Transportation.
H. Katkhuda, B. Hanayneh and N. Shatarat (2009). Influence of silica fume on high strength of lightweight concrete. World Academy of Science, Engineering and Technology, 58
Yasar E., Atis C.D., Kilic A. (2004). High strength lightweight concrete made with ternary mixtures of ce-ment, fly ash, silica fume, and scoria as aggregates. Turkish Journal of Engineering, Environment and Science, No 28, pp.95-100
CharifA., ShannagM.J., DghaitherS.(2012).Analytical integration of material stress fields for section
analysis and structure response.Séminaire International Risques et Génie Civil, Université de Batna 26/27
Novembre, 21p
Zupan D., Saje M. (2005). Analytical integration of stress field and tangent material moduli over concrete cross-sections. Computers and Structures, (85), pp.2368-80
Sfakianakis M.G. (1999). Biaxial bending with axial force of reinforced, composite and repaired concrete sec-tions of arbitrary shape by fiber model and computer graphics. Journal of Structural Engineering, 125(6):672– 83.
Latin American Journal of Solids and Structures 11 (2014) 1251-1274
Charalampakis A.E., Koumousis V.K. (2008). Ultimate strength analysis of composite sections under biaxial bending and axial load. Advances in Engineering Software 39, 923-936
Ministry of Petroleum and Mineral Resources, Directorate General of Mineral Resources (1998). Atlas of In-dustrial Minerals, Basalt in Saudi Arabia. Kingdom of Saudi Arabia, p-24, 1419 Hijri.
ShannagM.J., CharifA., DghaitherS.(2013).Developing structural lightweight concrete using volcanic scoria available in Saudi Arabia. Accepted for publication in Arabian Journal of Science and Engineering, 20p.
Thorenfeldt E., Tomaszewicz A., Jensen J.J. (1987). Mechanical properties of high strength concrete and ap-plication to design. Proceedings of the symposium: Utilization of high strength concrete, Stavanger, Norway, June, pp.149-159
Sheikh S.A.,Yeh C.C. (1990) Tied concrete columns under axial load and flexure. Journal of Structural Engi-neering, ASCE, Vol. 116, No. 10, pp.2780-2800
Sheikh S.A.,Yeh C.C. (1992) Analytical moment-curvature relations for tied concrete columns. Journal of Structural Engineering, ASCE, Vol. 118, No. 2, pp.529-544
Rasmussen K.J.R. (2001) Full range stress-strain curves for stainless steel alloys Research report R811, De-partment of Civil Engineering, University of Sydney, 44 pages
Reddiar M.K.M (2009) Stress-strain model of unconfined and confined concrete and stress-block parameters. Msc Thesis, Pondicherry Engineering College, India